


Translate this page into:
Evidence for the potential role of m6A modification in regulating autophagy in models of amyotrophic lateral sclerosis

*Corresponding author: Xueqin Song, Department of Neurology, The Second Hospital of Hebei Medical University; Key Laboratory of Clinical Neurology (Hebei Medical University),Ministry of Education;Neurological Laboratory of Hebei Province, Shijiazhuang, Hebei, China. 27100829@hebmu.edu.cn
-
Received: ,
Accepted: ,
How to cite this article: An D, Han J, Fang P, Bu Y, Ji G, Liu M, et al. Evidence for the potential role of m6A modification in regulating autophagy in models of amyotrophic lateral sclerosis. CytoJournal. 2024;21:33. doi: 10.25259/Cytojournal_101_2024
Abstract
Objective:
Amyotrophic lateral sclerosis (ALS) is a devastating neurodegenerative disease. Research indicates that N6-methyladenosine (m6A) modification plays a crucial role in cellular autophagy during ALS development. This study investigates the role of autophagy in ALS, with a focus on the effect of messenger ribonucleic acid m6A methylation modification on disease progression.
Material and Methods:
We compared m6A levels and regulatory molecule expressions in transgenic superoxide dismutase (SOD1)-G93A and non-transgenic mice, categorized into end-stage and control groups, using quantitative polymerase chain reaction and Western blotting. The NSC-34 cell line, which was modified to model ALS, enabled the investigation of apoptosis, autophagy, and autophagy disruption through terminal deoxynucleotidyl transferase deoxyuridine triphosphate nick-end labeling assays, Western blotting, and fluorescent staining.
Results:
Our findings indicate significantly elevated m6A methylation levels in ALS mice (0.262 ± 0.005) compared with the controls (0.231 ± 0.003) and in the ALS model cells (0.242±0.005) relative to those belonging to the wild-type control group (0.183 ± 0.007). Furthermore, the proteins involved in m6A RNA modification differed between groups, which suggest impaired autophagy flux in the ALS models.
Conclusion:
These results suggest that m6A methylation may accelerate ALS progression through the disruption of autophagic processes. Our study underscores the role of m6A methylation in the pathology of ALS and proposes the targeting of m6A methylation as a potential therapeutic strategy for disease treatment. Although this study primarily used transgenic SOD1-G93A mice and NSC-34 cell models to investigate ALS pathology, potential differences in disease mechanisms between animal models and humans must be considered. Although a correlation was detected between m6A methylation levels and autophagy disruption in ALS, the study primarily established an association rather than provided detailed mechanistic insights.
Keywords
N6-methyladenosine
Autophagy
Amyotrophic lateral sclerosis
Methylation
Modification

INTRODUCTION
Amyotrophic lateral sclerosis (ALS) refers to a devastating neurodegenerative condition that affects adults; it represents the most prevalent motor neuron disorder in this demographic and the third most common neurodegenerative disease overall.[1] In China, approximately 200,000 individuals suffer from ALS, and the incidence is rising.[2] Statistically, the average life expectancy following an ALS diagnosis ranges from 24 months to 50 months.[3] Throughout ALS progression, patients inexorably lose their abilities to move, speak, swallow, and ultimately breathe.[4] To date, the disease has no cure, and a treatment that can effectively arrest disease progression remains unavailable.
Around 20% of familial ALS cases show an association with mutations in the gene responsible for encoding copper– zinc superoxide dismutase (SOD1).[5] Transgenic human SOD1 (hSOD1) mouse serve as the gold standard in ALS research. In human ALS and transgenic hSOD1 mouse, neuroinflammation and autophagy play an important role in ALS pathogenesis.[6,7]
Recent research has highlighted mitochondrial dysfunction as a pivotal early pathophysiological event in ALS and autophagy’s critical role in the elimination of damaged mitochondria. This process is essential for the preservation of mitochondrial health within cells.[8] Increasing pieces of evidence suggest that impairments in autophagy considerably contribute to the onset and progression of ALS.[9] Several proteins – such as optineurin (OPTN), phosphatase and tensin homolog-induced kinase 1, PARKIN, and tank-binding kinase 1, are integral to autophagy – and exhibit strong associations with ALS.[10-12] One of the aims of this study is to elucidate the relationship between mitochondrial dysfunction and impaired autophagy in ALS development.
Recent epigenetic research illuminated the role of messenger ribonucleic acid (mRNA) methylation, particularly N6-methyladenosine (m6A) modification, in autophagy processes.[13,14] m6A represents a widespread form of mRNA modification, and it is crucial for the regulation of the eukaryotic transcriptome.[15-19] This modification influences various aspects of mRNA function, including splicing, export, localization, translation, and stability, and thus plays a pivotal role across diverse biological processes.[20] The machinery for m6A modification consists of methyltransferase complexes known as “writers,” which methylate adenosine at the N6 position; demethylases, referred to as “erasers,” which remove these modifications; RNA-binding proteins or “readers,” which dictate the outcome of m6A-modified mRNAs.[21] The “writers” include enzymes, such as methyltransferase-like 3 (METTL3) and METTL14, and Wilm’s tumor 1-associated protein (WTAP).[22-24] “Erasers” encompass fat mass and obesity-associated protein (FTO) and human AlkB homolog 5 (ALKBH5).[25,26] The “readers” include members of the YT521-B homology domain family, such as YTH domain family, member 1 (YTHDF1), YTHDF2, and YTHDF3.[27,28] In autophagy, m6A modification of the uncoordinated 51-like kinase 1 (ULK1) protein mRNA – an autophagy initiating molecule – occurs in the 3'-untranslated region. This modification targets ULK1 for degradation by YTHDF2. However, the removal of m6A from ULK1 mRNA through the action of FTO extends ULK1’s half-life.[29-31] Moreover, the transcriptional expression of autophagy-related genes Atg5 and Atg7 is regulated by m6A, with the silencing of FTO in adipocytes leading to decreased expression of these genes and reduced autophagosome formation. These findings underscore the critical role of m6A mRNA modification in the regulation of autophagy-related protein expression and normal progression of autophagy.[14,32]
The function of m6A methylation modification in the nervous system has become a focal point of interest. m6A methylation modifications facilitate the decay of mRNAs that contribute to crucial processes, such as neurogenesis, the cell cycle, and neuronal differentiation within the embryonic mouse cortex.[33] Moreover, the m6A demethylase FTO, which is abundantly found on neuronal axons, can be targeted to inhibit its activity in axons to increase the m6A levels and subsequently inhibits axon elongation.[34] Beyond structural aspects, m6A methylation is implicated in the regulation of neural functions, which affect dopaminergic signaling,[35] behavioral responses, and learning and memory mechanisms.[36] These findings highlight the potential role of m6A methylation in ensuring the normal functioning of the nervous system. However, the potential influence of m6A methylation on ALS remains unexplored and represents an intriguing area for future research.
Given that m6A methylation can modulate autophagy and the critical link between autophagy – a selective form of autophagy – and ALS, an intriguing question emerges: Does m6A methylation exert regulatory effects on autophagy in motor neurons, and is its expression altered in ALS? This study aimed to explore these questions by employing a range of methodologies, including quantitative polymerase chain reaction (PCR) and Western blot analysis, staining with mitochondrial and lysosomal fluorescence probes, and ultrastructural observations of animal and cell models of ALS. The results of these investigations broaden our understanding of the regulatory mechanisms governing the autophagy pathway, enhance insights into ALS pathogenesis, and potentially unveil novel therapeutic targets and strategies for ALS treatment.
MATERIAL AND METHODS
Animals
For the animal experiment, we selected transgenic hSOD1-G93A mice and their non-transgenic counterparts. The transgenic mice were hybrids of female B6SJLF1 and male hemizygous carriers [B6SJLTg(SOD1-G93A)1Gur/J] sourced from Jackson Laboratories (catalog #002726), with their identification confirmed by PCR-based genotyping of tail/ blood DNA. The strains B6SJL-Tg(SOD1-G93A)1Gur/J and B6SJL-Tg(SOD1)2Gur/J corresponded to the SOD1G93A and SOD1 wild-type (WT) transgenic mice, respectively. Based on their pathological stages, male ALS mice were allocated into an end-stage experimental group (110–130 days old, characterized by their inability to stand independently within 30 s of being placed on their back or side) and a control group consisting of WT non-transgenic mice (120 days old), with each group comprising six mice. The mice were euthanized through deep anesthesia with 1% sodium pentobarbital (57-33-0, Sigma-Aldrich, St. Louis, Missouri, USA) 30–40 mg/kg and perfused transcardially with saline followed by 4% paraformaldehyde (P1110, Solarbio, Beijing, China). Subsequently, the lumbar enlargement was carefully extracted from the spinal cord for further analysis. The care of animals and experimental protocols were authorized by the Research Ethics Committee, which ensured compliance with ethical standards for animal research. The care of the animals and the experimental protocols were authorized by the Research Ethics Committee of the Second Hospital of Hebei Medical University, ensuring compliance with ethical standards for animal research (Approval Letter NO.:2023-AE328).
Quantitative real-time PCR (qRT-PCR)
The mice were sacrificed, and the intumescentia lumbalis of the spinal cord was quickly frozen in liquid nitrogen. Total RNA extraction was performed using the RNeasy Lipid Tissue Mini Kit (QIAGEN, Cat.No.:74804, Germany), in accordance with the manufacturer’s protocol. After reverse transcription with SweScript All-in-One RT reverse transcriptase (Servicebio, Cat.No.:G3337, Wuhan, China) and primers (Sangon Biotech, Shanghai, China), qRT-PCR was conducted using Selective Yellow and Blue Fluorescence Reporter Green (Generay Biotech Co., Ltd., GK8020) on an Agilent Technologies system (Santa Clara, USA). The expression level of mRNA was calculated using the 2-ΔΔCt method, and the primers used are listed in Table 1.
| Gene | Forward primer | Reverse primer |
|---|---|---|
| METTL3 | TCCATCCGTCTTGCCATCTCTAC | CCTCGCTTTACCTCAATCAACTCC |
| METTL14 | AGCAGACATAGAAGCCTTTGACATC | TCCAGCATTTCTCATTCGCAGTG |
| WTAP | AGAACATTCTTGTCATGCGGCTAG | CACACTCGGCTGCTGAACTTG |
| FTO | GGAGGAACGAGAGCGGGAAG | CTGCCACTGCTGATAGAACTCATC |
| ALKBH5 | CTTCAGCGACTCGGCACTTTG | CGGCAGAGAAAGCACAGGTTC |
| HNRNPD | GTATCAGCAGCAGCAGCAGTG | TCCATAGTTGCCATAGCCTTGATTC |
| YTHDF1 | ACAATGACTTTGAGCCCTACCTTTC | TGGATGGTGGATAGTAACTGGACAG |
| YTHDF2 | TGCCATGTCAGACTCCTACTTACC | CTCCGTTGCTCAGTTGTCCATAAG |
| YTHDF3 | AGTTACGGCTATCCACCTAGTTCTC | GTCCAGTCATGCCTTGCTCAATAC |
| GAPDH | CCTCGTCCCGTAGACAAAATG | TGAGGTCAATGAAGGGGTCGT |
qRT-PCR: Quantitative real-time polymerase chain reaction, METTL3: Methyltransferase-like 3, METTL14: Methyltransferase-like 14, WTAP: Wilm’s tumor 1-associated protein, FTO: Fat mass and obesity-associated protein, ALKBH5: AlkB homolog 5, YTHDF1: YTH domain family, member 1, YTHDF2: YTH domain family, member 2, YTHDF3: YTH domain family, member 3, HNRNPD: Heterogeneous Nuclear Ribonucleoprotein D
Western blot analysis
Tissues were collected from the sacrificed mice and stored tubes. Protein isolation was performed using a protein extraction kit (Applygen Technologies Inc., P1250). The extracted proteins were then separated through sodium dodecyl sulfate–polyacrylamide gel electrophoresis and subsequently transferred onto polyvinylidene fluoride membranes. The membranes were blocked for 1 h at room temperature with 5% nonfat milk, followed by an overnight incubation at 4°C with the following primary antibodies: METTL3 (1:1000 dilution, 15073-1-AP, Proteintech, Wuhan, China), YTHDF2 (1:1000 dilution, 24744-1-AP, Proteintech, Wuhan, China), heterogeneous nuclear ribonucleoprotein (HNRNP) (1:1000 dilution, 11760-1-AP, Proteintech, Wuhan, China), ALKBH5 (1:1000 dilution, 16837-1-AP, Proteintech, Wuhan, China), P62 (1:1000 dilution, 18420-1-AP, Proteintech, Wuhan, China), microtubule-associated protein light chain (LC) 3 (1:1000 dilution, 14600-1-AP, Proteintech, Wuhan, China), and β-actin (1:1000 dilution, ab8227, Abcam, Cambridge, UK). The membranes were then washed thrice for 15 min each. Subsequently, the membranes were incubated with secondary antibodies (1:1000 dilution, ab6721, Abcam, Cambridge, UK) for 1 h at 37°C. Following incubation, they were scanned using an Odyssey Infrared Imaging System (LI-COR, Lincoln, NE). Protein band expression levels were subjective to quantitative analysis using ImageJ software (version 1.5f, National Institutes of Health, Bethesda, Maryland, USA).
Determination of m6A methylation levels
Sample collection was followed by RNA extraction using an RNA extraction kit (Shanghai Generay Biotech Co., Ltd). The methylation levels of m6A RNA in the total RNA extracted from tissues and cells were quantified using an EpiQuik m6A RNA Methylation Quantification Kit (Epigentek, Cat. No.: P-9005, USA). This process involved the binding of the total RNA to a pore plate containing a high-efficiency RNA binding solution. The presence of m6A was detected using specific capture and detection antibodies. The m6A methylation levels were detected using a microplate reader (DNM-9602, PERLONG, Beijing, China). The methylation level, which was indicated by the measured optical density (OD) value, was quantitatively assessed using a standard curve for the calculation of m6A content in the samples.
Cell culture and transfection
The NSC-34 cell line (non-primary cell line donated by the professor Yuesheng Zhang (Di An’s teacher), Roswell Park) is an excellent choice for the investigation of the biological characteristics of motor neurons in vitro. The previous studies used a stable transfection method to establish an in vitro ALS cell culture model that stably expressed human SOD1-G93A gene. This model serves as a crucial foundation for the research on the role of the SOD1-G93A gene in ALS pathogenesis and provides a valuable test platform for the development and evaluation of novel ALS treatments. NSC34 cells were engineered to express green fluorescent protein-empty vector (GFP-E), GFP-human SOD1 AT (hSOD1-WT), and GFP-hSOD1-G93A, as previously detailed in our laboratory. The cells were cultivated in a 5% (CO2) environment at 37°C in Dulbecco’s modified Eagle’s medium (DMEM; Solarbio, Cat. No.: 12100, Beijing, China) supplemented with 10% heat-inactivated fetal bovine serum (FBSInvitrogen, Cat. No.: 16000-044, USA) and antibiotics (100 IU/mL penicillin and 100 µg/mL streptomycin) to ensure optimal growth. Transfection was achieved using Lipofectamine 2000 transfection reagent (Invitrogen, Cat. No.: 11668-019, USA), following the manufacturer’s protocol. At 48 h post-transfection, the cells were collected, and their extracts were prepared for subsequent assays. Three sets of cells were identified as free from Mycoplasma contamination through the culturing method.
Cell line authentication through short tandem repeat (STR) profiling
To confirm the identity of GFP-E, hSOD1-WT, and hSOD1-G93A-transfected cells, we performed (short tandem repeat) STR profiling. Genomic DNA extraction was performed using the Qiagen DNeasy Blood and Tissue Kit (Qiagen, Cat.No.:69506, Germany). STR loci were amplified using the Promega PowerPlex 16 System (Promega Corporation, Madison, Wisconsin, USA), which targets 16 STR loci and the amelogenin gene. PCR amplification was conducted at 95°C for 2 min, followed by 30 cycles of denaturation at 95°C for 30 s, annealing at 60°C for 30 s, and extension at 72°C for 1 min. A final extension step was performed at 72°C for 10 min.
An ABI 3500 Genetic Analyzer was used to analyze the amplified products. The STR profiles were compared with the reference profiles in the American Type Culture Collection STR database. The transfected cell line’s STR profile matched the reference profile of the parent cell line with a ≥80% match, which confirmed the cell line’s identity post-transfection.
Cell counting kit-8 (CCK-8) assay
Cells were seeded at a density of 1×10³ cells/well in a 96-well plate, with 100 µL cell suspension per well. The seeded plate was placed in a 37℃, 5% CO2 incubator (Galaxy 170 R, Eppendorf, Hamburg, Germany) for 24 h to allow cells to adhere and enter the logarithmic growth phase. Then, 10 µL CCK-8 reagent was added to each well to avoiding bubble formation. The plate was gently shaken to ensure thorough mixing of the CCK-8 reagent (CA1210, Solarbio, Beijing, China) with the culture medium. The plate was returned to the incubator and incubated for 2 h. The absorbance at 450 nm was measured using a microplate reader (Multiskan FC Microplate Photometer, Thermo Fisher Scientific, Waltham, Massachusetts, USA).
Terminal deoxynucleotidyl transferase nick end labeling (TUNEL) Staining
We employed a one-step TUNEL apoptosis assay kit (Elabscience, E-CK-A320, Wuhan, China) for TUNEL staining. The cells were initially permeabilized using 0.1% Triton X-100 (T8200, Solarbio, Beijing, China) and then subjected to a 2 h incubation with the reaction mixture at 37°C. Nuclei were counterstained with Hoechst dye and visualized under a fluorescence microscope (Olympus FV1000, Japan).
Confocal microscopy
Mito- (MX4307) and Lyso-tracer (MX4320) probes were applied for immunofluorescence. Staining, incubated at 37°C for 30 min, subsequently observed, and enumerated using an inverted confocal laser microscope (ZEISS LSM900, Germany). Another evaluation focused on the colocalization of mitochondria and lysosomes. To quantify autophagic activity, we employed assay kit for the co-localization of mitochondria and lysosomes. Mtphagy Dye, which binds chemically to mitochondria within cells, exhibits a low fluorescence under normal conditions. During fusion of autophagosomes with lysosomes, the fluorescence intensity of Mtphagy Dye increases. Lyso Dye was specifically used to stain lysosomes to verify this fusion event (Mitophagy Detection Kit, MD01, China).
Statistical analysis
We used GraphPad Prism software (version 9.0, GraphPad Software, Inc., San Diego, California, USA) for data analysis. An independent sample t-test was performed to compare the differences between the two groups. For comparisons between more than two groups, one-way analysis of variance was conducted to assess the potential differences between the groups, with statistical significance defined as P < 0.05. All data results are presented as mean ± standard deviation.
RESULTS
Differences in overall m6A methylation levels were observed in the spinal cord tissue of SOD1-G93A mouse animal model and ALS cell model
To explore the potential role of m6A modification in ALS pathogenesis, we compared m6A levels in spinal cord tissue samples and cell models. Analysis of spinal cord tissue samples revealed the significantly lower m6A levels of the WT (SOD1-WT) than those of the ALS mutant group (SOD1-G93A), with the WT exhibiting an m6A RNA methylation ratio compared the ALS group. This difference showed statistical significance (P < 0.05) [Figure 1a]. In the cellular model, there is a significant difference in m6A levels between the ALS mutant group (SOD1-G93A) and the SOD1-WT group (P < 0.05), while there is no significant difference between the SOD1-WT group and the Empty group [Figure 1b].
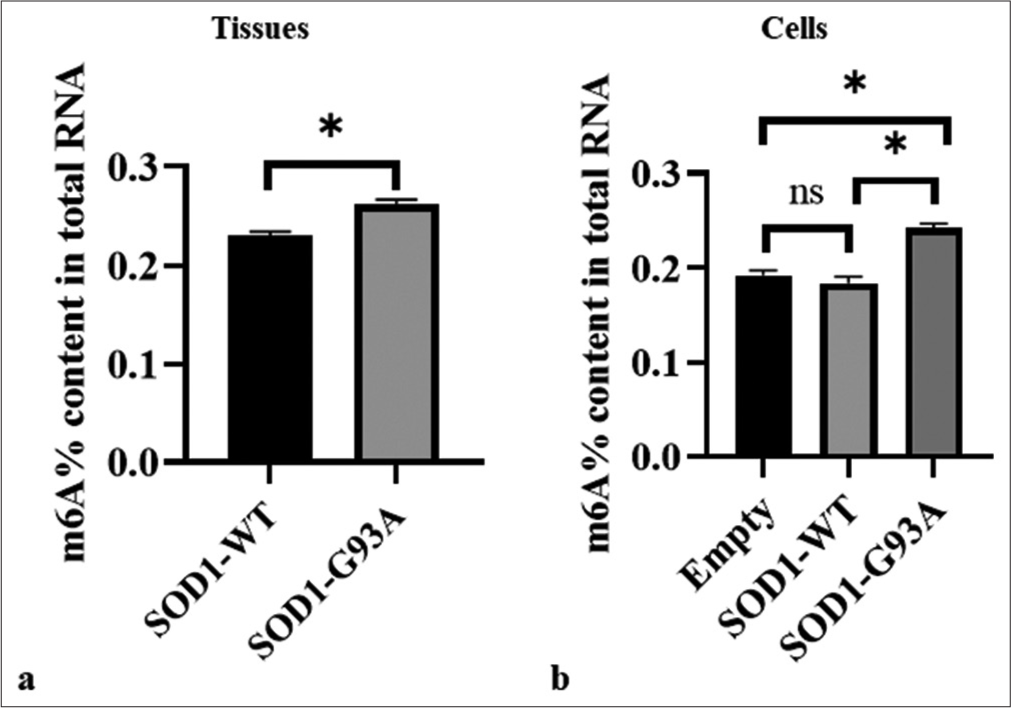
- Differences in overall m6A methylation levels in the spinal cord tissue of SOD1-G93A mouse animal model and amyotrophic lateral sclerosis cell model. (a) Samples were tissue types. The vertical axis represents the m6A% content of the total RNA, and the horizontal axis denotes various groupings. (b) Samples comprised cell types. The vertical axis represents the m6A% content of the total RNA, and the horizontal axis denotes different groupings. The three groups showed significant differences (ns: no significant difference, *P < 0.05). SOD1-G93A /SOD1- WT: Superoxide Dismutase 1 -G93A mutant/Superoxide Dismutase 1-wild-type.
These results suggest that m6A modification of mRNA may perform a complex function in ALS progression.
Differences in gene expression of m6A methylation-related regulatory molecules were found in the spinal cord tissue of SOD1-G93A mouse model and ALS cell model
Building on the analysis of m6A levels in ALS and WT groups, we, further, investigated the expression levels of m6A methylation-related regulatory molecules in the tissue and cellular models of ALS. The results of analysis involving tissue samples indicated the high expression of METTL3, METTL14, and WTAP in the SOD1-G93A mutant group compared with the SOD1-WT control group, with significant differences (P < 0.001) [Figure 2a]. The demethylases FTO and ALKBH5 also exhibited higher expressions in the ALS tissue samples compared with the WT, with significant differences (P < 0.001) [Figure 2a].
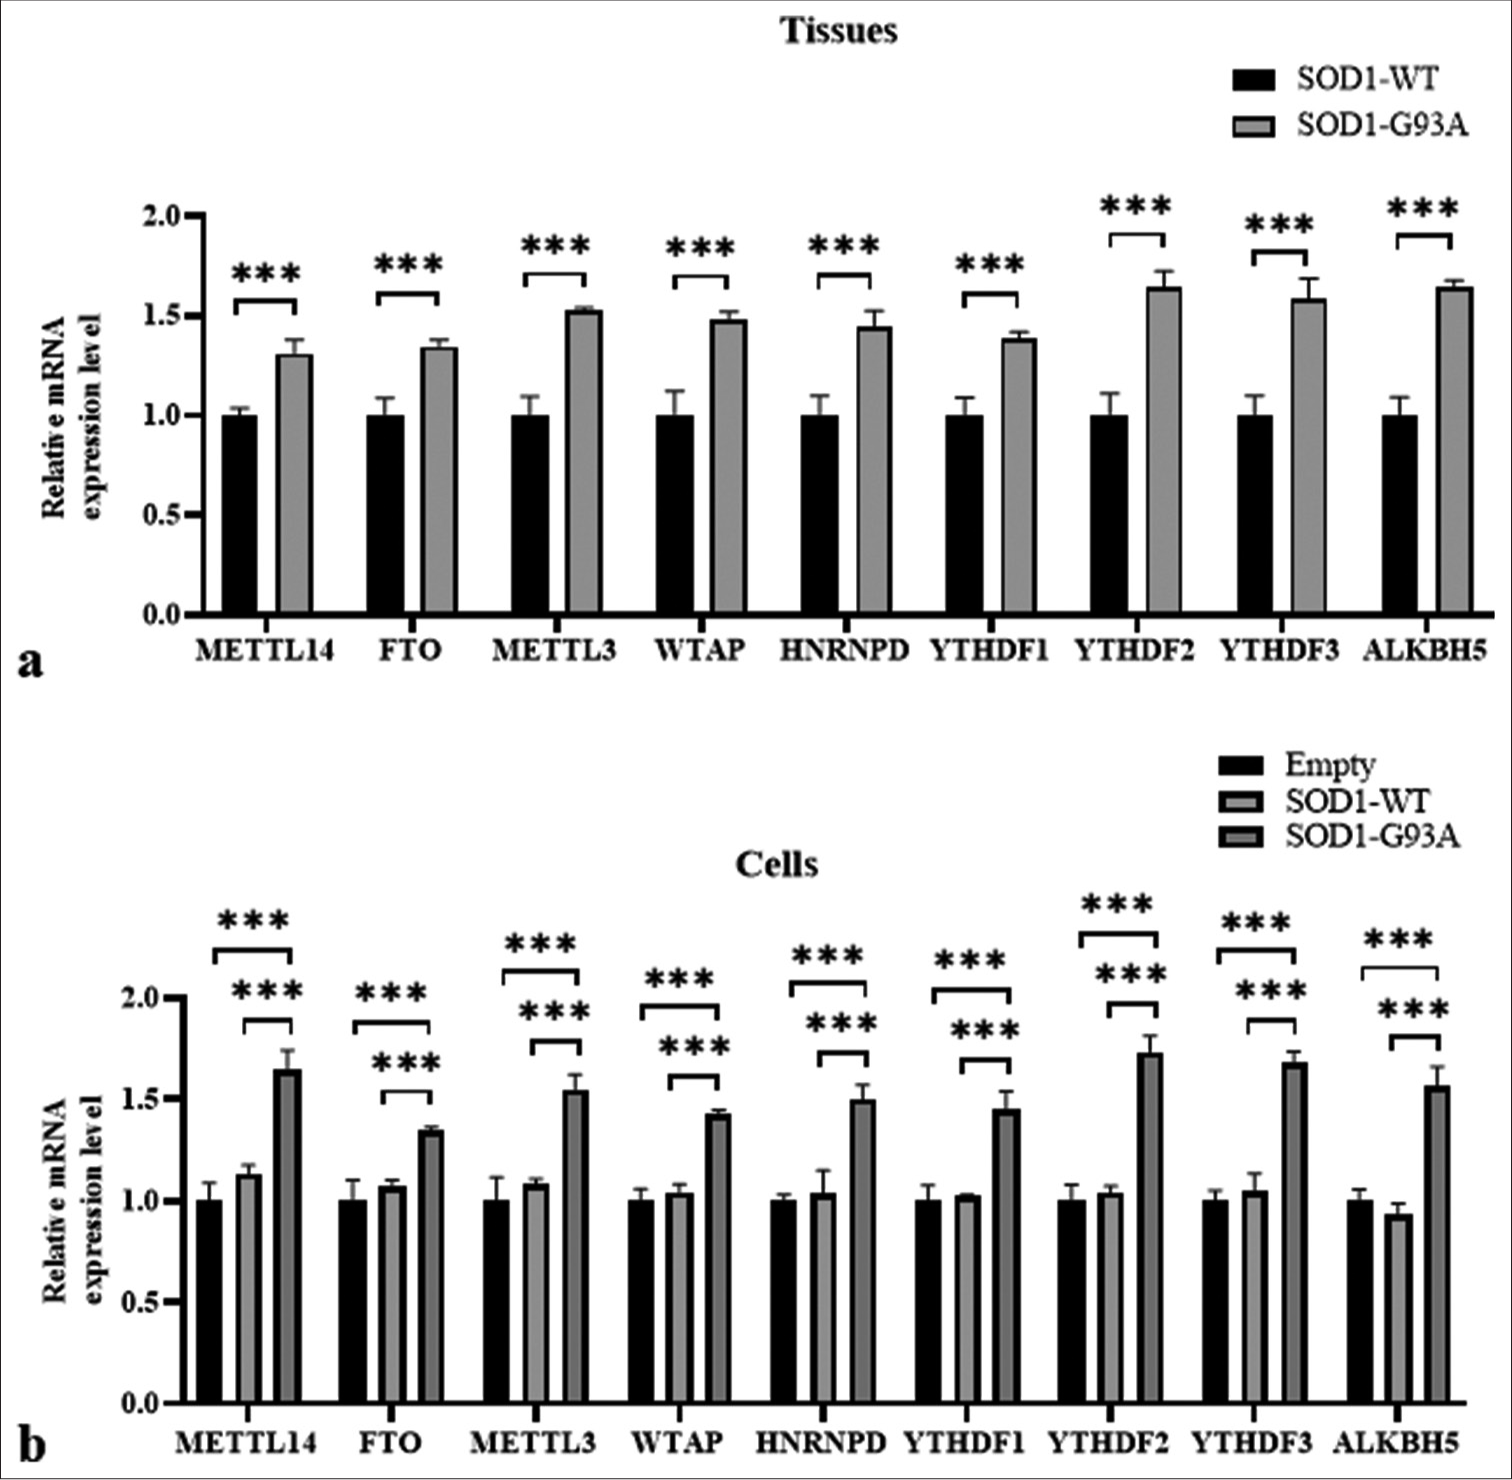
- Differences in gene expressions of m6A methylation-related regulatory molecules found in the spinal cord tissue of SOD1-G93A mouse model and amyotrophic lateral sclerosis cell model. (a) Samples were tissue types. The vertical axis represents relative mRNA expression levels, and the horizontal axis denotes genes. (b) Samples were cell types. The vertical axis represents mRNA relative expression levels, and the horizontal axis denotes genes (***P < 0.001). (METTL14: methyltransferase-like 14; FTO: Fat mass and obesity-associated protein; METTL3: Methyltransferase-like 3, WTAP: Wilms’ tumor 1-associating protein, HNRNPD: Heterogeneous nuclear ribonucleoprotein D, YTHDF1: YTH N6-methyladenosine RNA binding protein 1, YTHDF2: YTH N6-methyladenosine RNA binding protein 2, YTHDF3: YTH N6-methyladenosine RNA binding protein 3, ALKBH5: AlkB homolog 5, RNA demethylase, GAPDH: Glyceraldehyde-3-phosphate dehydrogenase. SOD1-G93A /SOD1- WT: Superoxide Dismutase 1 - G93A mutant/Superoxide Dismutase 1-wild-type.)
In the cell model, the expression values of FTO, METTL3, HNRNPD, YTHDF2, ALKBH5, METTL14, WTAP, YTHDF1, and YTHDF3 genes were consistent with the tissue results. The ALS group (SOD1-G93A) exhibited higher values than the WT group (SOD1-WT) (P < 0.001) [Figure 2b].
Overall, these findings suggest considerable changes in the expressions of m6A methylation-related genes in the SOD1-G93A ALS model, and they potentially reflect alterations in RNA metabolism and the regulation linked to disease pathology.
Differences in the expressions of some m6A-methylated original proteins were found in the spinal cord tissue of SOD1-G93A mouse animal model and ALS cell model
Through Western blotting, quantitative analysis was conducted on the expression levels of m6A methylation-related proteins ALKBH5, HNRNP, METTL3, and YTHDF2 in ALS-related tissue samples and cell models. Our research results indicate that compared with the control group, the protein levels of ALKBH5, HNRNP, METTL3, and YTHDF2 in ALS-related tissue samples were significantly increased (P < 0.001) [Figure 3a and b]. Specifically, in tissue samples, the expression levels of ALKBH5, HNRNP, METTL3, and YTHDF2 were significantly higher in the ALS group compared to the WT group (P < 0.001) [Figure 3a and b].
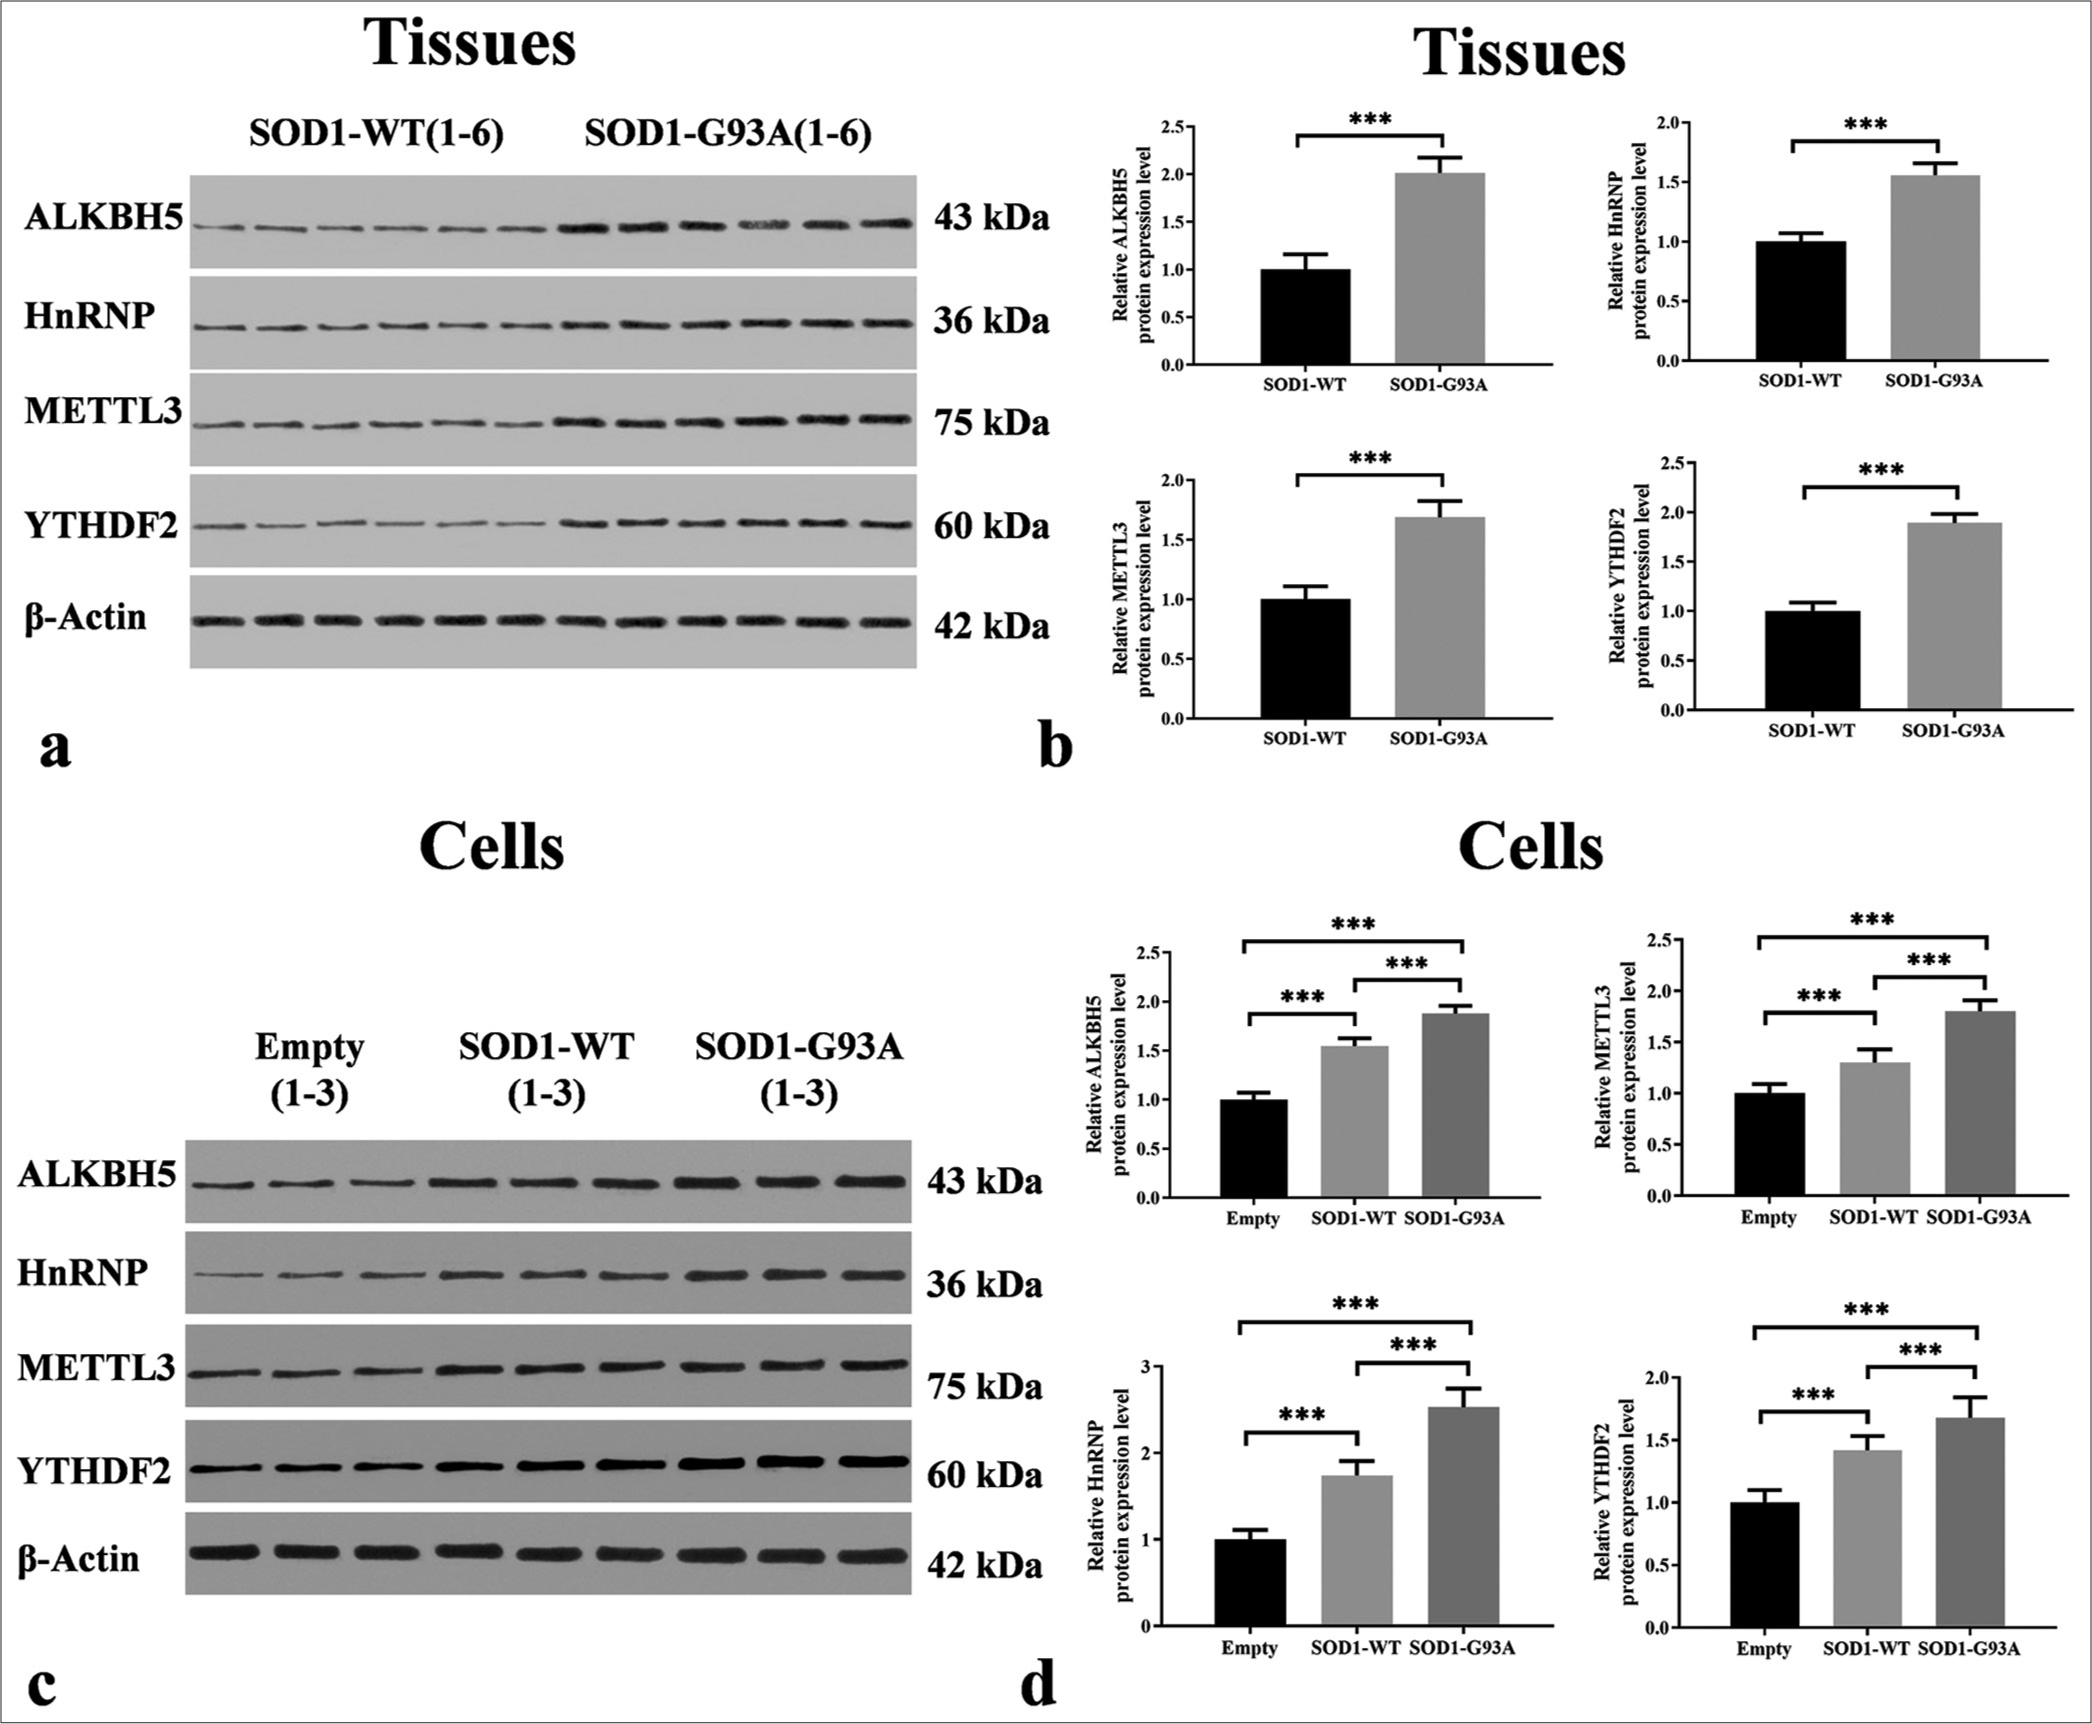
- Differential expressions of m6A methyltransferases in the spinal cord tissues of SOD1-G93A mouse model and amyotrophic lateral sclerosis cell model. (a) Tissue samples, with groupings shown at the top and proteins on the left. Protein band images can be found in the middle. (b) Protein expression levels in tissue samples, with the vertical axis representing relative protein expression levels and the horizontal axis indicating groupings. (c) Cell samples, with groupings displayed at the top and proteins on the left. Protein band images can be found in the middle. (d) Protein expression levels in cell samples, with the vertical axis representing relative protein expression levels and the horizontal axis denoting groupings (***P < 0.001). METTL3: Methyltransferase-like 3, YTHDF2: YTH N6-methyladenosine RNA binding protein 2, ALKBH5: AlkB homolog 5. HnRNP/SOD1/SOD1-WT: Heterogeneous Nuclear Ribonucleoprotein/Superoxide Dismutase 1/ Superoxide Dismutase 1-wild-type
In the cellular models, these four proteins presented significant expression differences between the empty and WT groups. Compared with those in the WT group, the ALKBH5, METTL3, HNRNP, and YTHDF2 protein levels in the ALS model were significantly higher (P < 0.001), which is consistent with the findings observed in the tissue samples and highlights the potential key role of these genes in the pathophysiology of ALS. This finding may also elucidate the complex regulatory role of these proteins in the pathogenesis of ALS. Compared to the ALS (SOD1-G93A) group, the expression levels of ALKBH5, HNRNP, METTL3, and YTHDF2 were significantly reduced in the WT group (P < 0.001) [Figure 3c and d].
Autophagy flow was blocked in the ALS cell model
TUNEL assay for cell apoptosis
TUNEL assay revealed subdued apoptotic signaling in the empty plasmid control cells. Conversely, the WT SOD1 cells showed an elevated level of apoptotic activity, which is potentially reflective of baseline apoptosis in healthy cells. Importantly, cells with SOD1-G93A mutations associated with ALS exhibited significantly increased apoptotic signals (P < 0.001) [Figure 4a and b]. These observations emphasize the potential link between SOD1-G93A mutations and apoptosis pathways, which supports the view that such mutations may exacerbate cell death in ALS disease states. CCK-8 assay results indicate the significantly lower cell viability of the SOD1-G93A group compared with the Empty and SOD1-WT groups (P < 0.001) [Figure 4c]. No significant difference was observed in the cell viability between the Empty and SOD1-WT groups.
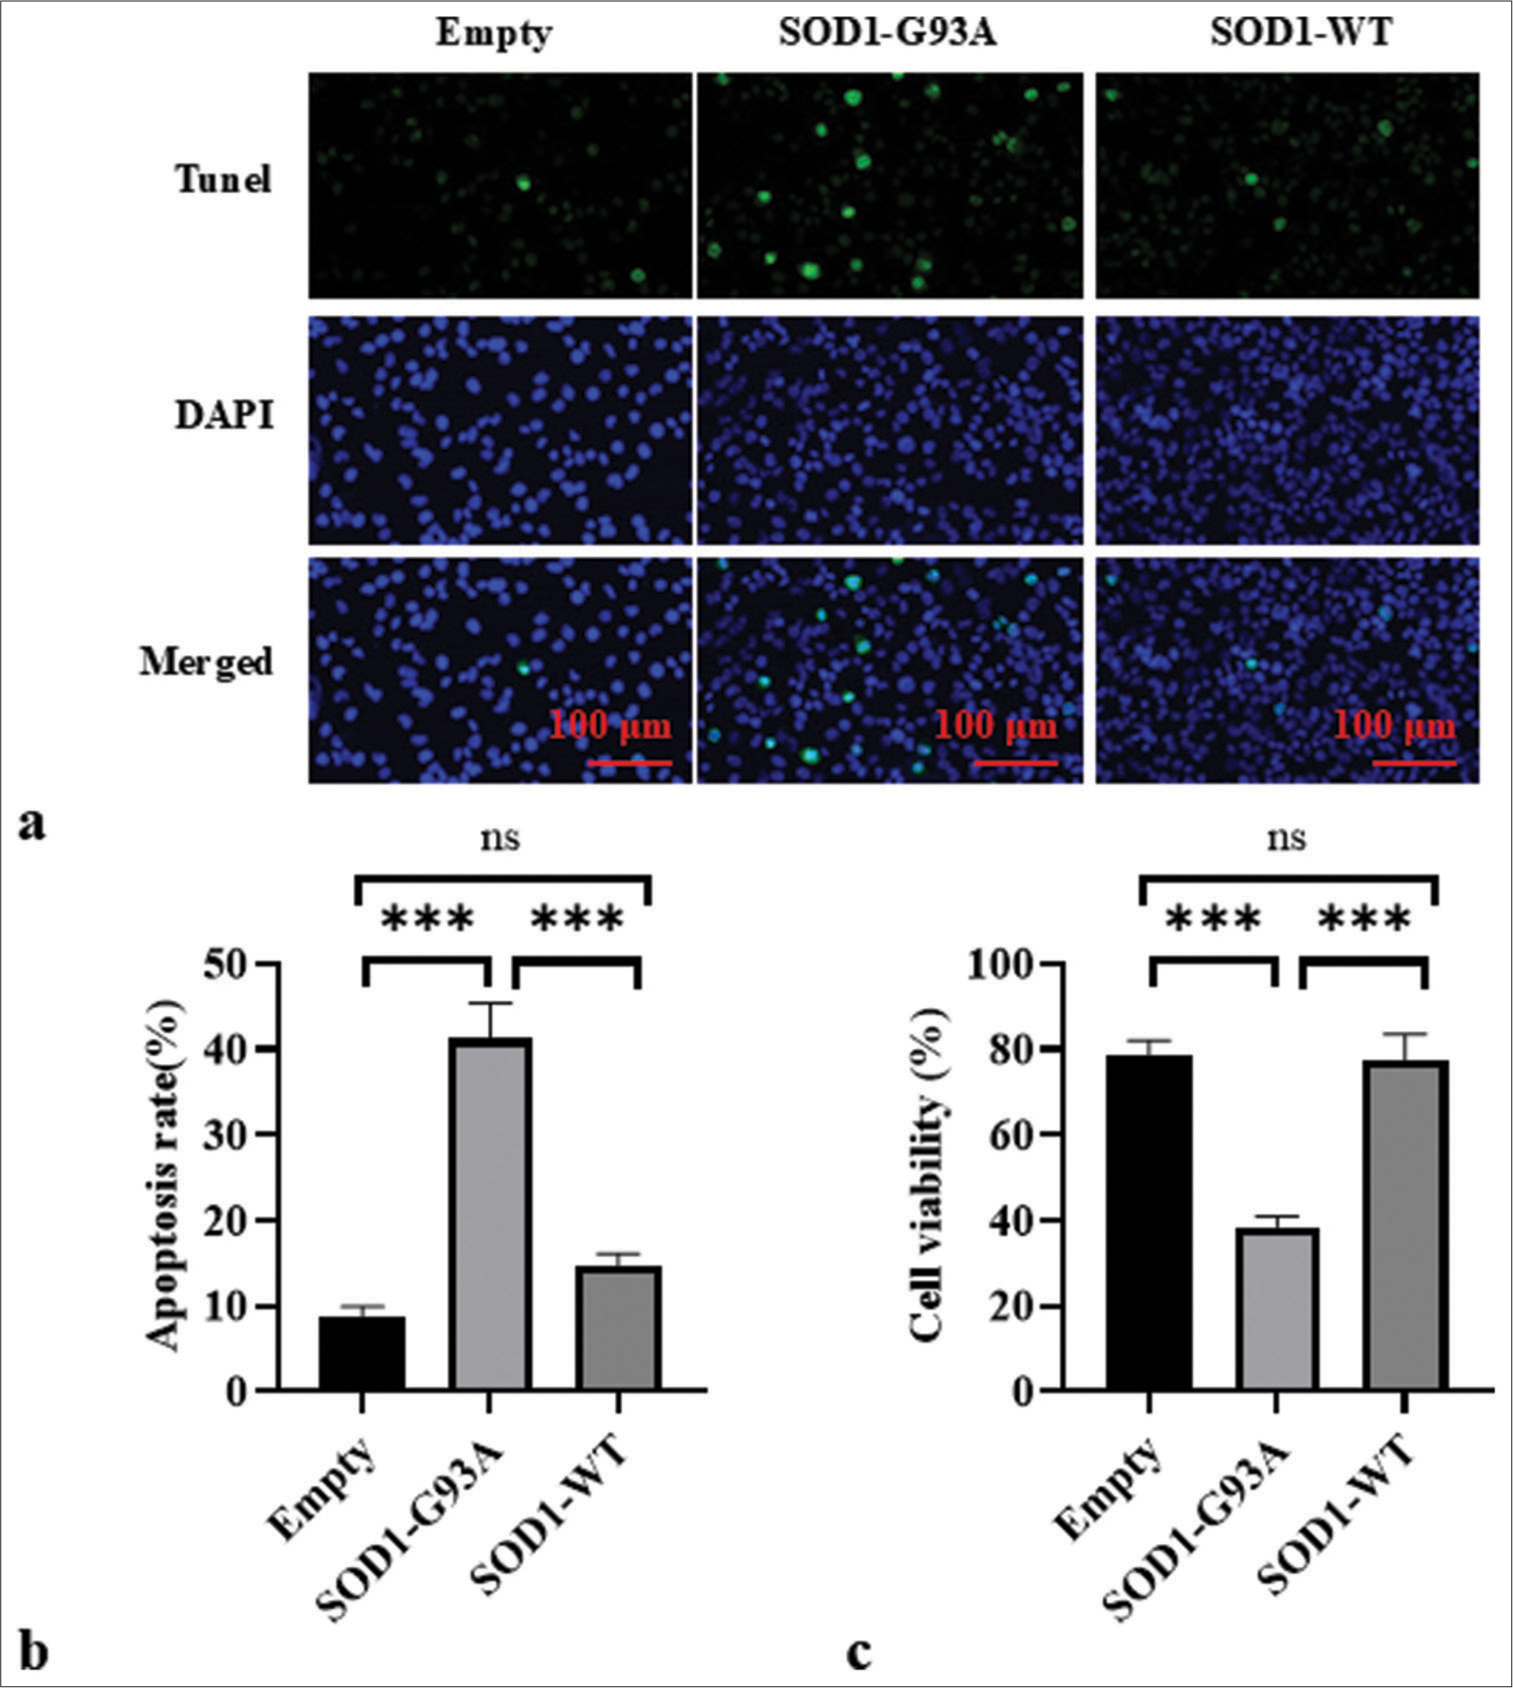
- Apoptosis in each group was assessed through TUNEL staining. (a) Cell apoptosis in each group was observed by TUNEL staining. DAPI staining revealed the uniform blue fluorescence of the nuclei of all groups. TUNEL staining showed a green fluorescent signal, which indicates the DNA breakage often associated with apoptosis. The composite image shows an overlay of blue and green fluorescence. (b) Empty, SOD1-G93A, and SOD1-WT group apoptosis ratio. (c) Cell viability in Empty, SOD1-G93A, and SOD1-WT groups. (ns: no significant difference, ***P<0.001). (TUNEL: Terminal deoxynucleotidyl transferase dUTP nick end labeling; DAPI: 4',6-diamidino-2-phenylindole, SOD1-G93A/SOD1_WT: Superoxide Dismutase 1 - G93A mutant/Superoxide Dismutase 1-wild-type.)
Autophagy assessment
Western blot analysis was employed to scrutinize the essential autophagy markers in the ALS cell model. [Figures 5a-c] show that compared with the Empty and SOD1-WT groups, the expression of p62 protein and the LC3II/LC3I protein expression ratio were significantly reduced in the SOD1-G93A group (P < 0.05). This result indicates an increased level of autophagy.
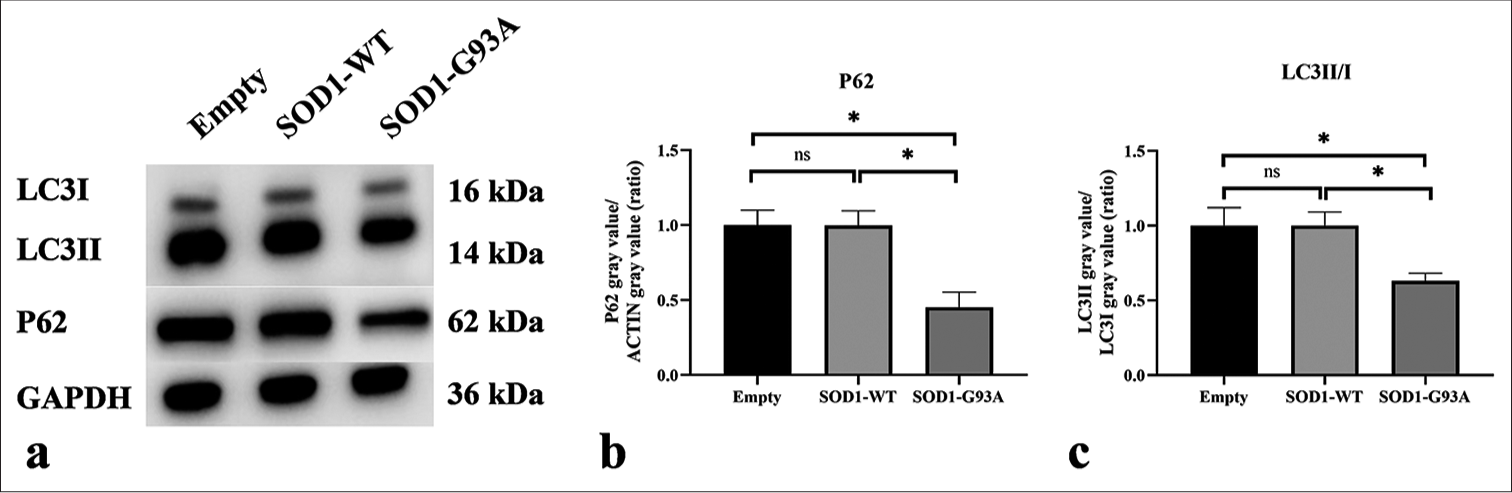
- Western blot was used to detect the expression levels of P62 and LC3II/I. (a) Western blot analysis of LC3II, LC3I, and P62 proteins. (b) Quantitative analysis of P62. (c) Quantitative analysis of LC3II/I (ns: no significant difference, *P < 0.05). P62: Sequestosome 1, LC3: Microtubule-associated protein 1 light chain 3, LC3-I: The cytosolic form of LC3, LC3-II: The membrane-bound form that is associated with autophagosomes. (GAPDH: Glyceraldehyde-3-phosphate dehydrogenase.)
Mito- and Lyso-tracer probes were used for the immunofluorescence-based visualization of mitochondrial morphology and lysosome counts, alongside their colocalization, through inverted laser confocal microscopy. This approach discerned the effect of ALS on mitochondrial configuration and autophagic functionality within model cells. Our observations revealed the following for cells harboring the ALS-related SOD1-G93A mutation: atypical mitochondrial shapes, a diminished count of lysosomes, and less colocalization with mitochondria [Figure 6].
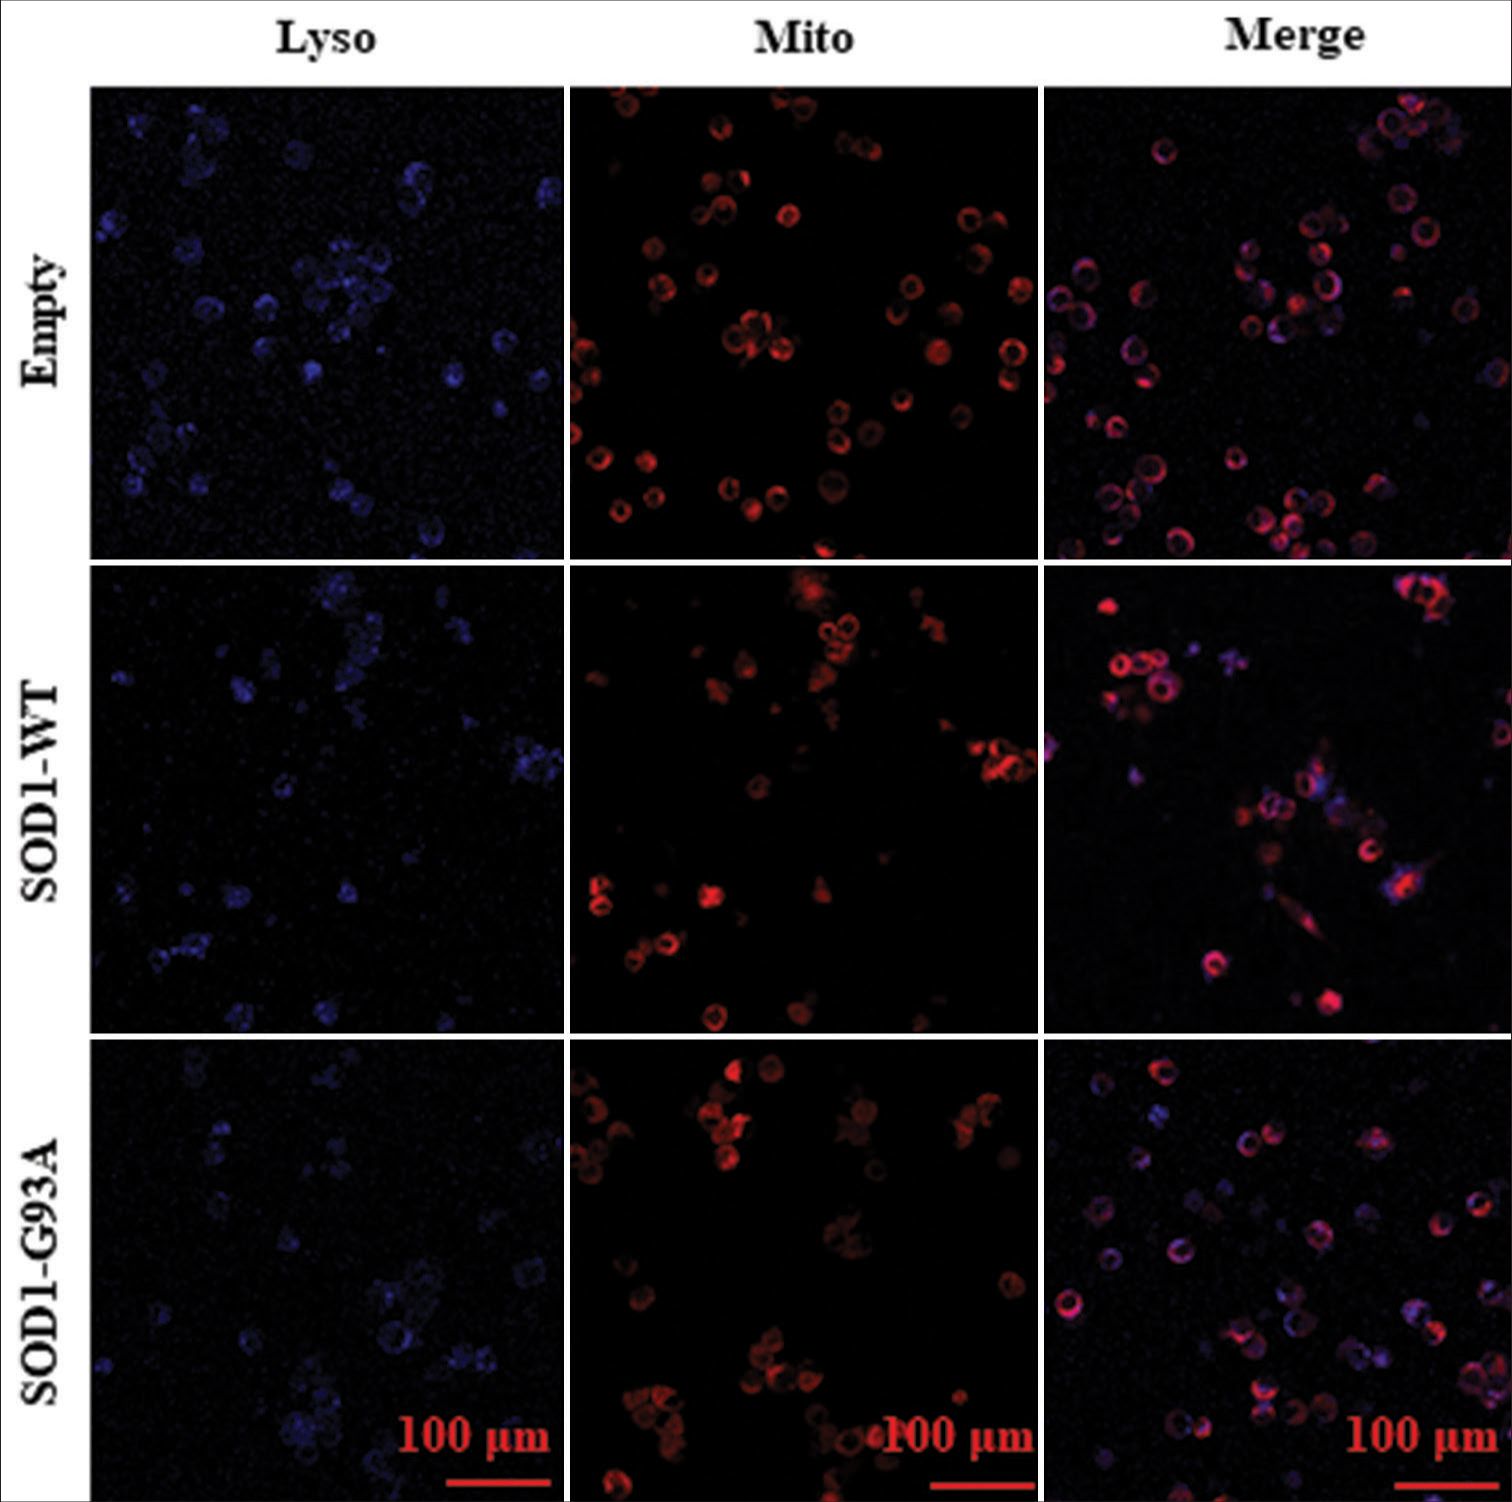
- Mito- and Lyso-tracer probes were used in immunofluorescence staining to observe the morphology and size of mitochondria and the number of lysosomes in various cell models and analyze their colocalization. Each row in Figure 6 represents various cell types: empty control group (Empty), WT SOD1 (SOD1 WT), and mutant SOD1 (SOD1-G93A). Lyso probe stained lysosomes are shown in blue and Mito probe-stained mitochondria in red. Colocalization can be observed in the merged images.
DISCUSSION
This study involved the thorough assessment of m6A hypermethylation in the spinal cords of SOD1-G93A mice and cell models. We analyzed key regulators of m6A modification at the mRNA and protein levels using ALS models. Our findings reveal the aberrant expressions of several m6A modification enzymes in the spinal cord tissues of the SOD1-G93A mouse model and ALS cell models. These results suggest that disruptions in m6A signaling could play a role in the development of ALS.
Mitochondrial dysfunction has been confirmed in ALS.[37,38] m6A is a reversible RNA modification. This modification occurs through methylation by methylases (writers) and can be reversed through demethylation by demethylases (erasers).[39] Methyltransferases and demethylases possibly increased simultaneously in the model group for a certain reason. One possible explanation is the dynamic regulation of m6A RNA methylation.[39] In response to cellular stress or disease conditions, such as ALS, cells may upregulate both types of enzymes to rapidly adjust m6A levels. This simultaneous increase could reflect a compensatory mechanism aimed at maintaining m6A homeostasis despite the pathological conditions.[39] Specialized enzymes (readers) recognize the RNA base site where m6A modification occurs, which regulates downstream RNA translation, decay, and stability.[40,41] With the further comprehension of this modification and technological capabilities, the functional investigation of m6A in gene regulation has garnered considerable attention and thus requires further exploration.[42,43] Autophagy, a fundamental cellular process in eukaryotic cells, involves the sequestration of cytoplasmic material within double-membraned autophagosomes; such condition ultimately leads to the degradation and recycling of engulfed substrates.[44,45] To investigate the role of m6A RNA modification in autophagy, we determined the overall level of m6A RNA modification in animal and cellular models of ALS. In the animal model and at the cellular level, SOD1-G93A experimental group showed higher overall m6A methylation levels of RNA compared with the control group.
To further confirm the role of m6A modification in autophagy, we investigated the expression levels of m6A-related regulatory molecules in the animal and cellular models of ALS. Our findings, which indicate variations in the gene expression levels of m6A-associated regulatory molecules, suggest that m6A modification can influence autophagy by targeting various autophagic genes. This study unveiled a potential interaction between mRNA m6A modification and autophagy, and this finding highlights a complex crosstalk that can substantially affect our comprehension of autophagic regulation.
Autophagy represents a fundamental cellular degradation pathway facilitated by lysosomal mechanisms, which are notably characterized by the formation of autophagosomes.[46] Key regulators of autophagy include autophagy-related genes, Unc-51 Like Autophagy Activating Kinase 1, and the transcription factor EB, which play critical roles in autophagy regulation.[47] m6A modification exerts its influence by finely regulating these autophagic regulators across various disease contexts. These effects encompass direct inhibition, facilitation of autophagosome formation, initiation of autophagy, and enhancement of autophagic processes, which underscore the multifaceted involvement of m6A modification in autophagy modulation.[24,48,49]
In ALS models, alterations in m6A methylation levels may lead to autophagy impairment through the regulation of the expressions of genes related to autophagy. Such conditions exacerbate ALS pathology. The formation and degradation of autophagosomes are key steps in the autophagy process.[50] m6A modification can influence the expression and function of proteins involved in autophagosome formation and degradation.[51] In ALS models, abnormalities in m6A methylation levels possibly disrupt autophagosome formation and degradation, which impair the autophagy process. m6A methylation influences the autophagy process through multiple molecular pathways, including the regulation of autophagy-related gene expression, the influence on miRNA function, autophagy regulation, and the effect on autophagosome formation and degradation. In ALS models, modifications in m6A methylation levels may disrupt the autophagy process through these pathways and thereby exacerbate ALS pathology. Future studies should further explore the specific mechanisms underlying these pathways to provide new insights into the development of ALS treatment strategies that target m6A methylation and autophagy.
Autophagy performs diverse functions in various tissues or cells; thus, variations in autophagic activity in studies can be attributed to specific cell types or their physiological states.[17,52,53] m6A methylome analyses of various cell types in ALS cellular models can provide insights into these variations. The level of LC3-II or LC3-II/LC3-I ratio is indicative of autophagosome count.[13] The conversion of unconjugated LC3-I to LC3-II serves as a valuable indicator of autophagy, and it allows for autophagy monitoring through changes in subcellular distribution (from diffused to punctate appearance in autophagic vesicles) and the detection of a shift in molecular weight in Western blot analysis.[54] P62/SQSTM1 (sequestosome1) serves as a selective autophagy receptor and facilitates the interaction with LC3 to improve the degradation of ubiquitinated proteins through the autophagy pathway.[55] Together with optic atrophy 1 (OPTN), P62 functions as a shuttle protein and links ubiquitinated proteins to the autophagosome membrane through the LC3–interaction region. This process culminates in the fusion of autophagosomes with lysosomes, which leads to lysosomal degradation of the contents. Such mechanisms underscore the pivotal roles of P62 and OPTN in facilitating the selective autophagy of ubiquitinated proteins, which is integral to maintaining cellular homeostasis.[56]
We assessed the protein levels of LC3-II and p62 in the mitochondria and cytoplasm of various cell types in ALS cellular models through Western blot analysis. Compared with the WT and empty plasmid cell models, the levels of LC3-II and p62 showed significant alterations in in the mitochondria and cytoplasm. The SOD1 protein undergoes degradation through the autophagy and ubiquitin– proteasome pathways.[57,58] Autophagy is crucial for preserving cellular homeostasis and ensuring a balanced intracellular metabolism, which highlight its importance in the cellular degradation process.[59] Autophagy flux is monitored by protein level of p62, which is associated with mature AVs and is degraded within autolysosomes. Therefore, its level can be used as a surrogate measurement of autophagic vesicle lysosome fusion, or autophagic flux. The decreased level of LC3-II in the cells suggests that with the development of ALS, the distribution of autophagy flow is abnormal. Our findings shows that a decreased levels of LC3-Il protein in the SODl-G93A cell model, wchich might be associated with autophagy dysfunction. This disruption has been linked to various pathological changes. To investigate the integration of mitochondria and lysosomes, we performed laser confocal microscopy to detect their colocalization and used specific markers for each organelle. Observation through inverted confocal microscopy revealed the significant decrease in the density of lysosomes, which were identifiable by their electron-dense content, in SOD1-G93A cells compared with WT and empty plasmid cells. These microscopic analyses consistently point toward lysosomal deficiencies in SOD1-G93A cells, which underscore the effect of impaired autophagy on cellular pathology.
Remarkably, SOD1-G93A cells demonstrated a significantly reduced intensity of autophagy. The findings of quantitative analyses indicate a lower mean intensity of autophagy in the SOD1-G93A cell model compared with that in cells harboring an empty plasmid and WT counterparts.
Numerous factors influence the regulation of m6A modification.[54,60] METTL3 facilitates m6A installation, whereas ALKBH5 inhibits this process. m6A methylation modification plays a potential role in facilitating ALS progression, primarily through autophagy regulation. Given its importance in mRNA metabolism across various stages, the complex interplay surrounding m6A warrants in-depth exploration. Broadly, unraveling the relationship between m6A modification and autophagy not only advances our comprehension of the molecular underpinnings of certain diseases but also holds the potential to unlock novel therapeutic avenues.
The NSC-34 cell model provides a controlled environment that may fail to fully capture the complexity of ALS pathology; it involves interactions between motor neurons and other cell types, such as glial cells. NSC-34 cells, which are derived from neuroblastoma and embryonic spinal cord cells, may not fully replicate the mature motor neurons affected in ALS patients. The study primarily focused on end-stage ALS models, which limits the understanding of early and mid-stages of the disease. Findings based on animal and cell models may present inherent potential confounding factors and require validation using various ALS models or clinical settings to increase the generalizability. The study excluded preliminary human data, which are essential for translating findings to human relevance. Systematic investigation of early and mid-stages of ALS is important in gaining insights into the dynamic changes in m6A methylation throughout the disease course. Conduct longitudinal studies to monitor changes in m6A methylation in the same batch of ALS models from early to end stages. Future studies should include preliminary human data to enhance the relevance and applicability of findings to human ALS pathology. More comprehensive models that consider interactions between motor neurons and other cell types, such as glial cells, must be used to better replicate the complexity of ALS pathology. Findings of various ALS models and clinical settings must be validated to ensure broader applicability and reliability of the results.
SUMMARY
This study revealed that increased m6A modification and altered autophagy considerably contribute to ALS pathology, with elevated levels of related molecules and proteins in ALS models, which suggest potential therapeutic targets.
AVAILABILITY OF DATA AND MATERIALS
The data that support the findings of this study are available from the corresponding author on reasonable request.
ABBREVIATIONS
qRT-PCR: Quantitative real-time polymerase chain reaction; METTL14: methyltransferase-like 14; FTO: Fat mass and obesity-associated protein; METTL3: Methyltransferase-like 3, WTAP: Wilms’ tumor 1-associating protein, HNRNPD: Heterogeneous nuclear ribonucleoprotein D, YTHDF1: YTH N6-methyladenosine RNA binding protein 1, YTHDF2: YTH N6-methyladenosine RNA binding protein 2, YTHDF3: YTH N6-methyladenosine RNA binding protein 3, ALKBH5: AlkB homolog 5, RNA demethylase, GAPDH: Glyceraldehyde-3-phosphate dehydrogenase; TUNEL: Terminal deoxynucleotidyl transferase dUTP nick end labeling; DAPI: 4',6-diamidino-2-phenylindole; P62: Sequestosome 1, LC3: Microtubule-associated protein 1 light chain 3, LC3-I: The cytosolic form of LC3, LC3-II: The membrane-bound form that is associated with autophagosomes, GAPDH: Glyceraldehyde-3-phosphate dehydrogenase.
AUTHOR CONTRIBUTIONS
AD and SXQ: Conceived and designed the study; AD, BY, and JG: Were responsible for data acquisition; AD and FPP: Analyzed and interpreted the data; AD and LMJ were responsible for animal experiments. AD and DJL were responsible for cell experiment; AD and HJZ: Drafted the first version of the manuscript; AD, SXQ, and HJZ: Critically revised the manuscript. All authors have read and approved the final version of the manuscript. All authors have contributed significantly to the work and has agreed to be responsible for every aspect of it.
ETHICS APPROVAL AND CONSENT TO PARTICIPATE
The care of the animals and the experimental protocols were authorized by the Research Ethics Committee of the Second Hospital of Hebei Medical University, ensuring compliance with ethical standards for animal research (Approval Letter NO.:2023-AE328). No patient involvement, informed consent not required.
CONFLICT OF INTEREST
The authors declare no conflict of interest.
EDITORIAL/PEER REVIEW
To ensure the integrity and highest quality of CytoJournal publications, the review process of this manuscript was conducted under a double-blind model (authors are blinded for reviewers and vice versa) through an automatic online system.
FUNDING
This study was supported by Hebei Natural Science Foundation (H2021206223).
References
- State of play in amyotrophic lateral sclerosis genetics. Nat Neurosci. 2014;17:17-23.
- [CrossRef] [Google Scholar]
- Current pathways for epidemiological research in amyotrophic lateral sclerosis. Amyotroph Lateral Scler Frontotemporal Degener. 2013;14(Suppl 1):33-43.
- [CrossRef] [Google Scholar]
- Epidemiology of amyotrophic lateral sclerosis: An update of recent literature. Curr Opin Neurol. 2019;32:771-6.
- [CrossRef] [Google Scholar]
- Fasciculation in amyotrophic lateral sclerosis: Origin and pathophysiological relevance. J Neurol Neurosurg Psychiatry. 2017;88:773-9.
- [CrossRef] [Google Scholar]
- Genetics of sporadic ALS. Amyotroph Lateral Scler Other Motor Neuron Disord. 2001;2(Suppl 1):S37-41.
- [CrossRef] [Google Scholar]
- The chemokine MCP-1 and the dendritic and myeloid cells it attracts are increased in the mSOD1 mouse model of ALS. Mol Cell Neurosci. 2006;31:427-37.
- [CrossRef] [Google Scholar]
- Presence of dendritic cells, MCP-1, and activated microglia/macrophages in amyotrophic lateral sclerosis spinal cord tissue. Ann Neurol. 2004;55:221-35.
- [CrossRef] [Google Scholar]
- Autophagy fights disease through cellular self-digestion. Nature. 2008;451:1069-75.
- [CrossRef] [Google Scholar]
- Optineurin is an autophagy receptor for damaged mitochondria in parkin-mediated mitophagy that is disrupted by an ALS-linked mutation. Proc Natl Acad Sci U S A. 2014;111:E4439-48.
- [CrossRef] [Google Scholar]
- Dynamic recruitment and activation of ALS-associated TBK1 with its target optineurin are required for efficient mitophagy. Proc Natl Acad Sci U S A. 2016;113:E3349-58.
- [CrossRef] [Google Scholar]
- Parkin is a disease modifier in the mutant SOD1 mouse model of ALS. EMBO Mol Med. 2018;10:e8888.
- [CrossRef] [Google Scholar]
- m(6)A RNA modification controls autophagy through upregulating ULK1 protein abundance. Cell Res. 2018;28:955-7.
- [CrossRef] [Google Scholar]
- m(6)A mRNA methylation controls autophagy and adipogenesis by targeting Atg5 and Atg7. Autophagy. 2020;16:1221-35.
- [CrossRef] [Google Scholar]
- Emerging roles of RNA modification: m(6)A and U-tail. Cell. 2014;158:980-7.
- [CrossRef] [Google Scholar]
- N6-methyladenosine modification in mRNA: Machinery, function and implications for health and diseases. FEBS J. 2016;283:1607-30.
- [CrossRef] [Google Scholar]
- Gene expression regulation mediated through reversible m6A RNA methylation. Nat Rev Genet. 2014;15:293-306.
- [CrossRef] [Google Scholar]
- Temporal control of mammalian cortical neurogenesis by m(6)A methylation. Cell. 2017;171:877-89.e17.
- [CrossRef] [Google Scholar]
- Dynamic m6A modification regulates local translation of mRNA in axons. Nucleic Acids Res. 2018;46:1412-23.
- [CrossRef] [Google Scholar]
- Down-regulation of m6A mRNA methylation is involved in dopaminergic neuronal death. ACS Chem Neurosci. 2019;10:2355-63.
- [CrossRef] [Google Scholar]
- m(6)A facilitates hippocampus-dependent learning and memory through YTHDF1. Nature. 2018;563:249-53.
- [CrossRef] [Google Scholar]
- Mitochondrial dysfunction and amyotrophic lateral sclerosis. Muscle Nerve. 2006;33:598-608.
- [CrossRef] [Google Scholar]
- Mitochondrial function, morphology, and axonal transport in amyotrophic lateral sclerosis. Antioxid Redox Signal. 2009;11:1615-26.
- [CrossRef] [Google Scholar]
- N6-methyladenosine in nuclear RNA is a major substrate of the obesity-associated FTO. Nat Chem Biol. 2011;7:885-7.
- [CrossRef] [Google Scholar]
- Dynamic RNA modifications in gene expression regulation. Cell. 2017;169:1187-200.
- [CrossRef] [Google Scholar]
- Deregulation of N6-methyladenosine RNA modification and its erasers FTO/ ALKBH5 among the main renal cell tumor subtypes. J Pers Med. 2021;11:996.
- [CrossRef] [Google Scholar]
- m6A Modification and implications for microRNAs. Microrna. 2017;6:97-101.
- [CrossRef] [Google Scholar]
- Emerging relationship between RNA helicases and autophagy. J Zhejiang Univ Sci B. 2020;21:767-78.
- [CrossRef] [Google Scholar]
- Anticancer activity of diosgenin and its semi-synthetic derivatives: Role in autophagy mediated cell death and induction of apoptosis. Mini Rev Med Chem. 2021;21:1646-65.
- [CrossRef] [Google Scholar]
- METTL3 and ALKBH5 oppositely regulate m(6)A modification of TFEB mRNA, which dictates the fate of hypoxia/reoxygenation-treated cardiomyocytes. Autophagy. 2019;15:1419-37.
- [CrossRef] [Google Scholar]
- The mechanism of m(6)A methyltransferase METTL3-mediated autophagy in reversing gefitinib resistance in NSCLC cells by β-elemene. Cell Death Dis. 2020;11:969.
- [CrossRef] [Google Scholar]
- LC3, a mammalian homologue of yeast Apg8p, is localized in autophagosome membranes after processing. EMBO J. 2000;19:5720-8.
- [CrossRef] [Google Scholar]
- IgG reactivity in the spinal cord and motor cortex in amyotrophic lateral sclerosis. Arch Neurol. 1990;47:1210-6.
- [CrossRef] [Google Scholar]
- Autophagy and neurode-generation: When the cleaning crew goes on strike. Lancet Neurol. 2007;6:352-61.
- [CrossRef] [Google Scholar]
- The stress rheostat: An interplay between the unfolded protein response (UPR) and autophagy in neurodegeneration. Curr Mol Med. 2008;8:157-72.
- [CrossRef] [Google Scholar]
- TFEB signalling-related MicroRNAs and autophagy. Biomolecules. 2021;11:985.
- [CrossRef] [Google Scholar]
- m(6)A in mRNA: An ancient mechanism for fine-tuning gene expression. Trends Genet. 2017;33:380-90.
- [CrossRef] [Google Scholar]
- RNA m6A modification, signals for degradation or stabilisation? Biochem Soc Trans. 2024;52:707-17.
- [CrossRef] [Google Scholar]
- N6-methyladenosine links RNA metabolism to cancer progression. Cell Death Dis. 2018;9:124.
- [CrossRef] [Google Scholar]
- The functions of N6-methyladenosine modification in lncRNAs. Genes Dis. 2020;7:598-605.
- [CrossRef] [Google Scholar]
- The role of N6-methyladenosine (m6A) modification in the regulation of circRNAs. Mol Cancer. 2020;19:105.
- [CrossRef] [Google Scholar]
- Interactions between m6A modification and miRNAs in malignant tumors. Cell Death Dis. 2021;12:598.
- [CrossRef] [Google Scholar]
- m6A RNA Methylation: Ramifications for gene expression and human health. Mol Biotechnol. 2020;62:467-84.
- [CrossRef] [Google Scholar]
- Structural basis for cooperative function of Mettl3 and Mettl14 methyltransferases. Mol Cell. 2016;63:306-17.
- [CrossRef] [Google Scholar]
- m(6)A RNA methylation promotes XIST-mediated transcriptional repression. Nature. 2016;537:369-73.
- [CrossRef] [Google Scholar]
- Interactions, localization, and phosphorylation of the m(6)A generating METTL3-METTL14-WTAP complex. RNA. 2018;24:499-512.
- [CrossRef] [Google Scholar]
- Structure of human RNA N6-methyladenine demethylase ALKBH5 provides insights into its mechanisms of nucleic acid recognition and demethylation. Nucleic Acids Res. 2014;42:4741-54.
- [CrossRef] [Google Scholar]
- N(6)-methyladenosine modulates messenger RNA translation efficiency. Cell. 2015;161:1388-99.
- [CrossRef] [Google Scholar]
- METTL14-m6A-FOXO3a axis regulates autophagy and inflammation in ankylosing spondylitis. Clin Immunol. 2023;257:109838.
- [CrossRef] [Google Scholar]
- M6A methylation-regulated autophagy may be a new therapeutic target for intervertebral disc degeneration. Cell Biol Int. 2024;48:389-403.
- [CrossRef] [Google Scholar]
- Autophagy: A druggable process. Annu Rev Pharmacol Toxicol. 2017;57:375-98.
- [CrossRef] [Google Scholar]
- USP19 modulates autophagy and antiviral immune responses by deubiquitinating Beclin-1. EMBO J. 2016;35:866-80.
- [CrossRef] [Google Scholar]
- A comprehensive review of m6A/m6Am RNA methyltransferase structures. Nucleic Acids Res. 2021;49:7239-55.
- [CrossRef] [Google Scholar]
- m(6)A: An emerging role in programmed cell death. Front Cell Dev Biol. 2022;10:817112.
- [CrossRef] [Google Scholar]
- C9orf72 Proteins regulate autophagy and undergo autophagosomal or proteasomal degradation in a cell type-dependent manner. Cells. 2019;8:1233.
- [CrossRef] [Google Scholar]
- The protective effects of rapamycin on cell autophagy in the renal tissues of rats with diabetic nephropathy via mTOR-S6K1-LC3II signaling pathway. Ren Fail. 2018;40:492-7.
- [CrossRef] [Google Scholar]
- Reshaping the role of m6A modification in cancer transcriptome: A review. Cancer Cell Int. 2020;20:353.
- [CrossRef] [Google Scholar]