


Translate this page into:
Effect of 5-Aza-2’-deoxycytidine on T-cell acute lymphoblastic leukemia cell biological behaviors and PTEN expression

*Corresponding author: Yan Li, Department of Hematology, Handan First Hospital, Handan, Hebei, China. hdsycongtai@163.com
-
Received: ,
Accepted: ,
How to cite this article: Li Y, Jia Z, Kong X, Zhao H, Liu X, Cui G, et al. Effect of 5-Aza-2’-deoxycytidine on T-cell acute lymphoblastic leukemia cell biological behaviors and PTEN expression. CytoJournal. 2024;21:36. doi: 10.25259/Cytojournal_31_2024
Abstract
Objective:
We currently face a sharp increase of T-cell acute lymphoblastic leukemia (T-ALL) incidence and a challenge of unmasking its complex etiology. The deoxycytidine analog 5-Aza-2’-deoxycytidine (5-Aza-dC) is currently the most common nucleoside methyltransferase inhibitor. The objective of this study was to clarify the role of 5-Aza-dC in T-ALL cell biological behaviors and phosphatase and tensin homolog deleted on chromosome ten (PTEN) expression.
Material and Methods:
T-ALL cell lines were divided into the experimental group with 5-Aza-dC solution treatment, and the control group without treatment. PTEN methylation was detected using methylation-specific polymerase chain reaction (MS-PCR). Following the measurement of cell proliferation, viability, apoptosis, invasion, migration, etc., quantitative reverse transcription-polymerase chain reaction (PCR) was conducted to detect PTEN, DNA methyl-transferases (DNMT1), DNMT3a, MBD2, and MeCP2 expressions; Western blot to detect PTEN, PI3K, AKT, and mTOR protein expressions. In addition, rescue experiments to inhibit and restore the expression of PTEN in different groups were performed for further identification of the results in the former parts.
Results:
MS-PCR results showed that in Jurkat cells, the target band was amplified using methylated primers for the PTEN gene promoter region; moreover, at 10 μmol/L of 5-Aza-dC for 24 h, PTEN methylation was completely removed without any un-methylated band observed. The experimental group had significantly lower cell proliferation and viability rates, higher apoptosis rates, decreased cell proportion in S phase, reduced invasion and migration; increased PTEN expression, decreased DNMT1, DNMT3a, MBD2, and MeCP2 mRNA expressions; and decreased PI3K, AKT, and mTOR protein expressions than those in the control group (all P < 0.05). Furthermore, according to the rescue experiment, silenced PTEN expression weakened the beneficial roles of 5-Aza-dC treatment, and resulted in significantly higher cell proliferation and viability rates, lower apoptosis rates, increased cell proportion in S phase, increased cell invasion and migration; decreased PTEN expression, elevated DNMT1, DNMT3a, MBD2, and MeCP2 mRNA expressions, and higher PI3K, AKT, and mTOR protein expressions (all P < 0.05). While restored PTEN expression enhanced functions of 5-Aza-dC treatment, leading to obviously lower cell proliferation and viability rates, higher apoptosis rates, increased cell proportion in G1 phase, and reduced cell invasion and migration; as well as increased PTEN expression, decreased DNMT1, DNMT3a, MBD2, and MeCP2 mRNA expressions, and lower PI3K, AKT, and mTOR protein expressions (all P < 0.05).
Conclusion:
Demethylation treatment with 5-Aza-dC can inhibit T-ALL cell malignant biological behaviors and enhance the sensitivity to chemotherapy agents possibly, which may be related to the inhibited expressions of DNMT1, DNMT3a, MBD2, and MeCP2, and restored expression activity of PTEN to negatively regulate the PI3K/AKT signal transduction. Our silencing and restoration of PTEN expressions further support our findings, highlighting that demethylation with 5-Aza-dC to restore the anti-tumor activity of the tumor suppressor gene PTEN may be a promising therapeutic option for treating T-ALL.
Keywords
5-Aza-2’-deoxycytidine
T-cell acute lymphoblastic leukemia
PTEN
Tumor cell biological behaviors
Demethylation

INTRODUCTION
Acute leukemia is a group of hematopoietic stem/progenitor cell diseases in which the genome undergoes dynamic changes.[1,2] T-cell acute lymphoblastic leukemia (T-ALL) has strong heterogeneity and is characterized by proliferation of massive immature lymphocytes.[3,4] With a gradual increase in incidence, it has become one of the major diseases threatening human health.[5] Accumulated data confirm that age, pre-treatment high white blood cell count in peripheral blood, T-cell/Ph-positive subtypes, sensitivity and tolerance to chemotherapy, and incomplete response to initial induction are all risk factors affecting this type of malignant tumor.[6,7] However, its clinical features still cannot explain the reasons for its insensitivity to chemotherapy, short-term recurrence, and poor overall prognosis. Simultaneously, with the active development and use of new targeted drugs,[8] as well as the progress of hematopoietic stem cell transplantation,[9] there is an improvement in illness remission and maintenance time of the affected patients, with decreased recurrence rate as well, while more effective diagnostic and therapeutic approaches are still required considering the unsatisfactory survival outcome of this malignancy.
Canceration is a multi-gene and multi-step process.[10] With the development of epigenetics, there is an improvement in public awareness that changes in epigenetics,[11] similar to those in genetics, are involved in inducing abnormal pathological processes. Tumors are not only genetic diseases but also epigenetic diseases.[12] Epigenetic modifications, such as DNA methylation, RNA-related silencing, and histone post-translational modifications, may be associated with initiating and maintaining epigenetic silencing in an interactive manner.[13] DNA methylation,[14] an extensively studied biological process, refers to a chemical modification process where DNA methyl-transferases (DNMTs) are catalyzed by selective addition of methyl groups to generate 5-methylcytosin. Abnormal DNA methylation is an early and frequent event in tumors.[15-17] High methylation of the candidate gene promoter region is an important mechanism for tumor suppressor gene inactivation.[18] DNA methylation in epigenetics, in the opinion of previous researches[15-18] and in our hypothesis, may be crucial for the occurrence and development of leukemia.
Phosphatase and tensin homolog deleted on chromosome ten (PTEN) is the first tumor suppressor gene discovered with phosphotyrosine protein phosphatase and dual-specific phosphatase activities, as well as the only one with lipid phosphatase activity.[19] It participates in cell cycle regulation, inhibiting angiogenesis, cell adhesion, and metastasis.[20,21] PTEN can significantly inhibit tumor and regulate cellular signaling pathways. Specifically, it can negatively regulate PI3K/Akt signaling, mediate G1-phase arrest and apoptosis of cells;[22] and as a protein phospholipase, it can inhibit MAPK signaling pathway that is involved in mediating tumor cell activities.[23] At present, the methylation of PTEN gene is reported to be abnormal in many malignant tumors, such as tumors involving the breast,[24] prostate,[25] lung,[26] and stomach.[27] However, the relationship between PTEN methylation and the occurrence of T-ALL remains to be further explored extensively.
DNA methylation is reversible, and methyltransferase inhibitors can reverse the high methylation state of tumor suppressor genes to recover their expressions, thereby achieving tumor growth suppression.[28,29] The deoxycytidine analog 5-Aza-2’-deoxycytidine (5-Aza-dC) is currently the most common nucleoside methyltransferase inhibitor, which was approved for clinical treatment of myelodysplastic syndrome and acute myeloid leukemia.[30] At present, the impact of demethylation intervention through 5-Aza-dC on tumors has been reported widely, such as in cervical cancer,[31] colon cancer,[32] and breast cancer.[33] We currently face a sharp increase of T-ALL incidence and a challenge of unmasking its complex etiology. More comprehensive basic research is hence urgently required for uncovering its development and exploring suitable therapeutic tools. This study aims to investigate its effects on the biological behaviors of T-ALL cells and on PTEN expression.
MATERIAL AND METHODS
Cell culture and grouping
T-ALL cell lines CCRF-CEM (Code: CCL-119), Molt-4 (CRL-1582), SUP-B15 (CRL-1552), and Jurkat (TIB-152) were provided by ATCC cell bank (Shanghai, China) and had been subjected to tests for mycoplasmal contamination and Short Tandem Repeat of cultured cells as applied at the ATCC. These cell lines were cultured in Dulbecco’s Modified Eagle Medium (DMEM; PM150210P, Pricella, Wuhan, China) within an incubator containing 5% CO2 at 37°C, with the culture medium changed every 2-3d. As for drug treatment and construction of cell model, 5-Aza-dC powder (HM10241, HuicH, Shanghai, China) was dissolved to prepare a solution at concentration of 200 μmol/L, which was then stored in a dark place at −20°C. Cell suspension at approximately 10 × 106/mL was taken and place in a 96-well culture plate, with 100 μL inoculated per well. Cells were divided into the experimental group cultured with 5-AzadC solution drop-wise, and the control group with 5-AzadC-free culture medium. An amount of 200 μL 5-Aza-dC solution was sequentially added in the experimental group.
Meanwhile, this study also performed rescue experiments to inhibit and restore the expression of PTEN for further identification of the results in the former part. For gene silencing, we established control (5-Aza-dC) + sh-negative control (NC) group, 5-Aza-dC + sh-NC group, control (5-Aza-dC) + sh-PTEN group, and 5-Aza-dC + sh-PTEN group. Simultaneously, to enhance our speculation more comprehensively, further experiments concerning PTEN restoration were also continued based on groups of control (5-Aza-dC) + oe-NC group, 5-Aza-dC + oe-NC group, control (5-Aza-dC) + oe-PTEN group, and 5-Aza-dC + oePTEN group. The transfection sequences and plasmids[34] were constructed by Shanghai Sagon. As for the cell transfection protocol, briefly, cells were inoculated onto 6-well plates (density of 1 × 10⁵ cells/well) and cultured in an incubator for 24 h. When the cell fusion reached 70–80%, cell transfection was carried out following the instructions of lipofectamine 2000 (L3000-015, Invitrogen, Thermo Fisher Scientific Inc., Shanghai, China). After completing the transfection procedure according to different grouping protocols, cells were transferred on DMEM medium for further culture to be prepared for subsequent experiments.
Cell proliferation by Cell Counting Kit-8 (CCK-8) assay
After cell counting, cells were inoculated into a 96-well plate, with 100 μL culture medium added in the control group. After cell adhesion and growth, another 96-well plate was taken and added with 10 μL/well CCK-8 (GM-040101, Genomeditech, Shanghai, China) in dark, with bubbles avoided and mixture mixed gently. Its absorbance (optical density [OD]) was obtained over 72 h through calculation at a wavelength of 450 nm.
Drug resistance by methyl-thiazole-tetrazolium (MTT) assay
According to the above experiment, cells at logarithmic growth phase were taken and inoculated into a sterile 96-well plate after digestion at an adjusted concentration of 200 μL/well. According to different experimental designs, the control and the experimental groups were added with control medium and drug-treated culture medium [DDP: Cisplatin (CAS.15663-27-1, Jinan Renyuan Chemical Co., Ltd., Jinan, China); at different concentrations of 0, 5, 10, 20, 30, and 40 μmol/L]. After that, 20 μL of 5 mg/mL MTT solution (PB180519, Pricella, Wuhan, China) was added to each well followed by the addition of 150 μL dimethyl sulfoxide (DMSO; CAS.67-68-5, Tesco Chemical, Wuhan, China). The OD values of each well at a wavelength of 490 nm were measured 48 h (over two consecutive days) later and the average value of each group was taken for the measurement of cell viability rate according to the formula of cell viability rate (%) = (OD [drug]-OD [control]/OD [DMSO]-OD [control])×100%.
Quantitative reverse transcription polymerase chain reaction (PCR)
Cell RNA was extracted using TRIZOL (15596018CN, Thermo Fisher Scientific Inc., Shanghai, China) to measure RNA concentration. mRNA reverse transcription reaction was strictly implemented according to the instructions. First, the extracted template RNA was thawed at low temperature; Primer Mix, RT Buffer, 5 × gDNA Eraser and DEPC Nuclease-Free Water were thawed at 20 ± 5°C, and immediately placed on ice after completion. All solutions were oscillated and mixed evenly before use, while the remaining liquid on the tube wall was collected by transient centrifugation. Amplification was performed after mRNA reverse transcription reaction. The design of primers is shown in Table 1. A quantitative PCR reaction system (20 μL) was established for pre-denaturation, PCR reaction, melting, etc. Relative transcription levels of target gene mRNAs referred to the formula of 2-△△Ct.
| Genes | Primer sequences |
|---|---|
| PTEN | 5'-GGAAAGGGACGAACTGGTGTA-3' 5'-AACTTGTCTTCCCGTCGTGTG-3' |
| GAPDH | 5'-GCACCGTCAAGGCTGAGAAC-3' 5'-TGGTGAAGACGCCAGTGGA-3' |
| DNMT1 | 5'-GGAGGGCTACCTGGCTAA-3' 5'-CGGGCTTCACTTCTTGCT-3' |
| DNMT3a | 5'-TATTGATGAGCGCACAAGAGAGC-3' 5'-GGGTGTTCCAGGGTAACATTGAG-3' |
| MBD2 | 5'-AACCCTGCTGTTTGGCTTAAC-3' 5'-CGTACTTGCTGTACTCGCTCTTC-3' |
| MeCP2 | 5'-ACTCCCCAGAATACACCTTGCTT-3' 5'-TGAGGCCCTGGAGGTCCT-3' |
| β-actin | 5'-GAGCTACGAGCTGCCTGAC-3' 5'-GGTAGTTTCGTGGATGCCACAG-3' |
PCR: Polymerase chain reaction, GAPDH: Glyceraldehyde-3-phosphate dehydrogenase, DNMT: DNA methyl-transferases, PTEN: Phosphatase and tensin homolog deleted on chromosometen; MBD: Methyl-CpG binding domain protein 2. A: Adenosine, C: Cytosine, T: Thymine, G: Guanine
Western blot
To detect the protein expressions of PTEN, PI3K, AKT, and mTOR, total cell proteins were extracted using efficient radio immunoprecipitation assay lysis solution (R0010, Solarbio, Beijing, China) by following the instruction strictly. The next steps were gel preparation and filling (separation gel, concentration gel), sampling and electrophoresis, wet-transfer, blocking, incubation with rabbit monoclonal PTEN (ab267787, 1:1,000), rabbit monoclonal PI3K (ab302958, 1:1,000), rabbit polyclonal AKT (ab38449, 1:1,000) and rabbit monoclonal mTOR (ab134903, 1:10,000) antibodies, and secondary antibody (rabbit anti-mouse IgG antibody, ab6728, 1:2,000) binding. For enhanced chemiluminescence (ECL), the polyvinylidene difluoride membrane (CAS.24937-79-9, edwardbiology, Zhengzhou, Henan) was added into ECL luminescent solution for 1 min, and an integrated automatic gel imaging system (iBright™ CL1500, Thermo Fisher Scientific Inc., Shanghai, China) was adopted for exposure and photography. The standardized expressions of target proteins in each group were quantitatively analyzed using paired glyceraldehyde-3-phosphate dehydrogenase values for standardization[35]. All these antibodies used in this experiment were provided by Abcam (Cambridge, MA, USA). Quantitative analysis of grayscale values was realized using Image J software (National Institutes of Health, Maryland, USA).
Methylation-specific PCR (MS-PCR)
MS-PCR was conducted to detect PTEN methylation status. After cell DNA extraction, the concentration and purity of DNA were measured, and the product was stored in a −80℃ freezer. DNA samples were taken to perform bisulfite conversion of DNA. The eluted DNA was stored in a −20°C low-temperature incubator. PTEN gene methylated (M: upstream 5’-GTTTGGGGATTTTTTTTTCGC-3’; downstream 5’-AA CCCTTCCTACGCCGCG-3’) and un-methylated primers (U: upstream 5’-ATTAGTTTGGGGATTTTTTTTTTGT-3’; downstream 5’-CCCAACCCTTCCTACACCACA-3’) were synthesized based on relevant literature,[36] with corresponding products of 178 bp and 186 bp in size, respectively. After primer synthesis, centrifugation was performed in a 4°C centrifuge for 3 min, followed by the addition of the corresponding volume of RNase-free ddH2O, thoroughly mixing and placing at 37°C. The generated solution was stored in a −20°C low-temperature refrigerator at 100 μM. A quantitative MS-PCR system was prepared and placed in real-time quantitative PCR for reaction at 95°C for 15 min, followed by 94°C for 30 s, 50°C for 45 s, 72°C for 60 s, and the reaction lasted for 40 cycles. After amplification, a melting curve was added to determine the specificity of the primers. The primers were tested at 95°C for 15 s, 60°C for 45 s, and 95°C for 15 s. After that, the PCR products were collected and subjected to electrophoresis using the agarose gel at a voltage of 40-60V. After electrophoresis, the results were observed through gel imager. According to the reference, the DNA methylation level of PTEN was calculated based on the calculation of Δ Ct = Ct U-Ct M (U: un-methylated, M: methylated). The MS-PCR data were quantified with three replicates.
Cell apoptosis and cell cycle detected by flow cytometry
Cells were treated, digested and collected using 0.25% trypsin digestion within 2–5 min. After incubation into a 6-well plate for 24 h, serum-free culture medium was added for 24 h of synchronization. Then, 5-Aza-dC solution at 10 μmol/L was added for 24 h of reaction. Cells (1–5 × 10⁶) were centrifuged at 1,000 rpm for 10 min at 4°C, with the supernatant discarded. After the addition of 1 mL of cooled phosphate buffered saline (PBS; P1022, Solarbio, Beijing, China), cell suspension was collected for another centrifugation at 1,000 rpm for 5 min at 4°C. With repeated centrifugation and supernatant removal, 500 μL binding buffer (V13246, Thermo Fisher Scientific Inc., Shanghai, China) was added and Annexin V-fluorescein isothiocyanate (46424, Thermo Fisher Scientific Inc., Shanghai, China) and propidium iodide (PI; C0080, Solarbio, Beijing, China; 5 μL for each) was mixed. Flow cytometry was conducted after incubation at 20–25°C in dark for 10–15 min. Cell cycles were measured using PI staining. ACEA NovoCyte flow cytometer (NovoCyte, ACEA Biosciences, San Diego, California, USA) was used for analysis.
Cell invasion and migration detected by transwell assay
Matrigel (sca004, YUCHI Biology, Shanghai, China) was thawed overnight to become liquid in a low-temperature refrigerator. It was then diluted to a final concentration of 1 mg/mL on ice and added into each well to coat the upper surface of the Transwell chamber for incubation at 37°C for 60–120 min. After hydration of the basement membrane, cell suspension was prepared with cell density adjusted to 5 × 10⁵ cells/mL. Furthermore, 0.1% methyl violet (M696270, aladdin, Shanghai, China) was applied for 20 min of staining, followed by gentle rinse with PBS. Non-migrated cells in the chamber and on the Matrigel were removed with a wet cotton swab. Visual observation and photography were performed under the microscope (Olympus, Tokyo, Japan), with the number of cells penetrating the membrane recorded. Five fields of vision were randomly selected from each sample to take the average value for statistical analysis. Similarly, the cell migration ability was measured using a Transwell chamber without Matrigel.
Statistical analysis
This study adopted the Statistical Package for the Social Sciences 21.0 (IBM Corp, Armonk, NY, USA). for analysis and GraphPad Prism (version 8.0.2, GraphPad Software, San Diego, California, USA) for plotting. Measurement data were presented in mean ± standard deviation. Statistically significant difference was determined when P< 0.05 was detected after intra- and inter-group comparisons using non-paired t-test and one-way analysis of variance or Tukey’s post hoc test, respectively.
RESULTS
Methylation of PTEN in different T-ALL cells
In Figure 1a, in Jurkat cell lane, the target band was amplified using methylated primers for the PTEN gene promoter region, while un-methylated specific primers did not amplify the target band. The length of the amplified fragment of the methylated and un-methylated primers was about 178 bp and 186 bp, respectively. It indicated complete methylation of PTEN gene in Jurkat cells. While for other T-ALL cells, positive bands were amplified using both methylated and un-methylated primers, with both methylated products (M bands) and un-methylated products (U bands), indicating incomplete methylation of the PTEN gene. However, no methylated or un-methylated products (M/U bands) of PTEN were amplified in the control group (without DNA template). According to the experimental design, Jurkat cells with complete PTEN methylation were selected for subsequent experiments.
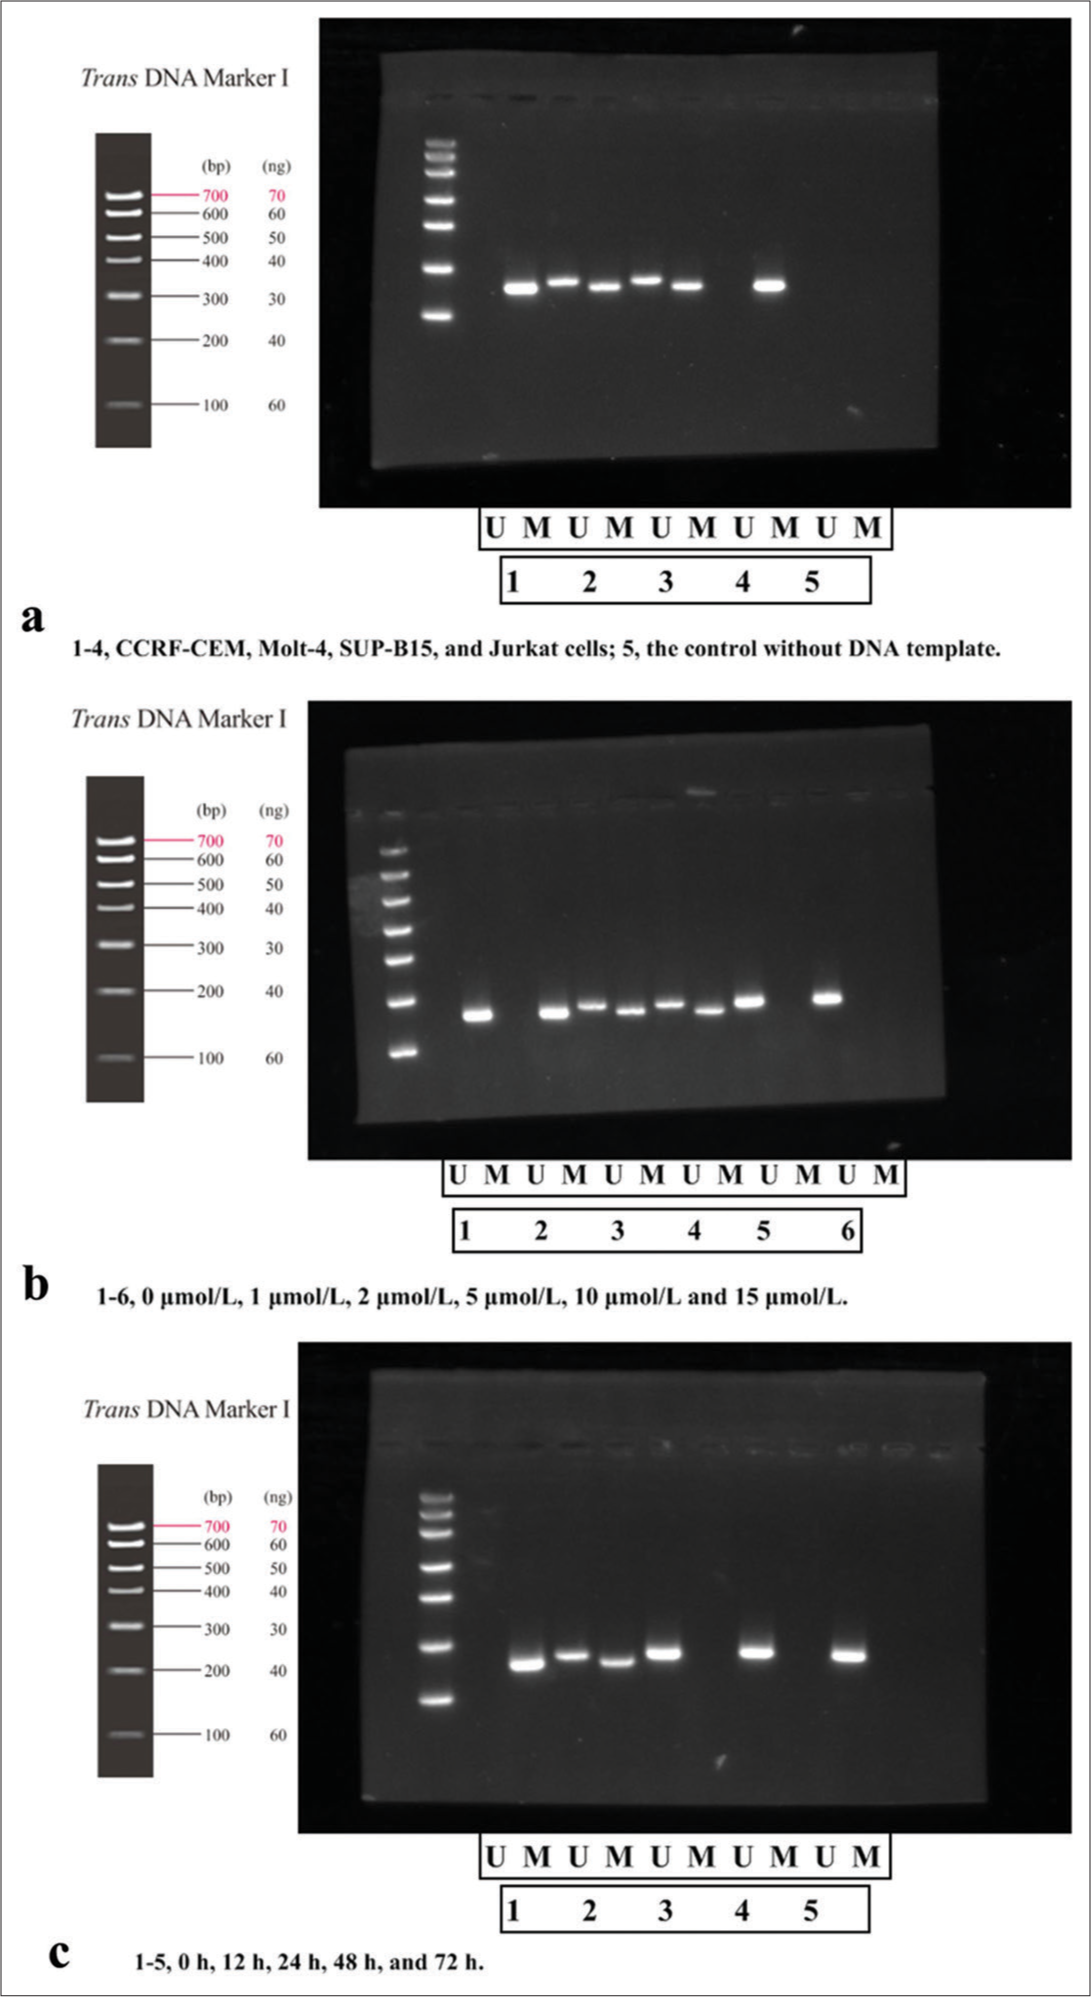
- Methylation-specific polymerase chain reaction detection of PTEN methylation in different cell lines. (a) Detection in different cell lines (1–4, CCRF-CEM, Molt-4, SUP-B15, and Jurkat cells; 5, the control without DNA template); (b) detection in Jurkat cells at different drug concentrations of 5-Aza-dC for 24 h (1–6, 0 μmol/L, 1 μmol/L, 2 μmol/L, 5 μmol/L, 10 μmol/L and 15 μmol/L); (c) detection in Jurkat cells treated by 10 μmol/L of 5-Aza-dC at different time points of 0 h, 12 h, 24 h, 48 h, and 72 h (1–5, 0 h, 12 h, 24 h, 48 h, and 72 h). (n = 3). (U: un-methylated, M: methylated. CCREF-CM, SUP-B15, Molt: Cell line naming codes for T-cell acute lymphoblastic leukemia. bp and ng: Electrophoretic fragment length and DNA load quantity, respectively, with their values presented in the figure along with corresponding units. PTEN: Phosphatase and tensin homolog deleted on chromosome ten; 5-Aza-dC: 5-Aza-2’-deoxycytidine).
Determination of the final drug concentration for complete removal of PTEN methylation in Jurkat cells
T-ALL cells were treated with 5-Aza-dC at 0, 1, 2, 5, 10, and 15 μmol/L, as shown in Figure 1b; moreover, Jurkat cells were also treated at the same concentration of 10 μmol/L at different times of 0, 12, 24, 48, and 72 h [Figure 1c]. The results of MS-PCR revealed that at 10 μmol/L and 24 h, PTEN methylation was completely removed with no un-methylated band observed, indicating complete methylation of PTEN gene by 5-Aza-dC. Therefore, 10 μmol/L was selected as the effective drug concentration for further research.
Effect of 5-Aza-dC demethylation on the biological behaviors of T-ALL cells
In Figure 2a, the cell proliferation rate of the experimental group was significantly lower than that in the control group at 24 h, 48 h, and 72 h (all P< 0.05). Meanwhile, in Figure 2b, the cell viability rate was decreased with the concentrations of DDP in the experimental group than that in the control group (all P< 0.05). In Figure 2c and d, compared with the control group, the apoptosis rate of cells significantly increased in the experimental group (P< 0.05). In Figure 2e and f cell proportion in S phase was significantly decreased, and increased in G1 phase in the experimental group than those in the control group (both P< 0.05), without difference in G2 phase (P> 0.05). In addition, Figure 2g-i indicated that counts of cells invading and migrating membrane were reduced in the experimental group than those in the control group (both P< 0.05).
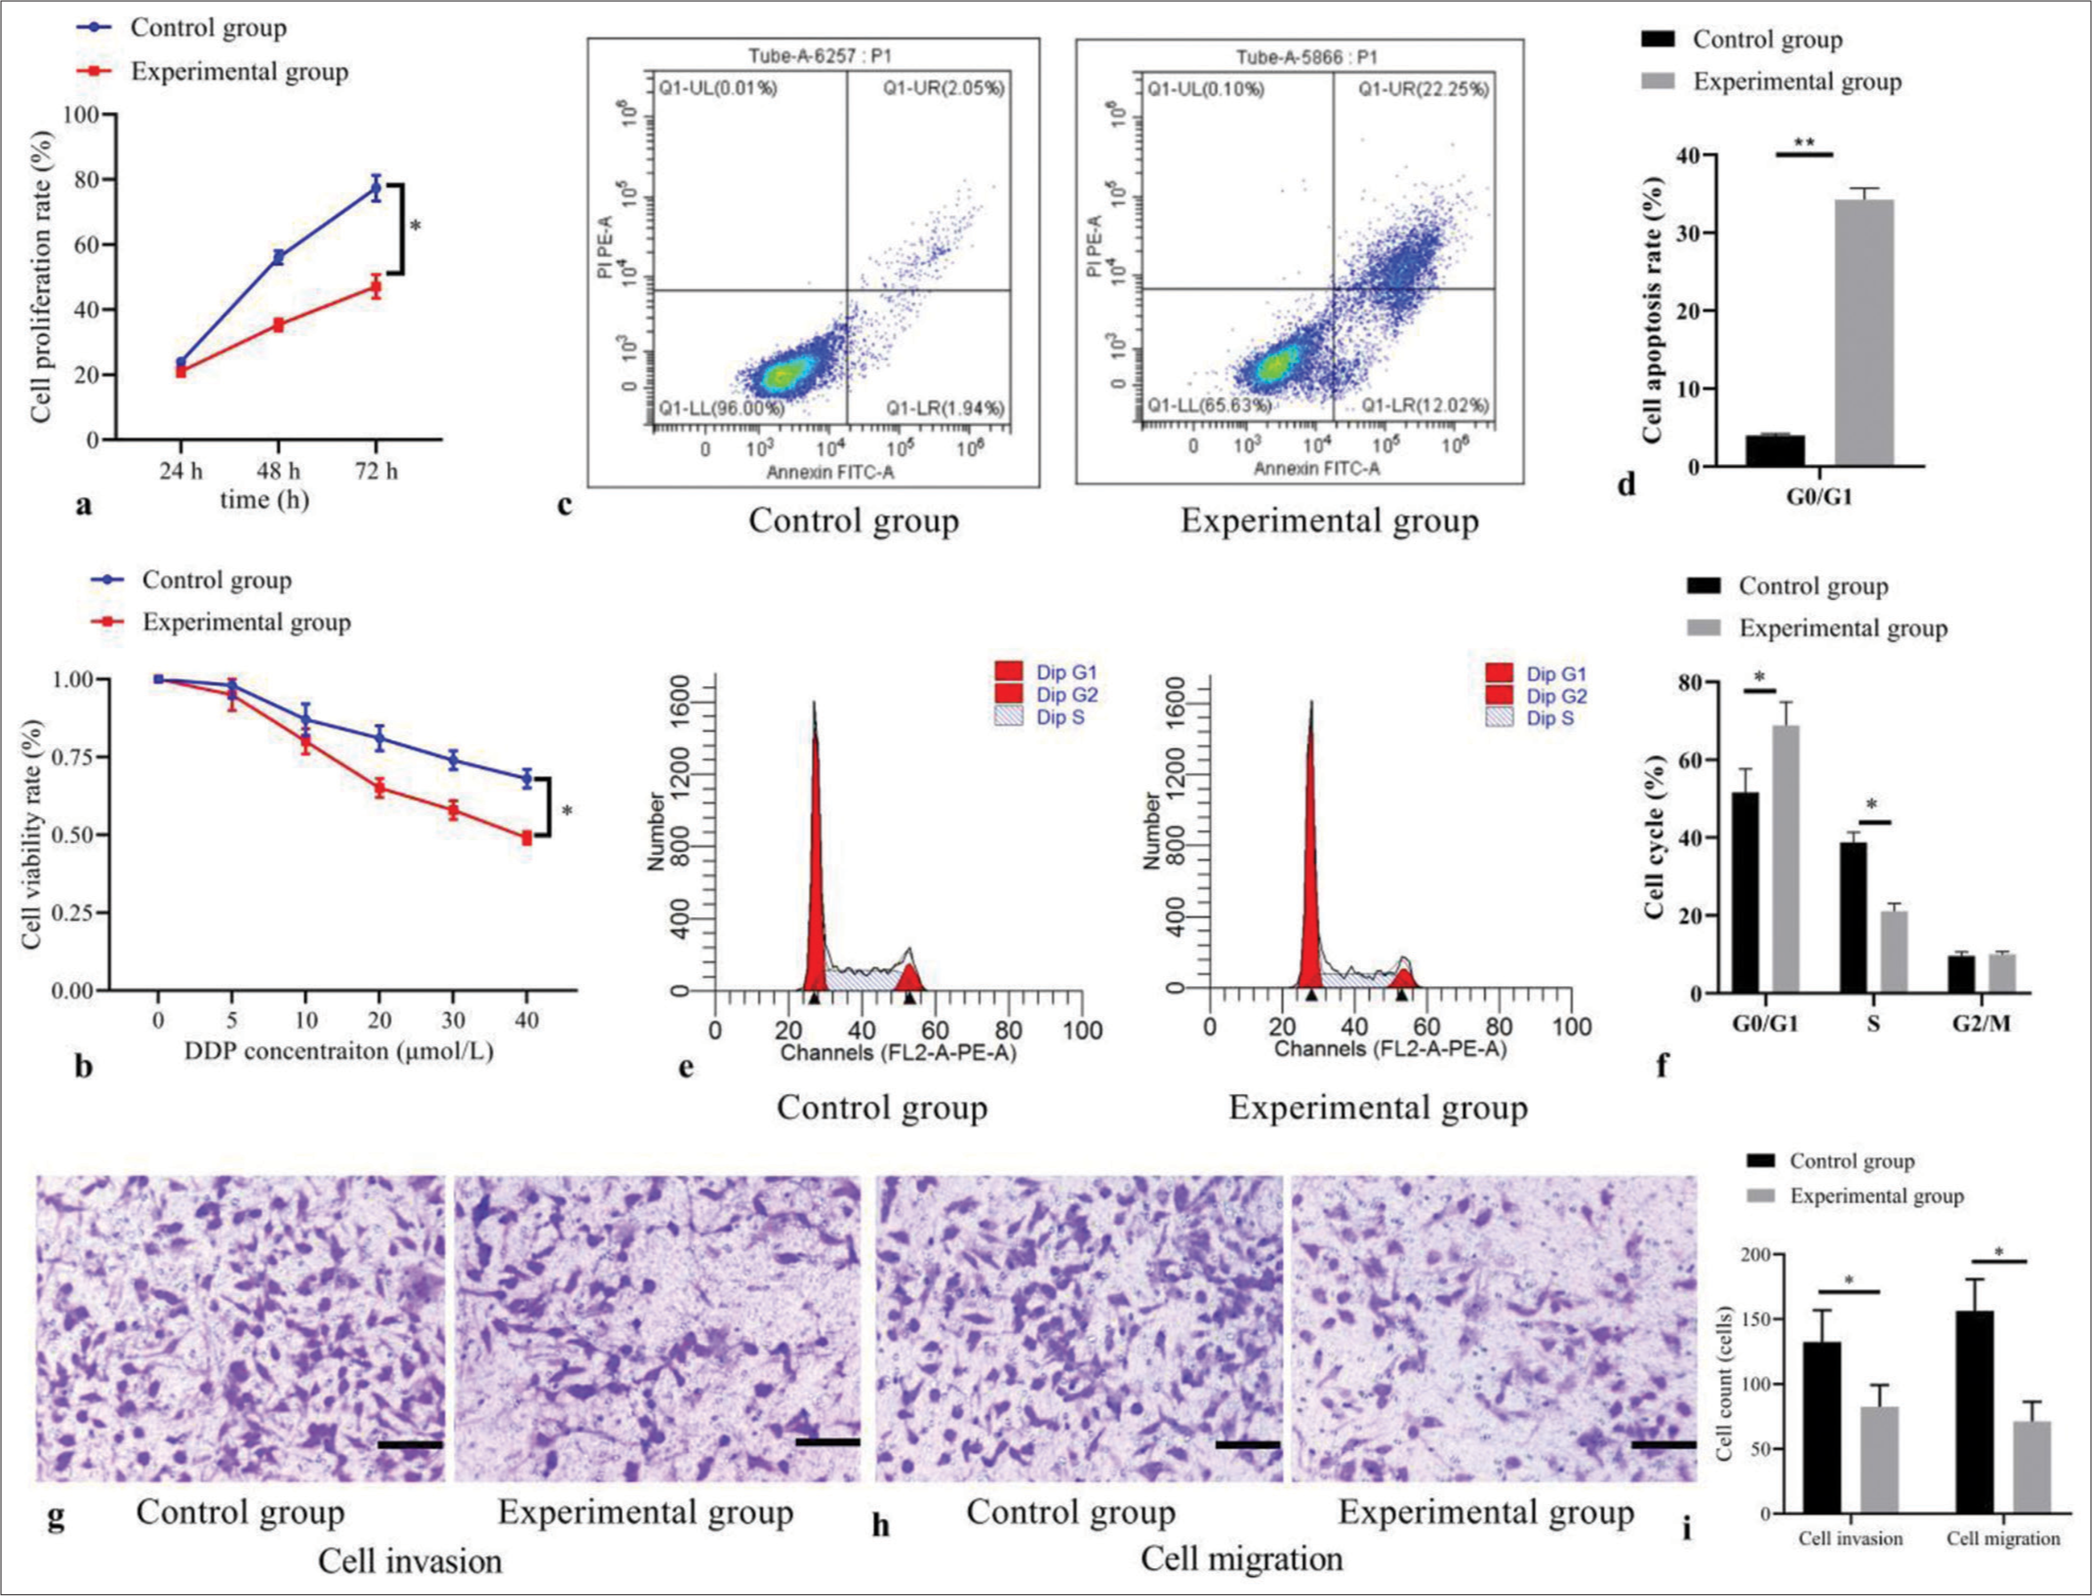
- Effect of 5-Aza-2’-deoxycytidine demethylation on the biological behaviors of T-cell acute lymphoblastic leukemia cells. (a) Cell proliferation by CCK-8; (b) cell viability by MTT; (c) cell apoptosis by flow cytometry; (d) statistical analysis of cell apoptosis; (e) cell cycle distribution by flow cytometry; (f) statistical analysis of cell distribution; (g) cell invasion by transwell assay (stain, methyl violet; scale bars, 100 μm); (h) cell migration by transwell assay (stain, methyl violet; scale bars, 100 μm); and (i) statistical analysis of cell invasion and migration. (*P < 0.05, **P < 0.001). (n = 3). (DDP: Cisplatin; CCK-8: Cell Counting Kit-8; MTT: Methyl-thiazole-tetrazolium.)
Effects of 5-Aza-dC demethylation on the expression of PTEN, methylation related genes, and PI3K/AKT signaling pathway related proteins
According to previous research,[34] PTEN can inhibit T-ALL cells growth. In this study, it was also observed that compared with the control group, the expression of PTEN was significantly increased in the experimental group (P< 0.05, [Figure 3a]). 5-Aza-dC demethylation may increase PTEN expression levels by weakening its methylation in T-ALL cells. Simultaneously, as indicated by Figure 3b, the mRNA expressions of DNMT1, DNMT3a, MBD2, and MeCP2 decreased in the experimental group (all P< 0.05), suggesting that 5-Aza-dC demethylation may realize this upregulating effect through mediating the activities of DNA methyltransferases (DNMTs; e.g., DNMT1, DNMT3a) and methyl-CpG binding proteins (e.g., MBD2, and MeCP2).
Moreover, Western Blotting results [Figure 3c and d] revealed that the experimental group showed significant increase in PTEN expression, decrease in PI3K, AKT, and mTOR protein expressions (all P< 0.05). These results support that the demethylation effect of 5-Aza-dC can restore the expression activity of PTEN to exert its anti-tumor role by negatively regulating the PI3K/AKT signal transduction in T-ALL.
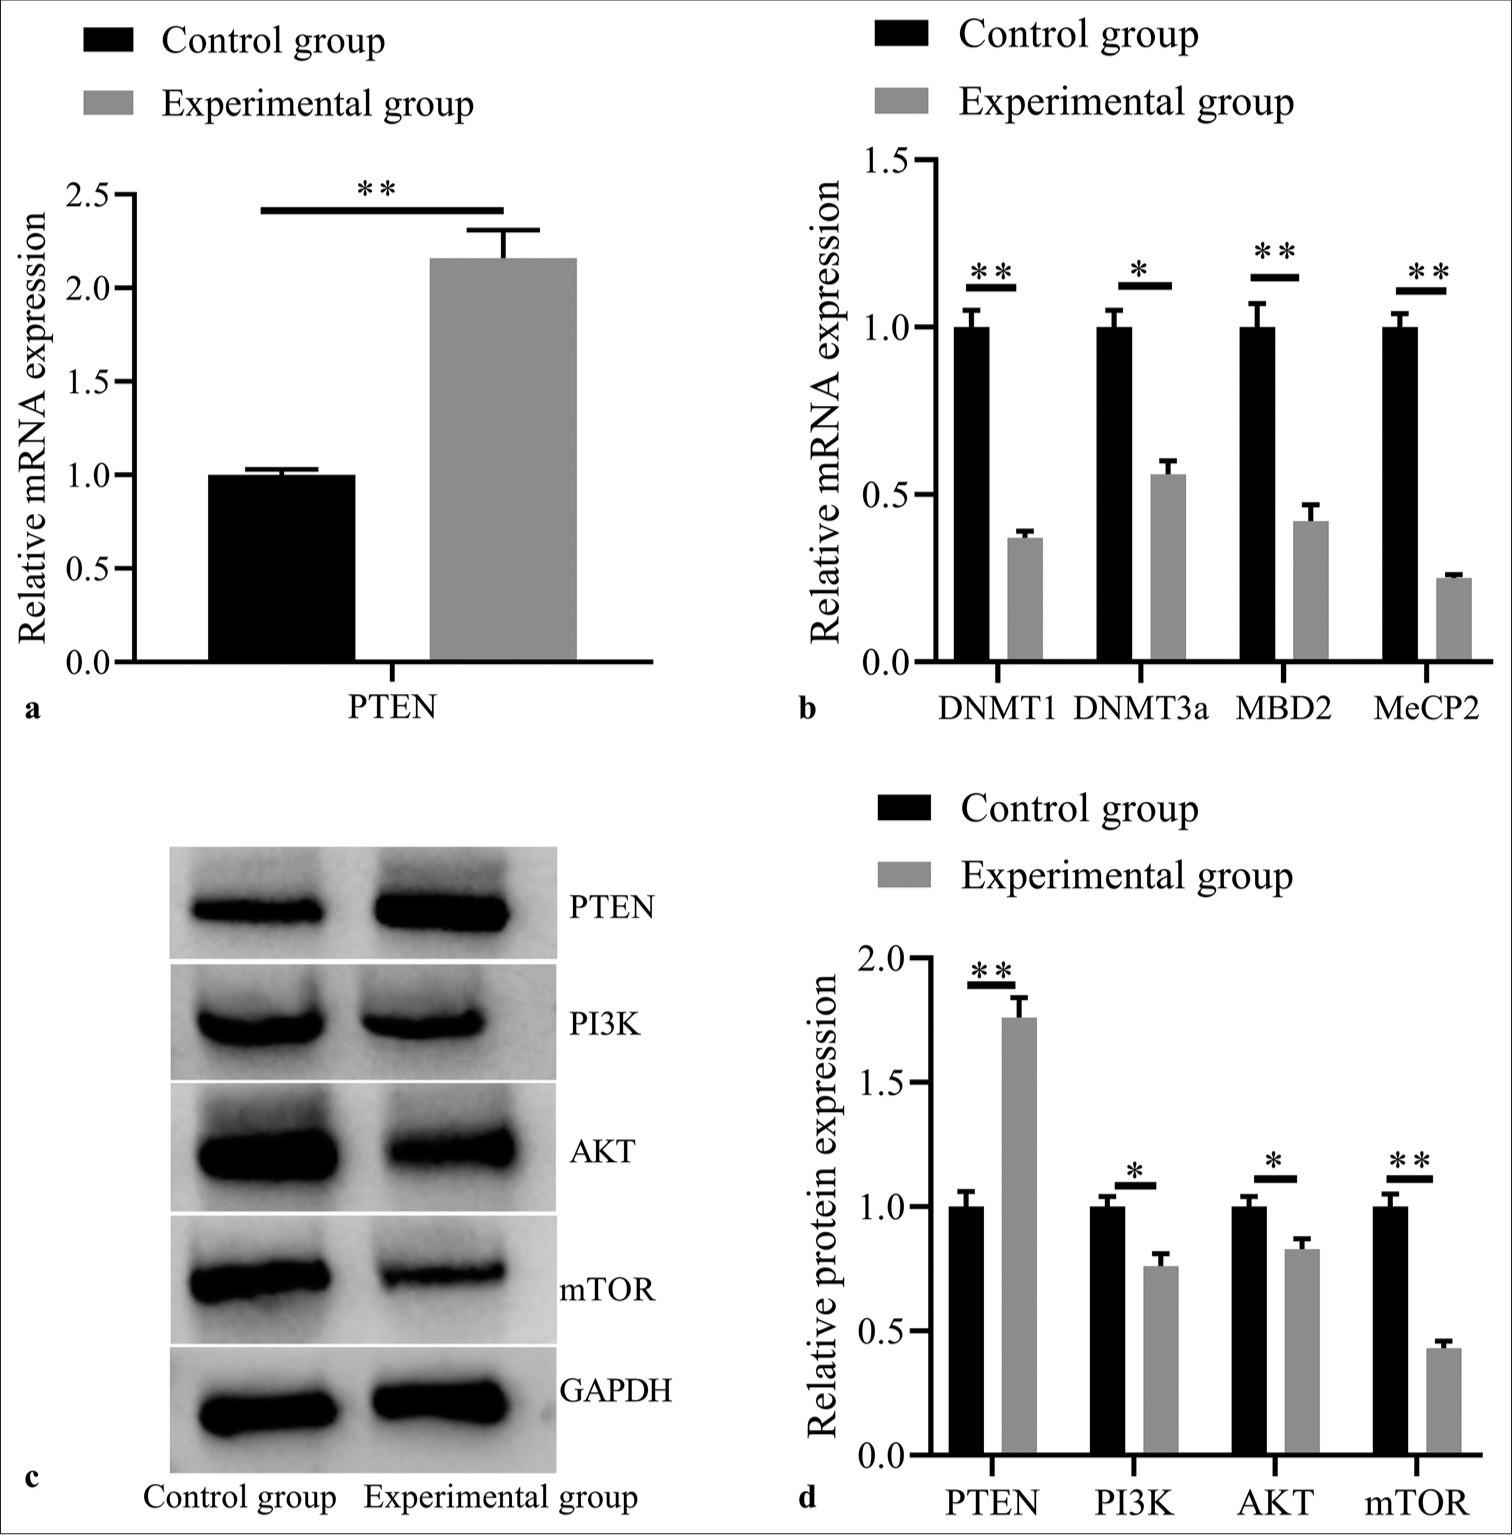
- Effects of 5-Aza-2’-deoxycytidine demethylation on expressions of PTEN and methylation related factors, and PI3K/AKT signaling pathway related proteins. (a) PTEN mRNA expression by RT-PCR; (b) DNMT1, DNMT3a, MBD2, and MeCP2 mRNA expressions by RT-PCR; (c) PTEN, PI3K, AKT, and mTOR protein expressions by western blot; (d) statistical analysis of protein expressions. (n = 3). (*P < 0.05, **P < 0.001). (PTEN: Phosphatase and tensin homolog deleted on chromosome ten; RT-PCR: reverse transcription-polymerase chain reaction.)
The effect of PTEN expression silencing on cellular biological behavior and expression levels
Compared with control (5-Aza-dC) + sh-NC group, 5-AzadC + sh-NC group showed decreased cell proliferation [Figure 4a] and cell viability rates [Figure 4b]; increased cell apoptosis [Figure 4c], elevated cell proportion of G1 phase, but decreased proportion of S phase [Figure 4d], with corresponding statistical analysis results shown in Figure 4e and f; as well as decreased counts of cells invaded and migrated [Figure 4g-i] (all P< 0.05); while control (5-AzadC) + sh-PTEN group showed increased cell proliferation and cell viability rates; decreased cell apoptosis; reduced cell proportion of G1 phase, elevated proportion of S phase; as well as increased counts of cell invaded and migrate (all P< 0.05); but no statistical differences were observed in 5-Aza-dC + sh-PTEN group (all P> 0.05). Interestingly, compared with 5-Aza-dC + sh-NC group, 5-Aza-dC + shPTEN group was observed with increased cell proliferation and cell viability rates, decreased cell apoptosis; reduced cell proportion of G1 phase, elevated proportion of S phase, and increased counts of cell invaded and migrated (all P< 0.05), indicating that silencing PTEN expression can reverse the beneficial roles of 5-Aza-dC on Jurkat cell behaviors.
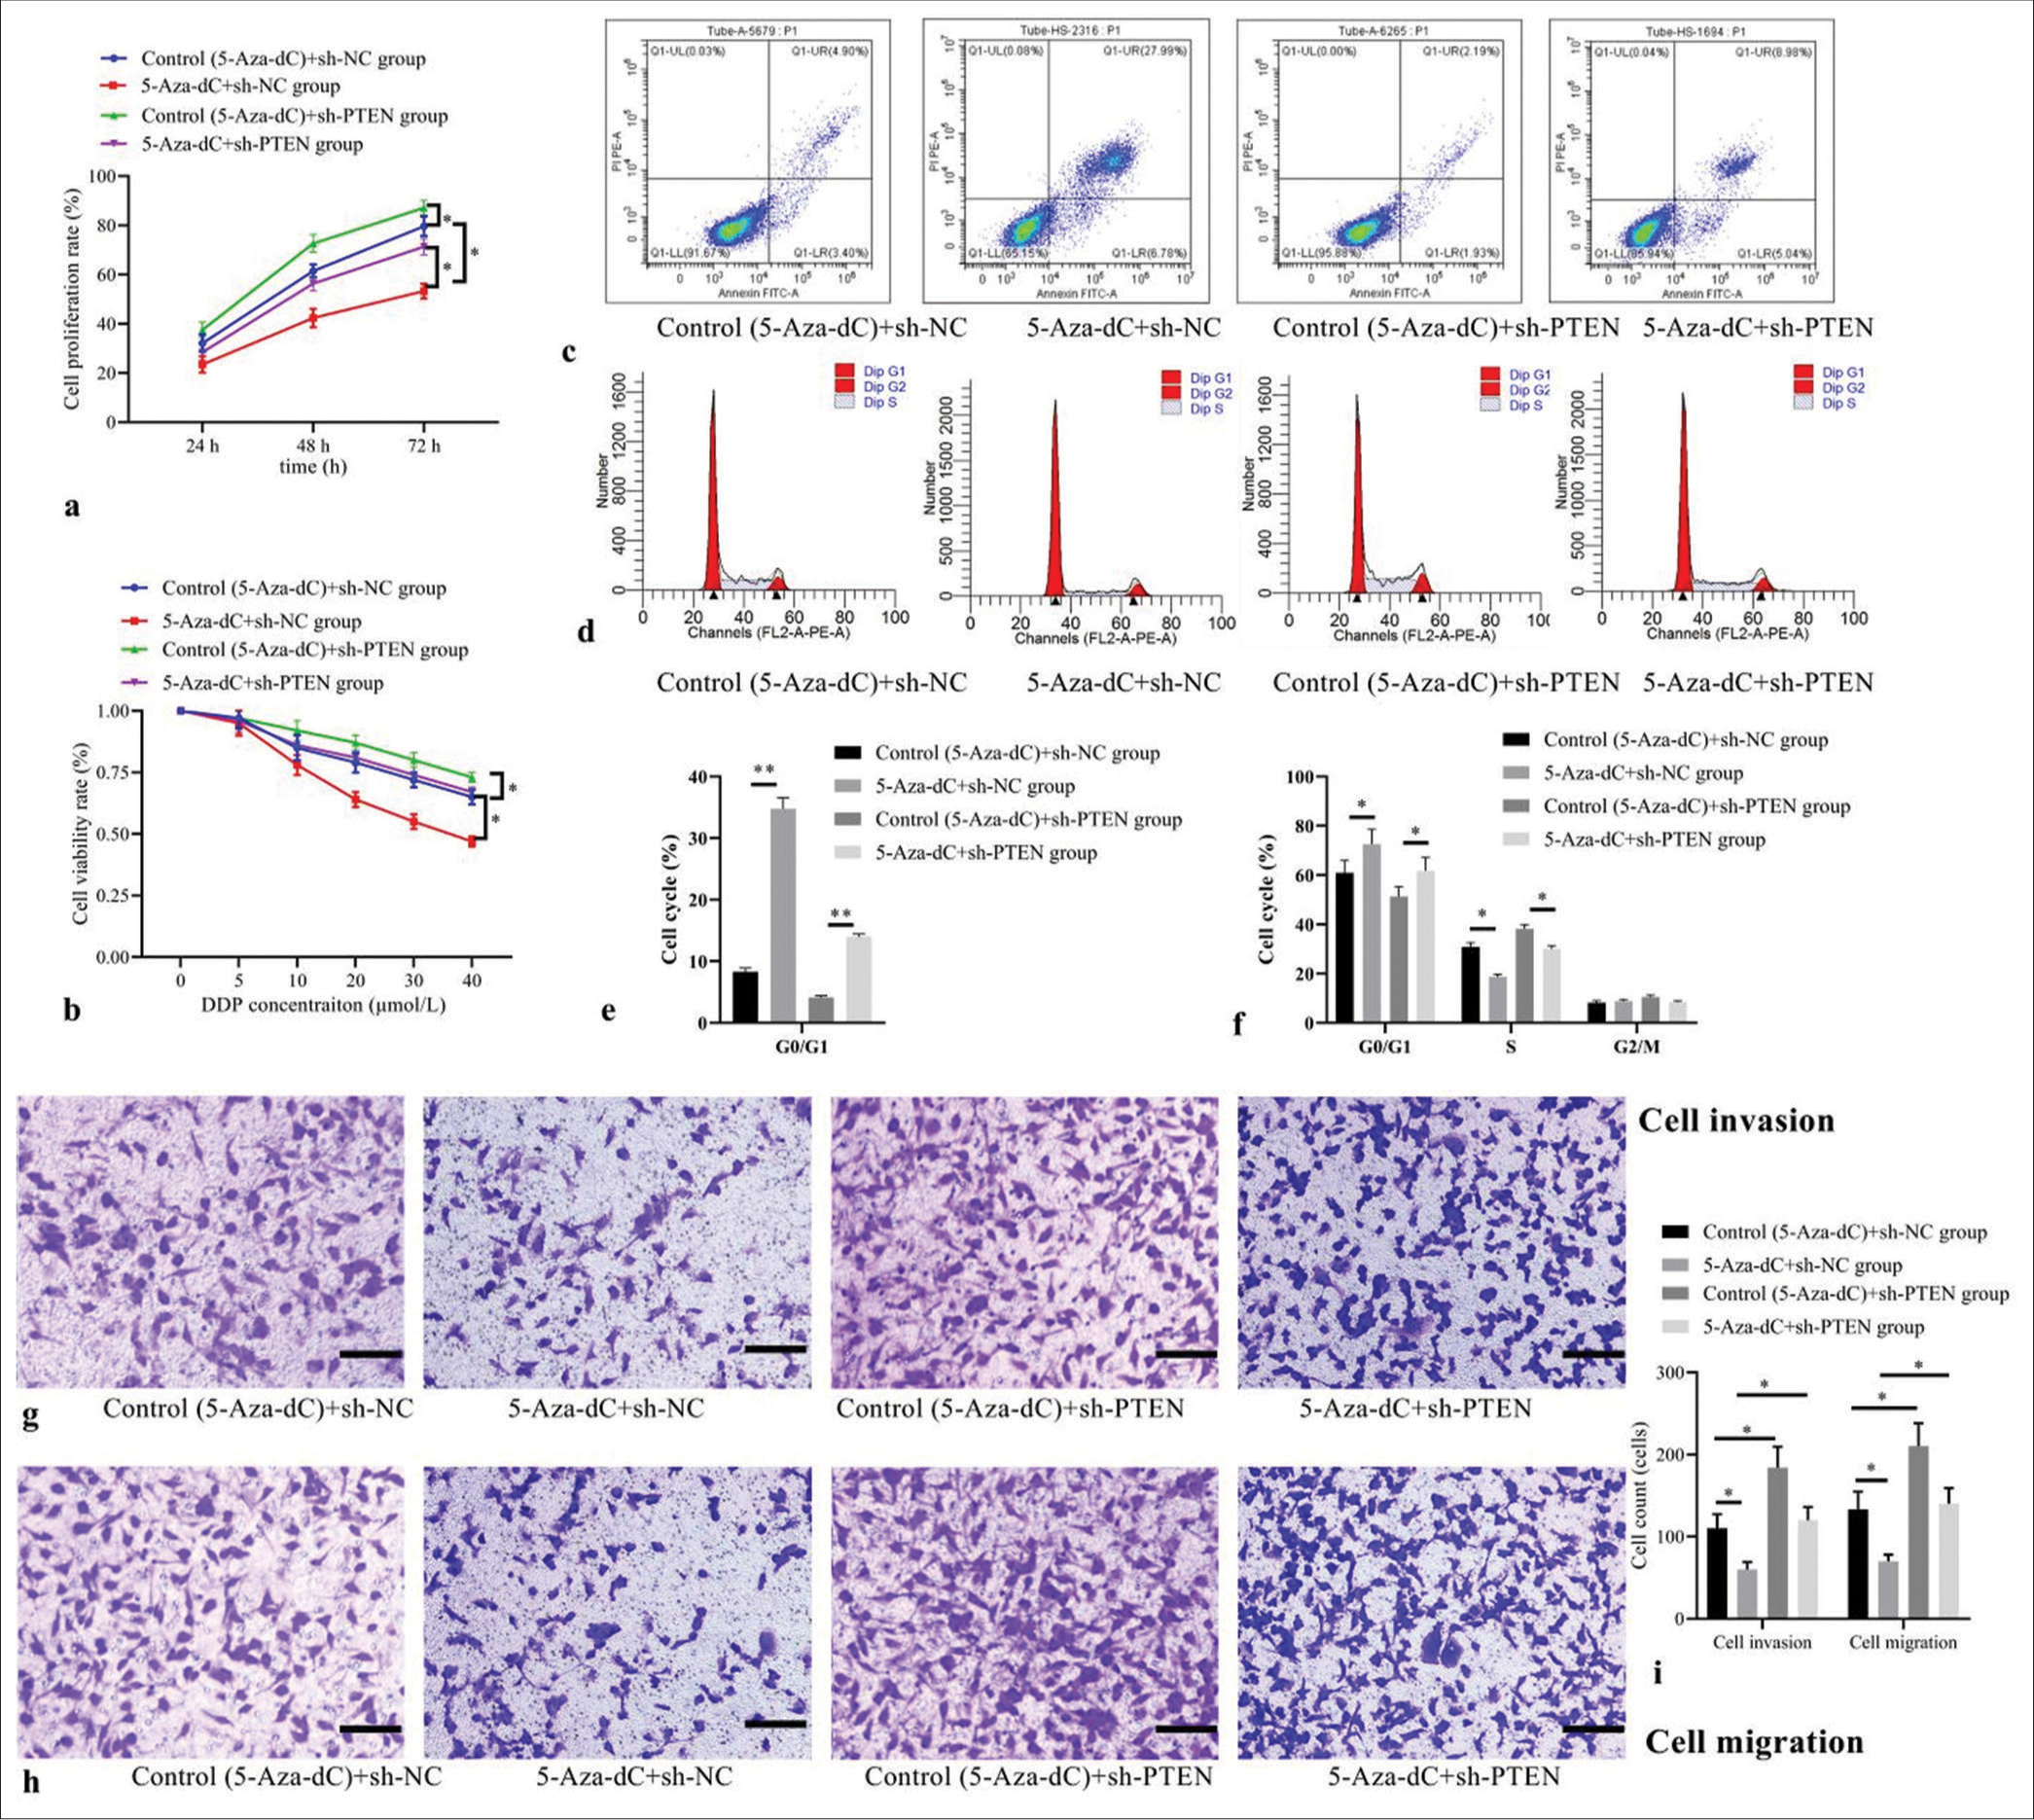
- Effect of PTEN expression silencing on cellular biological behaviors and expression levels. (a) Cell proliferation by CCK-8; (b) cell viability by MTT; (c) cell apoptosis by flow cytometry; (d) cell cycle distribution by flow cytometry; (e) statistical analysis of cell apoptosis; (f) statistical analysis of cell distribution; (g) cell invasion by transwell assay (stain, methyl violet; scale bars, 100 μm); (h) cell migration by transwell assay (stain, methyl violet; scale bars, 100 μm); and (i) statistical analysis of cell invasion and migration. (n = 3). (*P < 0.05, **P < 0.001). (DDP: Cisplatin; CCK-8: Cell Counting Kit-8; MTT: Methyl-thiazole-tetrazolium; PTEN: Phosphatase and tensin homolog deleted on chromosome ten; NC: negative control.)
Compared with control (5-Aza-dC) + sh-NC group, 5-AzadC + sh-NC group showed significantly increased mRNA expressions of PTEN [Figure 5a], DNMT1, DNMT3a, MBD2, and MeCP2 [Figure 5b]; and obviously increased PTEN protein expression, but decreased protein expressions of PI3K, AKT, and mTOR [Figure 5c and d] (all P< 0.05); while control (5-Aza-dC) + sh-PTEN group revealed significantly reduced mRNA expression levels of PTEN, DNMT1, DNMT3a, MBD2, and MeCP2; evidently decreased PTEN protein expression, and highly increased protein expressions of PI3K, AKT and mTOR (all P< 0.05); but no statistical differences were observed in 5-Aza-dC + sh-PTEN group (all P> 0.05).
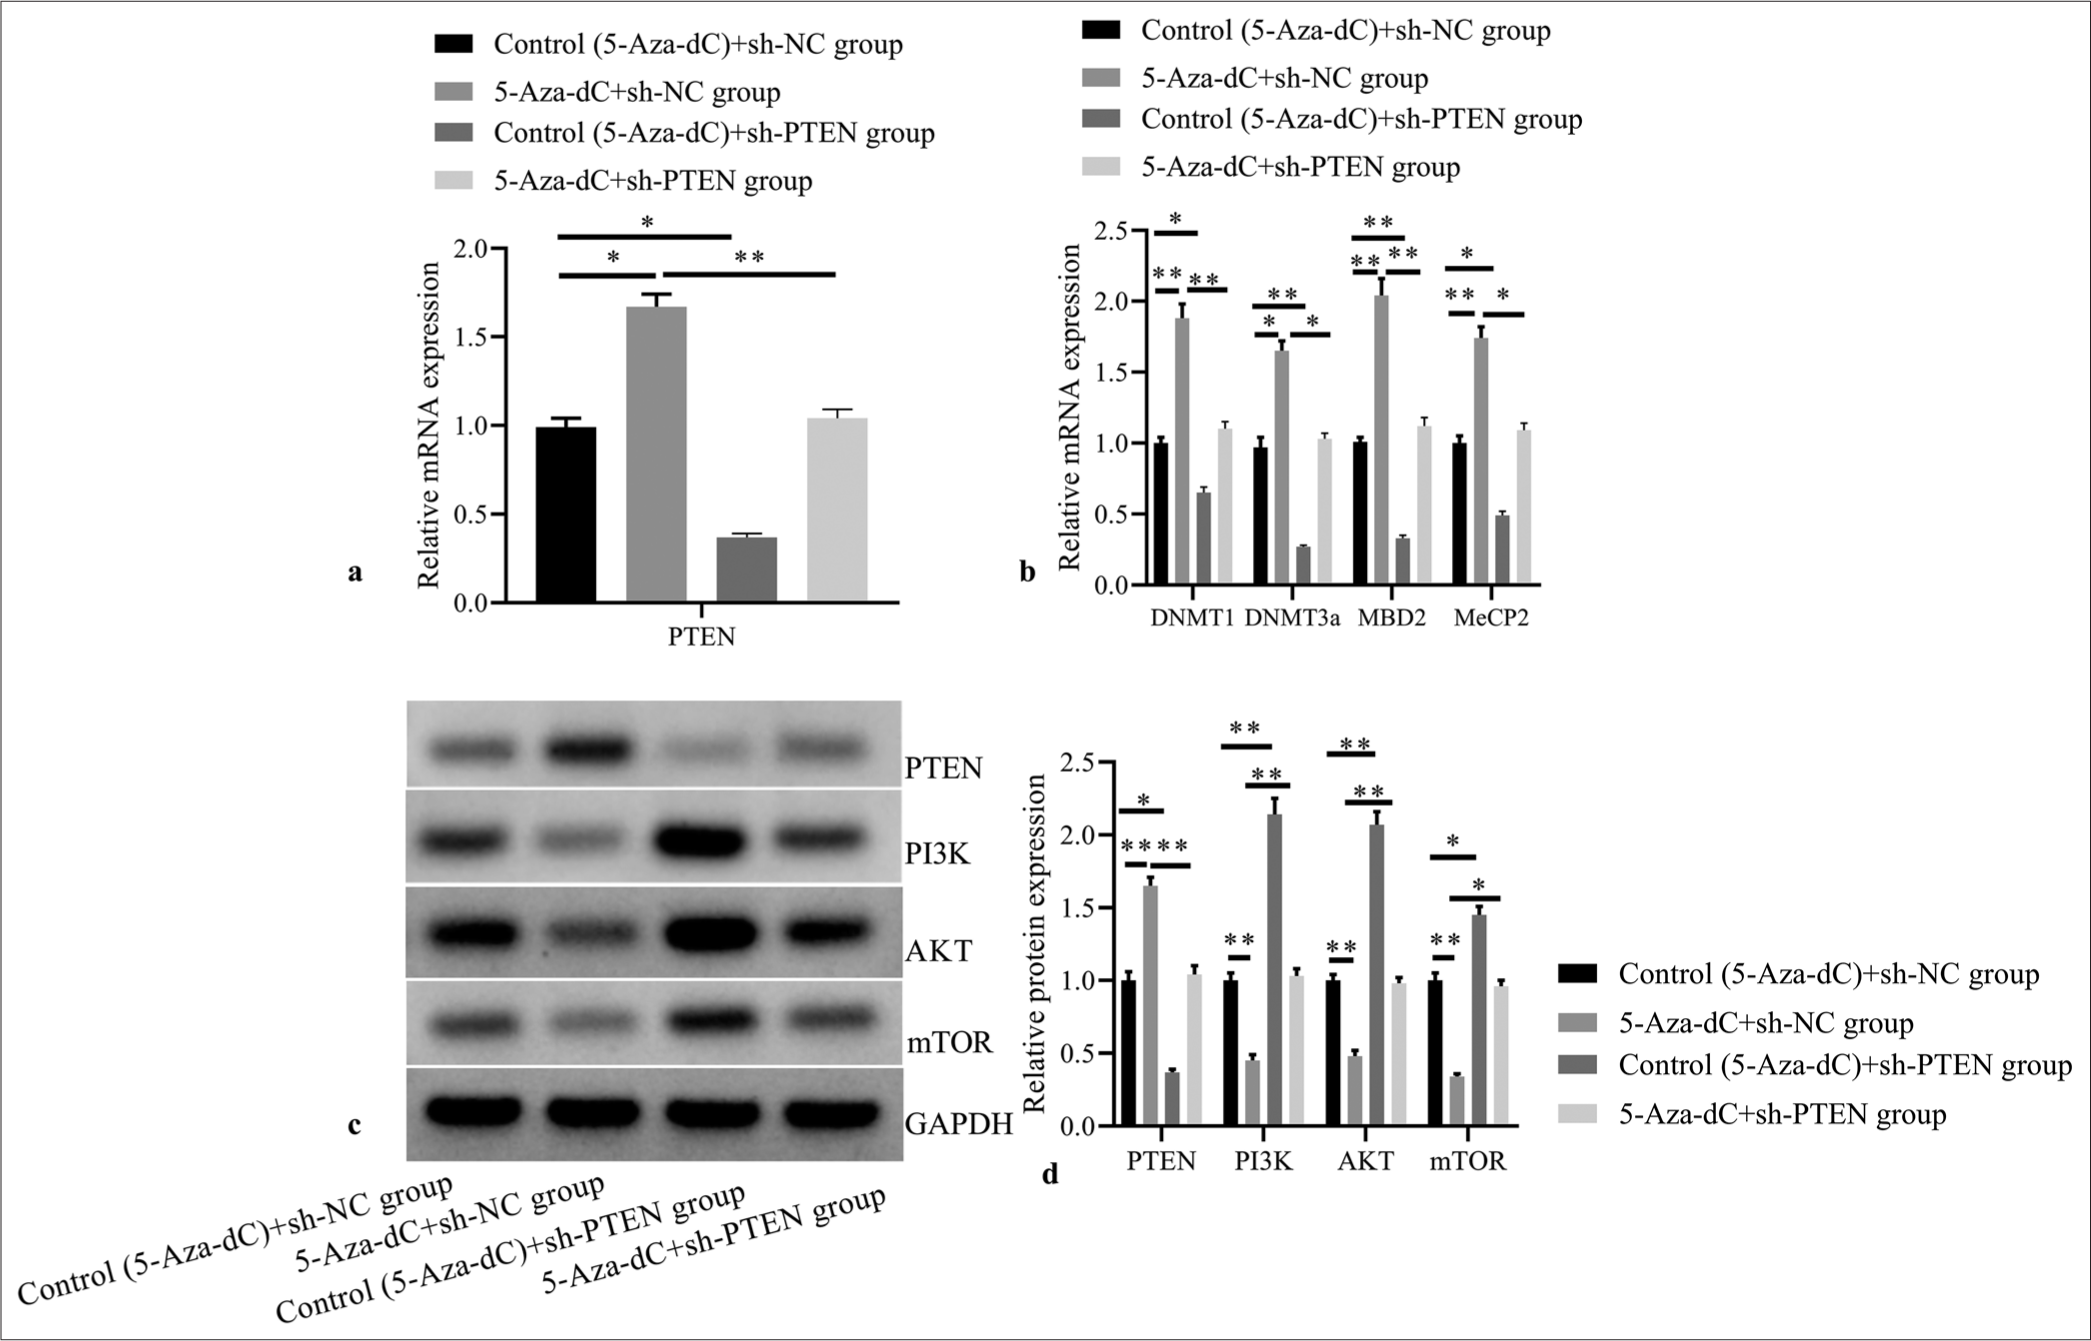
- Effect of PTEN expression silencing on expressions of PTEN and methylation related factors, and PI3K/AKT signaling pathway related proteins. (a) PTEN mRNA expression by RT-PCR; (b) DNMT1, DNMT3a, MBD2, and MeCP2 mRNA expressions by RT-PCR; (c) PTEN, PI3K, AKT, and mTOR protein expressions by western blot; (d) statistical analysis of protein expressions. (n = 3). (*P < 0.05, **P < 0.001). (PTEN: Phosphatase and tensin homolog deleted on chromosome ten; RT-PCR: reverse transcription-polymerase chain reaction; NC: negative control.)
Moreover, compared with 5-Aza-dC + sh-NC group, 5-Aza-dC + sh-PTEN group showed reduced mRNA expression levels of DNMT1, DNMT3a, MBD2, and MeCP2; and evidently decreased PTEN protein expression, but highly increased protein expressions of PI3K, AKT, and mTOR (all P< 0.05). It suggests that loss-of-function of PTEN may stimulate tumor progression, which may be related to the methylation effect and activation of PI3K/AKT signaling transduction in T-ALL.
The effect of PTEN expression restoration on cellular biological behavior and expression levels
Compared with control (5-Aza-dC) + oe-NC group, 5-AzadC + oe-NC group, control (5-Aza-dC) + oe-PTEN group, and 5-Aza-dC + oe-PTEN group showed decreased cell proliferation rate [Figure 6a] and cell viability rate [Figure 6b]; increased cell apoptosis [Figure 6c], elevated cell proportion of G1 phase, but decreased proportion of S phase [Figure 6d], with corresponding statistical analysis results shown in Figure 6e and f; as well as decreased counts of cells invaded and migrated [Figure 6g-i] (all P< 0.05); no significant difference was observed between 5-Aza-dC + oe-NC group and control (5-Aza-dC) + oe-PTEN group (all P> 0.05); and 5-Aza-dC + oe-PTEN group showed even more significantly decreased cell proliferation and cell viability rates, increased cell apoptosis and cell proportion of G1 phase, but decreased proportion of S phase, as well as decreased counts of cells invaded and migrated when compared with 5-Aza-dC + oe-NC group (all P< 0.05), indicating that restoring PTEN expression can enhance the beneficial roles of 5-Aza-dC on Jurkat cell behaviors.
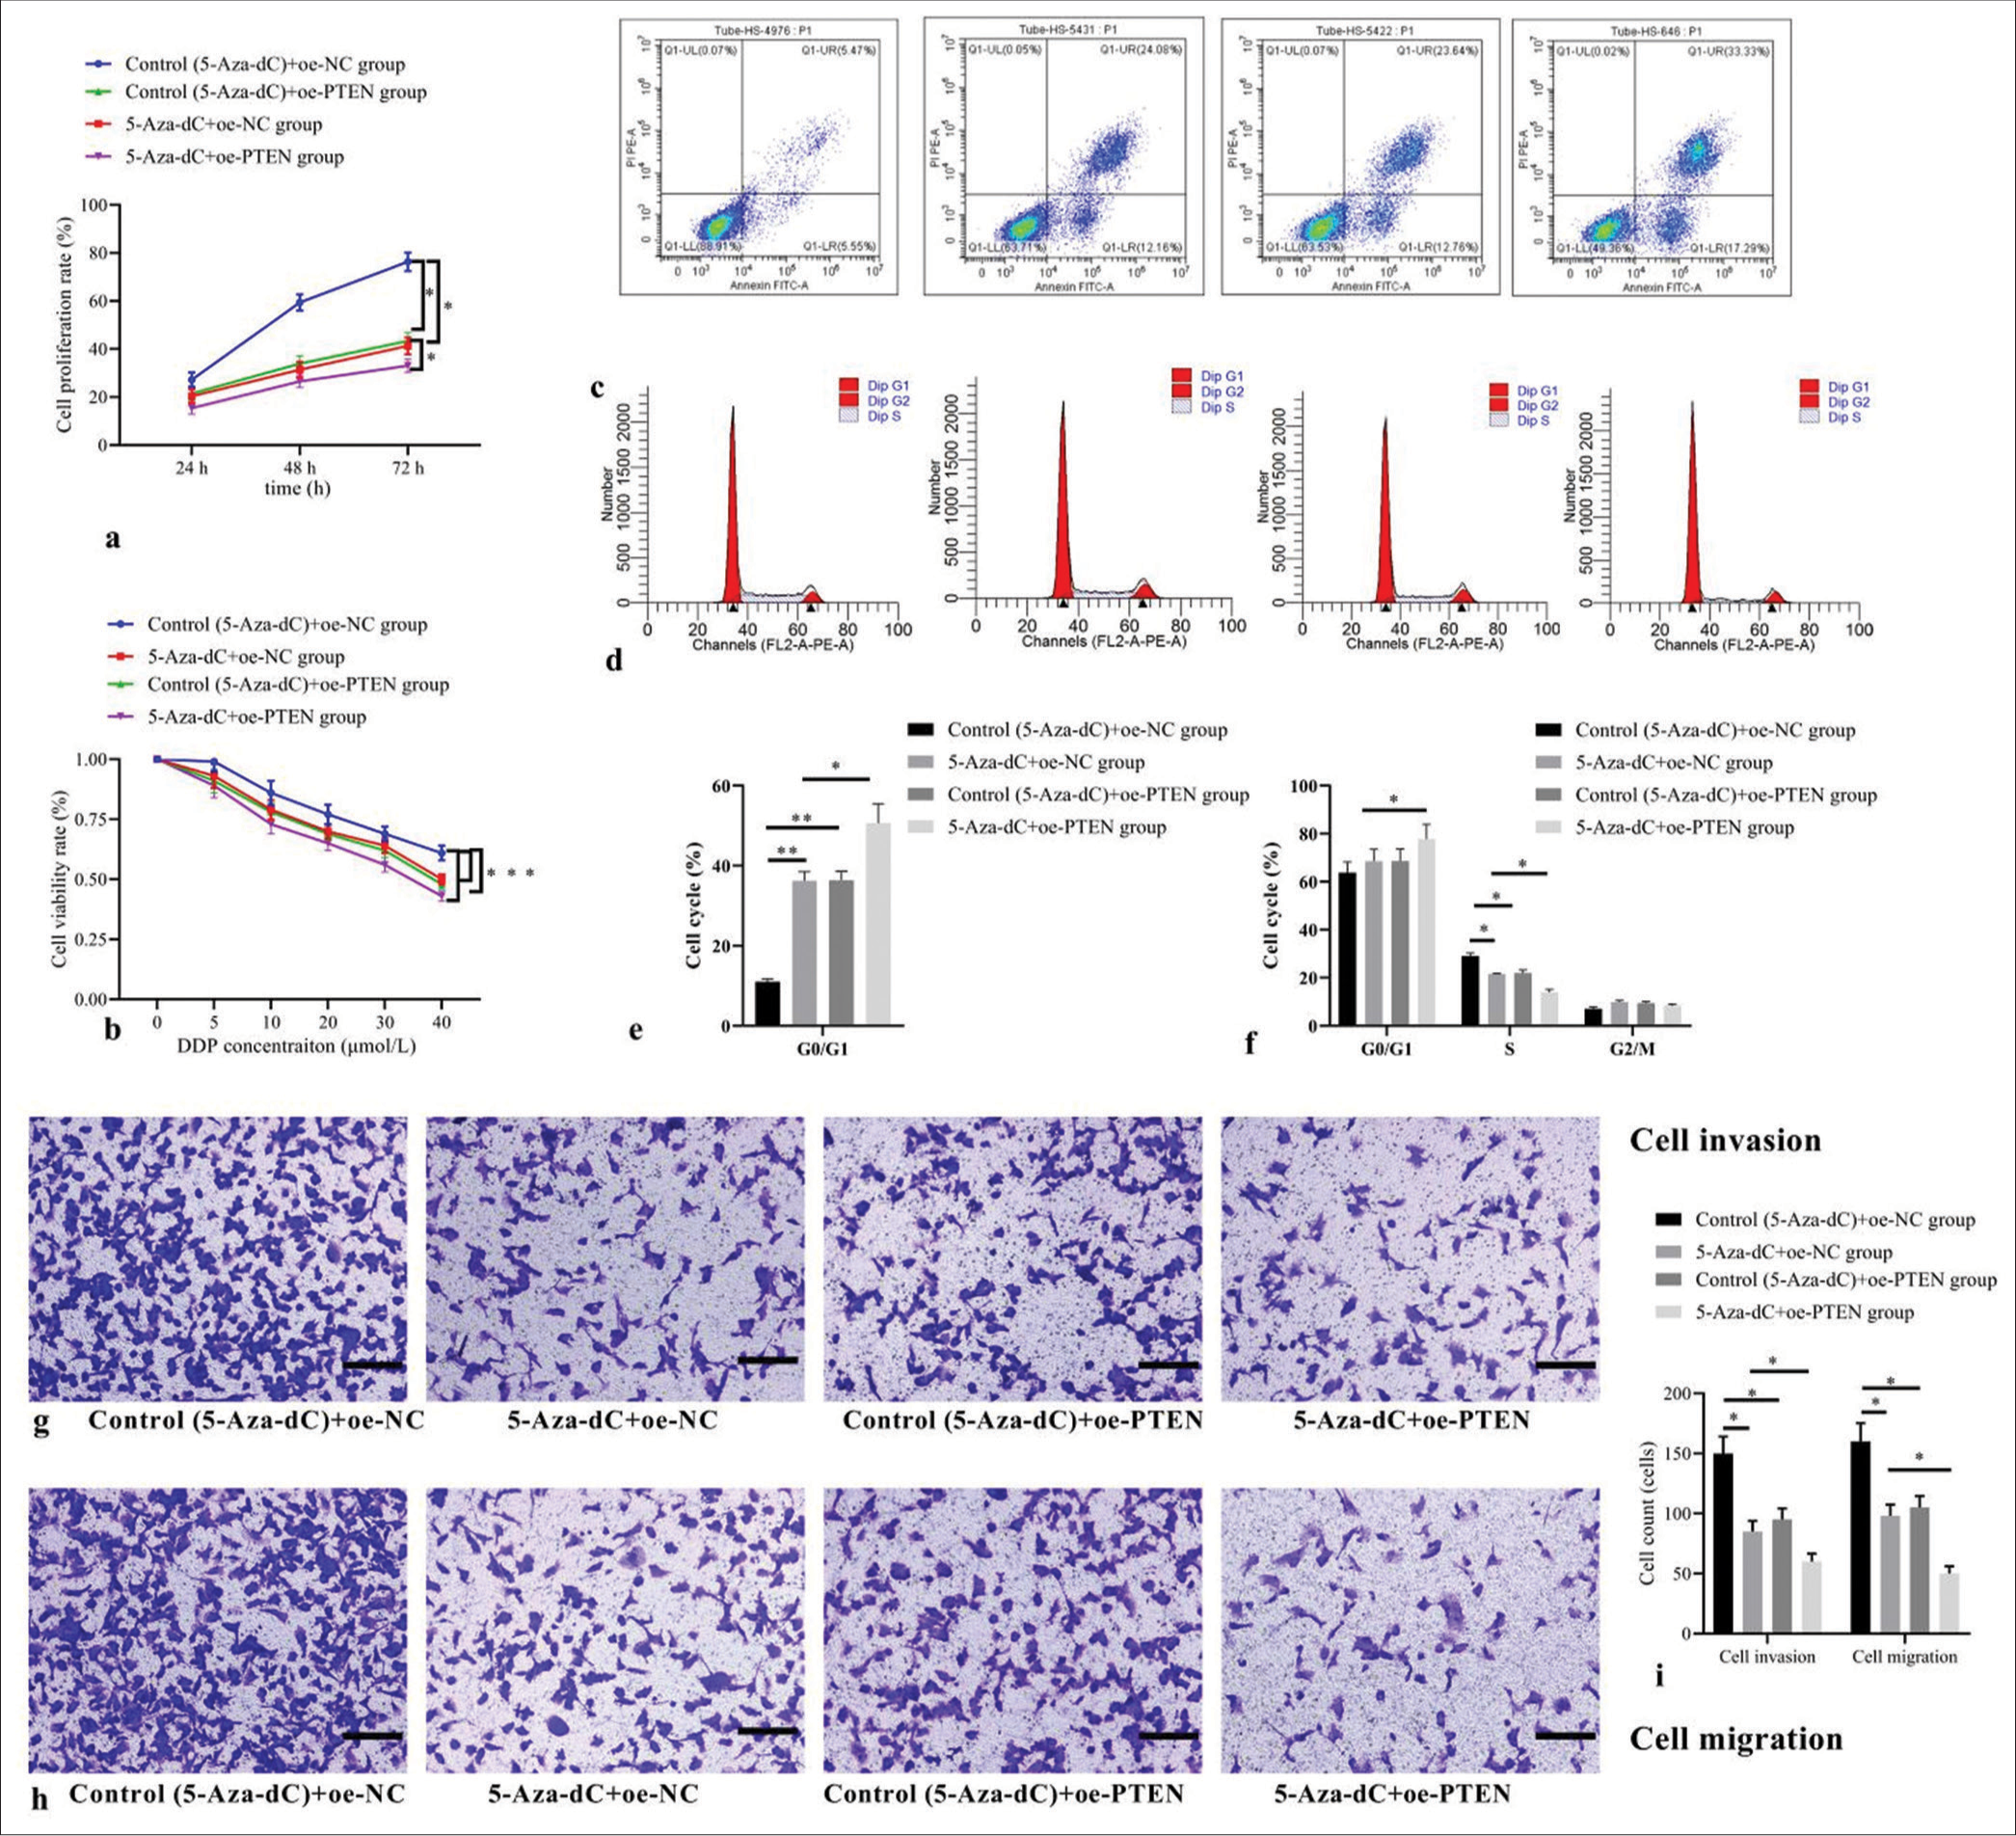
- Effect of PTEN expression restoration on cellular biological behaviors and expression levels. (a) Cell proliferation by CCK-8; (b) cell viability by MTT; (c) cell apoptosis by flow cytometry; (d) cell cycle distribution by flow cytometry; (e) statistical analysis of cell apoptosis; (f) statistical analysis of cell distribution; (g) cell invasion by transwell assay (stain, methyl violet; scale bars, 100 μm); (h) cell migration by transwell assay (stain, methyl violet; scale bars, 100 μm); and (i) statistical analysis of cell invasion and migration. (n = 3). (*P < 0.05, **P < 0.001). (DDP: Cisplatin; Cell Counting Kit-8; MTT: Methyl-thiazole-tetrazolium; PTEN: Phosphatase and tensin homolog deleted on chromosome ten; NC: negative control.)
Compared with control (5-Aza-dC) + oe-NC group, 5-AzadC + oe-NC group, control (5-Aza-dC) + oe-PTEN group, and 5-Aza-dC + oe-PTEN group showed significantly increased mRNA expression levels of PTEN [Figure 7a], DNMT1, DNMT3a, MBD2, and MeCP2 [Figure 7b]; and obviously increased PTEN protein expression, but decreased protein expressions of PI3K, AKT, and mTOR [Figure 7c and d] (all P< 0.05); no significant difference was observed between 5-Aza-dC + oe-NC group and control (5-Aza-dC) + oe-PTEN group (all P> 0.05); and 5-Aza-dC + oe-PTEN group showed even more significantly increased mRNA expression levels of DNMT1, DNMT3a, MBD2, and MeCP2; and obviously increased PTEN protein expression, but decreased protein expressions of PI3K, AKT, and mTOR when compared with 5-Aza-dC + oe-NC group (all P< 0.05).
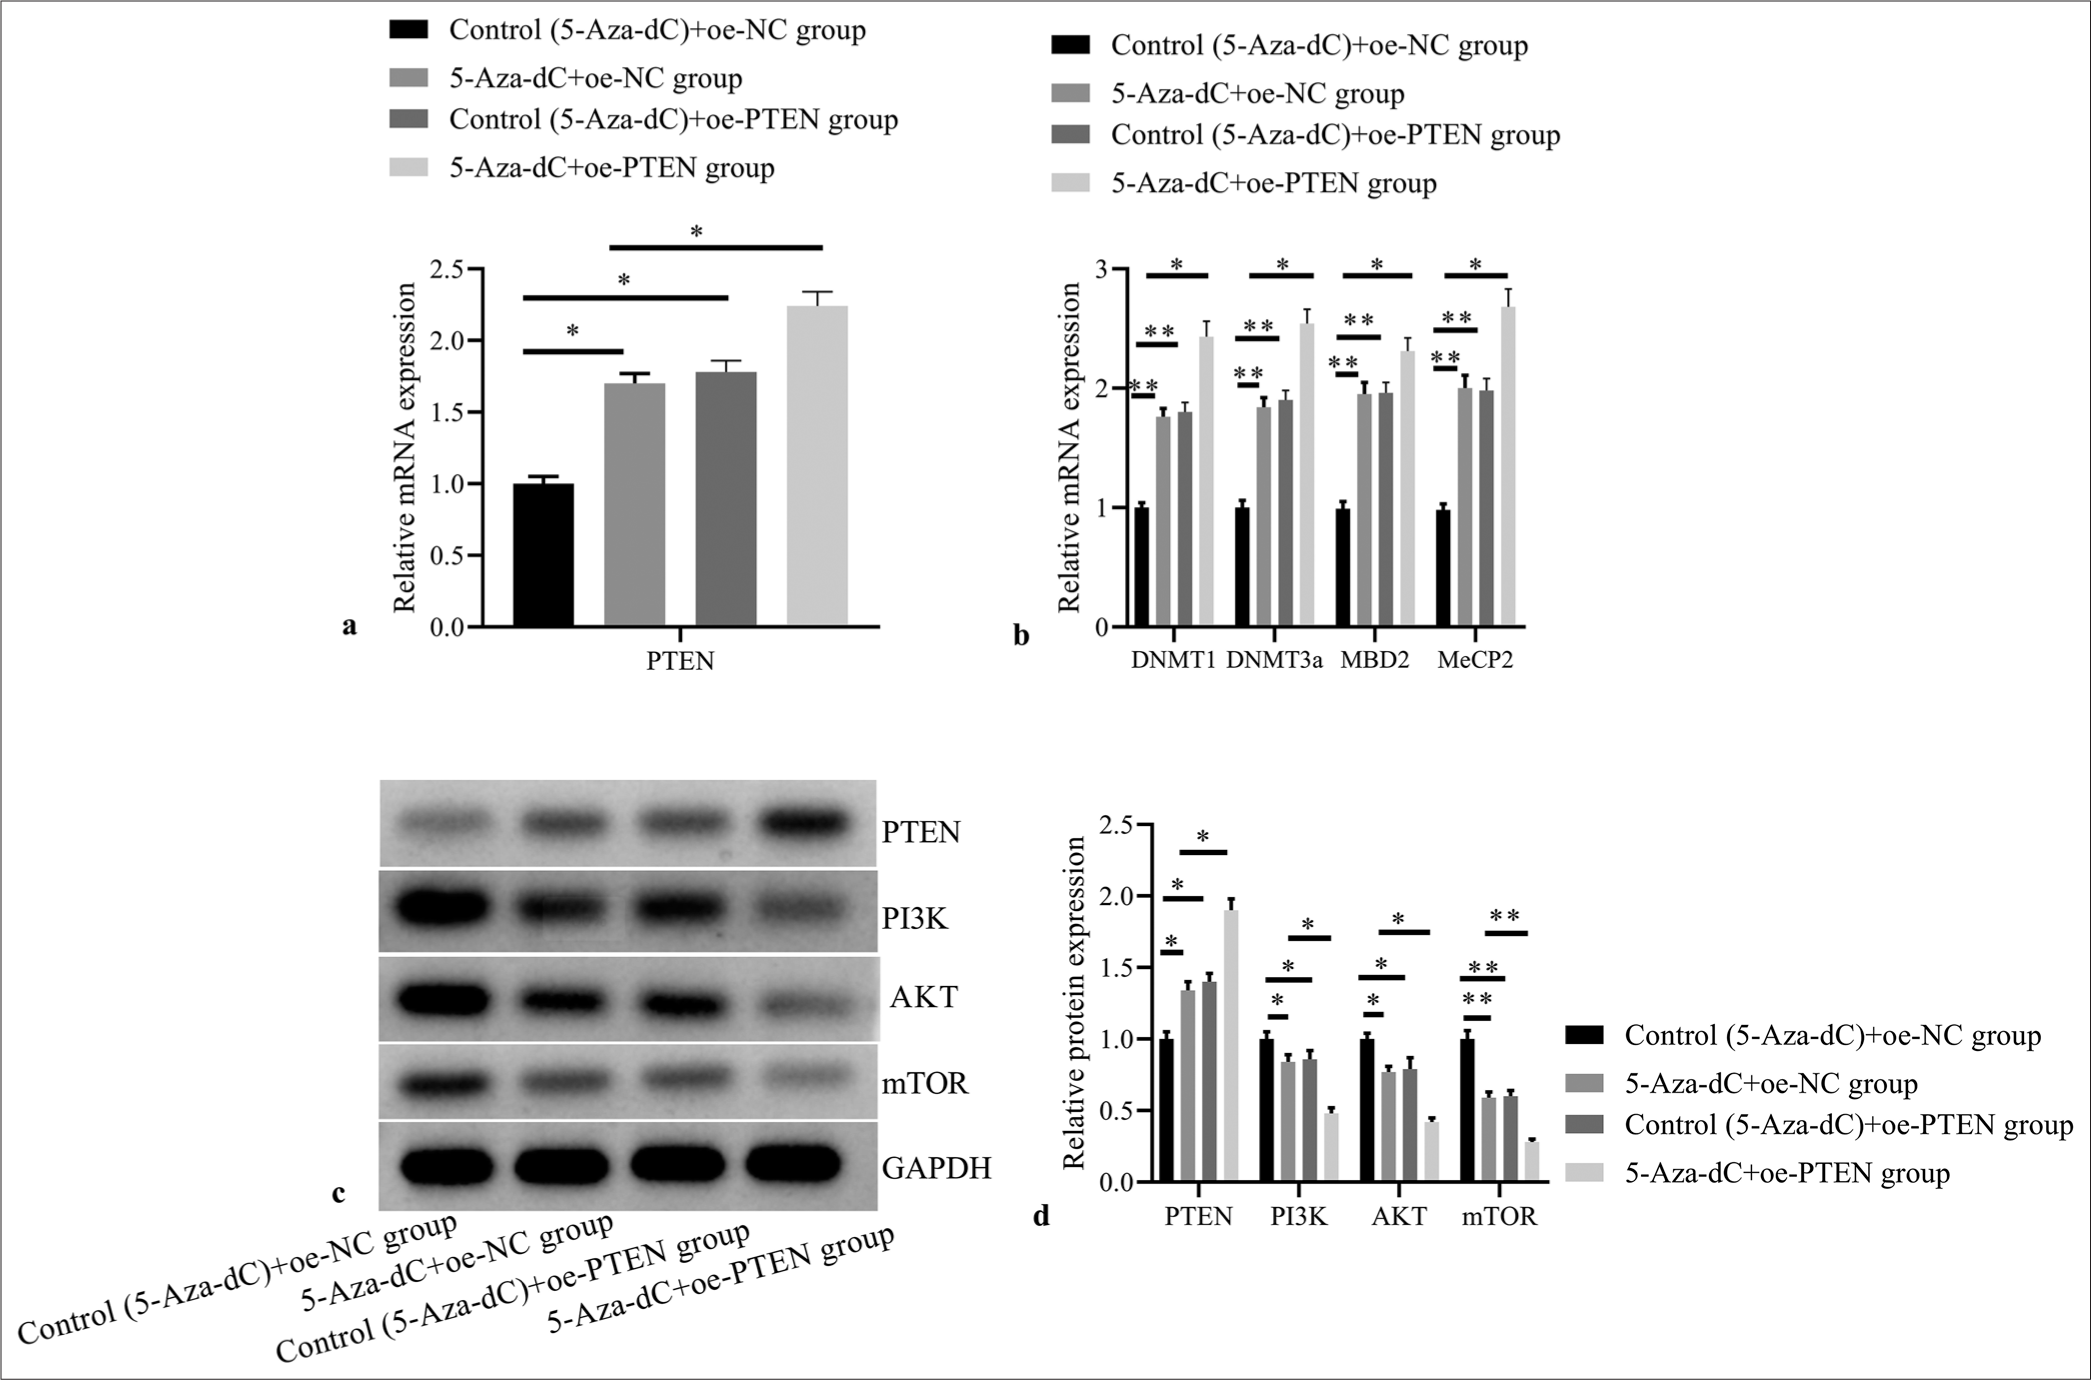
- Effect of PTEN expression restoration on expressions of PTEN and methylation related factors, and PI3K/AKT signaling pathway related proteins. (a) PTEN mRNA expression by RT-PCR; (b) DNMT1, DNMT3a, MBD2, and MeCP2 mRNA expressions by RT-PCR; (c) PTEN, PI3K, AKT, and mTOR protein expressions by western blot; (d) statistical analysis of protein expressions. (n = 3). (*P < 0.05, **P < 0.001). (PTEN: Phosphatase and tensin homolog deleted on chromosome ten; NC: negative control.)
DISCUSSION
In view of the multi-factorial and multi-step features of malignancies,[10] the occurrence of tumors is elaborated to be genetically attributed to phenotypic changes and dysregulation of tumor cell proliferation resulted from the imbalanced gene expressions under the impacts of various factors.[13] Disordered activities of tumor suppressor genes and oncogenes may lead to uncontrolled cell growth.[2] Epigenetic changes are even more complex processes,[11,12] and critical changes may occur in the cellular epigenome during tumor development, such as methylation in the promoter region of tumor suppressor genes.[37] Methylation imbalance is common in tumor cells, where cytosine-phosphate-guanine (CpG) islands undergo methylation that may lead to gene expression silencing usually.[18] Theoretically, methylation of gene promoters can directly hinder the binding of transcription factors to promoters to inhibit gene transcription.[38] Significantly, DNA methylation does not involve changes in DNA sequences, but partial methylation modifications of base pairs merely, supporting that DNA methylation of genes is a reversible epigenetic modification process.[39] In theory, the use of agents with demethylation effects can reverse the methylation status of gene DNA, restore the phenotype of silenced genes, and thus inhibit tumor cell growth. Consequently, it highlights the role of pharmacological intervention for demethylation in tumor treatment recently. An existing agent with definite demethylation effect is 5-Aza-dC,[31-33] which, as a class of nucleoside derivatives, has been widely used in clinical selective therapy and clinical trials. Through stimulating the demethylation process of DNA both in vitro and in vivo, it can restore the expression of methylation-silenced tumor suppressor genes,[40] thereby preventing subsequent development of tumor cells.
DNMTs are critical during DNA methylation.[14] Among them, DNMT1 can mediate methylation status to maintain gene stability, while DNMT3a and DNMT3b can catalyze the replication of un-methylated DNA to form a semi-methylated state.[41] All these members can catalyze the methylation of tumor suppressor genes, enabling precise replication of gene methylation.[41] CpG island methylation typically occurs in or near the promoter region, which may interfere with the binding of transcription factors.[42] Genes that control cell cycle and repair can undergo mutations or silencing through hypermethylation at their promoter sites[43]. This type of DNA modification catalyzed by DNMTs can regulate gene expression and silence expressions of tumor suppressor genes.[29] Meanwhile, MBDs bridge between DNA methylation and transcriptional inactivation of tumor suppressor genes.[44] MBD2 and MeCP2 are fundamental members of the MBDs family.[45] MBD2 can bind to abnormally high methylated tumor suppressor genes and form transcriptional inhibition complexes by recruiting histone deacetylases, causing changes in chromosome morphology and structure, which is not conducive to DNA unwinding and melting, thereby inhibiting gene transcription and exerting a pro-tumor effect, such as enlarging tumor volume and increasing tumor number.[46] While MeCP2 can inhibit the normal transcription of target genes by binding to the methylated site of corresponding genes and recruiting a transcriptional-repression domain that binds to the target site.[47] Clearly, both MBD2 and MeCP2 have inhibitory effects on gene transcription and expressions. PTEN, a common tumor suppressor gene,[19] can indirectly regulate cell growth and other steps by regulating PI3K/AKT through negative feedback.[22] Abnormal methylation of PTEN can lead to its silenced expression to mediate carcinogenesis.[24-27] There is also a high methylation of PTEN reported in human leukemia.[48] Significantly, DNA methylation can be reversed by the demethylating agent, thereby re-expressing transcriptionally inactive tumor suppressor genes, inhibiting tumor cell growth, promoting cell differentiation and apoptosis, and achieving the goal of treating tumors.[49] In this regard, there is a possibility that the methylation state of PTEN can be reversed by demethylating agents to exert its tumor-suppressing role. In our speculation, based on the effects of the demethylating agent of 5-Aza-dC on inducing DNA damage and cell cycle arrest, promoting cell differentiation and apoptosis, and inhibiting cell proliferation, treatment with 5-Aza-dC enables to restore the expression of PTEN in tumor cells, leading to growth inhibition and apoptosis of tumor cells. Considering the above interpretations, we thus hypothesized that 5-AzadC with demethylation effect can prevent tumor progression based on the above mechanisms. Through identification of our hypothesis, the proposed strategy can be served as a therapeutic option for tumors.
In our study, for identifying suitable cell line and 5-Aza-dC concentration for subsequent experiments, the methylation of PTEN in T-ALL cells was detected, with complete methylation in Jurkat cells. A series of tests were conducted to further investigate the effect of 5-Aza-dC demethylation on biological behaviors of T-ALL cells. As we speculated, intervention through this agent resulted in decreased cell proliferation and cell viability rates, higher apoptosis rate, and cell arrest in the S phase, as well as reduced counts of cells invaded and migrated, suggesting that 5-Aza-dC treatment can significantly alleviate adverse biological behaviors of Jurkat cells, and may, to some extent, enhance cell sensitivity to chemotherapy agents. Furthermore, in our study, as the PTEN gene transitioned to an un-methylated state, we found decreased PTEN mRNA and protein expressions as well. Similarly, we also detected reduced trends in levels of DNMT1, DNMT3a, MBD2, and MeCP2, which are consistent with their functions and suggest their involvement in the process of PTEN gene methylation. It may inspire us that reversing promoter region methylation can re-express silenced tumor suppressor genes.[50] After treatment with 5-Aza-dC, PTEN gene expression was restored, indicating a possible alteration to the un-methylated state. These trends detected were in line with the change trends of cell proliferation, cell viability, apoptosis, cell cycle, invasion, and migration, supporting the positive role of reversed PTEN gene methylation through 5-Aza-dC in tumor suppression. Moreover, significant decreases were detected in PI3K, AKT, and mTOR proteins, suggesting the inactivation of PI3K/AKT signaling by restoring PTEN expression to stimulate its tumor-suppressing function. It further supports the anti-tumor feature of targeting PTEN and PI3K/AKT pathway in T-ALL, as well as their clinical application potentials. In general, the PI3K/AKT pathway can regulate hematopoietic cell growth, proliferation, and viability, which usually dysregulates in acute lymphoblastic leukemia; and PTEN is a common tumor suppressor gene correlated with this signaling pathway, revealing their potentials in leukemia treatment.[51] There have been several reports[52-54] on the potential clinical applications of targeting PTEN and PI3K/AKT pathway in T-ALL treatment. For instance, it was previously acknowledged that a common feature in T-ALL is PTEN deletion and/or PI3K/AKT signaling pathway activation leading to altered cell growth and metabolism,[52] and reversing the aberrant PTEN/PI3K/AKT signaling can be a promising therapeutic option for T-ALL patients. Meanwhile, Bonaccorso et al.[53] and Wang et al.[54] both supported the role of molecular targeting of PTEN and/or PI3K/AKT for pharmacological intervention in T-ALL.
Critically, for further validation of the above interpretations, rescue experiments through PTEN expression silencing and restoration were finally conducted to verify the above results from another side. Consequently, silencing the expression of PTEN reversed the beneficial anti-tumor effect of 5-AzadC, resulting in promoted cell proliferation, increased cell viability, retarded apoptosis, cell cycle arrest in the S phase, accelerated invasion and migration, increased expression levels of methylation-related factors, and PI3K/AKT signaling related proteins. More significantly, PTEN expression restoration enhanced the anti-tumor effect of 5-Aza-dC, and re-inactivated PI3K/AKT signaling to impede tumor growth. Eventually, these data support that demethylation with 5-AzadC to restore PTEN expression can be a promising strategy for intervening the malignant process of T-ALL. Collectively, these findings confirmed our exploration and supported that 5-Aza-dC would be a suitable agent to weaken the methylation of PTEN and restore its anti-tumor activity in T-ALL. This study highlights the synergistic effect of combining 5-Aza-dC with tumor suppressor gene PTEN expression restoration in treating T-ALL. There are other reports revealing the potential synergistic effects of combining 5-Aza-dC with other epigenetic modifiers or targeted therapies in the treatment of leukemia. For example, from the perspective of microRNA methylation (non-coding RNA regulation), Li et al.[55] found that 5-Aza-dC reversed high EVI1-induced hypermethylation of the miR-9 promoter and restored miR-9 expression, inducing extensive apoptosis and cell cycle arrest to prevent cell proliferation. Zhang et al.[56] also discovered the cytotoxic effect of 5-Aza-dC in leukemia cells Jurkat-T, K562, and HL60 through epigenetic reactivation of the DPP4 gene to inhibit cholesterol biosynthesis resultantly in these cells, which may be an underlying mechanism of 5-Aza-dC in exerting anti-tumor activity pharmacologically. Moreover, besides PI3K/AKT signaling, as reported previously, some researchers have also documented signaling pathways or molecular networks that are downstream of PTEN and may be affected by 5-AzadC treatment[57]. In another aggressive cancer of the head and neck squamous cell carcinoma, Borgato et al.[58] observed that loss of PTEN enhanced tumor cell colony- and tumor sphere-forming abilities, and the use of 5-Aza-dC showed an inhibitory effect over its its population of cancer stem cells and molecular markers associated with NF-κB and EMT pathways. Zhao et al.[59] also reported from the aspect of epigenetic modification of chromatin that histone deacetylase 3 inhibitor RGFP966 combined with DNMT inhibitor 5-AzadC restored the expressions of several tumor suppressor genes (e.g., PTEN, STAT1, P16, etc.) and large non-coding RNA tumor suppressor MEG3 in non-functioning pituitary adenoma cells, supporting again the role of targeting DNA methylation from different mechanisms in future therapies. In addition, similarly, Lin et al.[60] also constructed a 5-AzadC-resistant T-ALL cell model to reveal the role of 5-Aza-dC in T-ALL through downregulating DNMT1 and upregulating MMP-2 and MMP-9, while it shall be noted that our study emphasized elaborating the demethylating function of 5-Aza-dC in exerting anti-tumor effect on T-ALL cells, with special attention paid to the loss- and gain-of-function of the tumor suppressor gene PTEN as well as the effects on tumor cell behaviors and PI3K/AKT signaling pathway activation. Notably, Yoshida-Sakai et al.[61] also agreed with the function of DNA demethylating agents in T-ALL cells, but used different agents of azacitidine, decitabine, etc., to uncover that adult T-ALL may acquire resistance to DNA demethylating agents through dysregulation of enzymes involved in pyrimidine metabolism, which may be a new discovery that contradicts the previously observed beneficial effects of DNA demethylating agents and deserves further confirmation.
Despite the above findings, this study still has many limitations that shall be considered cautiously. First, there was a lack of in-depth information on epigenetic modifications induced by 5-Aza-dC (changes in PTEN expression following 5-Aza-dC treatment), such as changes in DNA methylation patterns, histone modifications, and chromatin remodeling. Moreover, additional systematic data should be supplemented on the long-term effects of 5-Aza-dC treatment on T-ALL cell behaviors, such as drug resistance development and relapse potential. Both aspects would enhance the significance of the study. Furthermore, this study put emphasis on several but not so many biomarkers. It would be useful to include more potential biomarkers or predictive markers that could stratify patients for 5-Aza-dC treatment in clinical settings based on the molecular characteristics of their T-ALL. In addition, this study did not take into consideration of any biases in patient selection, sample size, or confounding factors that may have influenced the results.
SUMMARY
In T-ALL, 5-Aza-dC may exert demethylation effect to restore the anti-tumor activity of PTEN gene, resulting in slowed cell proliferation, higher cell apoptosis, cell arrest, inhibited cell invasion and migration, as well as weakened resistance to chemotherapy possibly, which may be related to the inhibited expressions of DNMT1, DNMT3a, MBD2, and MeCP2, and restored expression activity of PTEN to negatively regulate the PI3K/AKT signal transduction. Our further silencing and restoration of PTEN expressions support our findings to some extent, highlighting that demethylation with 5-AzadC to restore the role of tumor suppressor gene PTEN may produce promising therapeutic outcome through appropriate intervention in T-ALL.
AVAILABILITY OF DATA AND MATERIALS
The data analyzed in this study is available from the corresponding author upon reasonable request.
ABBREVIATIONS
T-ALL - T-cell acute lymphoblastic leukemia
5-Aza-dC - 5-Aza-2’-deoxycytidine
PTEN - Phosphatase and tensin homolog deleted on chromosome ten
MS-PCR - Methylation-specific polymerase chain reaction
DNMTs - DNA methyl-transferases
CCK-8 - Cell Counting Kit-8
MTT - Methyl-thiazole-tetrazolium
OD - Optical density
DMSO - Dimethyl sulfoxide
ECL - Enhanced chemiluminescence
GAPDH - Glyceraldehyde-3-phosphate dehydrogenase
FITC - Fluorescein isothiocyanate
CpG - Cytosine-phosphate-guanine
AUTHOR CONTRIBUTIONS
LY: Interpreted the data and wrote the manuscript; JZ and LJ: Designed the study; KX, ZH, LX and CG: Contributed to writing the manuscript. All authors have read and approved the final version of the manuscript. All authors have contributed significantly to the work and has agreed to be responsible for every aspect of it.
ACKNOWLEDGMENT
We would like to thank individuals (such as our research partners, editors and anonymous reviewers) who have contributed substantially to the completion of this study.
ETHICS APPROVAL AND CONSENT TO PARTICIPATE
As this is a cell experiment without patient identifiers, approval from Institutional Review Board is not required at our institution.
CONFLICT OF INTEREST
The authors declare no conflict of interest.
EDITORIAL/PEER REVIEW
To ensure the integrity and highest quality of CytoJournal publications, the review process of this manuscript was conducted under a double-blind model (authors are blinded for reviewers and vice versa) through an automatic online system.
FUNDING
Not applicable.
References
- TP53 in acute myeloid leukemia: Molecular aspects and patterns of mutation. Int J Mol Sci. 2021;22:10782-99.
- [CrossRef] [Google Scholar]
- T-Cell acute lymphoblastic leukemia: Biomarkers and their clinical usefulness. Genes (Basel). 2021;12:1118-37.
- [CrossRef] [Google Scholar]
- T-cell acute lymphoblastic leukemia: Promising experimental drugs in clinical development. Expert Opin Investig Drugs. 2023;32:37-52.
- [CrossRef] [Google Scholar]
- Silencing LCN2 enhances RSL3-induced ferroptosis in T cell acute lymphoblastic leukemia. Gene. 2023;879:147597.
- [CrossRef] [Google Scholar]
- Clinical and biological correlates of neurotoxicity associated with CAR T-cell therapy in patients with B-cell acute lymphoblastic leukemia. Cancer Discov. 2018;8:958-71.
- [CrossRef] [Google Scholar]
- CAR T cells with dual targeting of CD19 and CD22 in pediatric and young adult patients with relapsed or refractory B cell acute lymphoblastic leukemia: A phase 1 trial. Nat Med. 2021;27:1797-805.
- [CrossRef] [Google Scholar]
- Relapsed T cell all: Current approaches and new directions. Curr Hematol Malig Rep. 2019;14:83-93.
- [CrossRef] [Google Scholar]
- Outcome of allogeneic hematopoietic stem cell transplantation for T-cell lymphoblastic leukemia/lymphoma: A single-center study. Leuk Res. 2021;108:106627.
- [CrossRef] [Google Scholar]
- Effect of P2X7 receptor on tumorigenesis and its pharmacological properties. Biomed Pharmacother. 2020;125:109844.
- [CrossRef] [Google Scholar]
- Epigenetic alterations in cancer. Front Biosci (Landmark Ed). 2020;25:1058-109.
- [CrossRef] [Google Scholar]
- Metabolic reprogramming and epigenetic modifications on the path to cancer. Protein Cell. 2022;13:877-919.
- [CrossRef] [Google Scholar]
- Genetic and epigenetic defects of the RNA modification machinery in cancer. Trends Genet. 2023;39:74-88.
- [CrossRef] [Google Scholar]
- DNA methylation at the crossroads of gene and environment interactions. Essays Biochem. 2019;63:717-26.
- [CrossRef] [Google Scholar]
- Pan-cancer landscape of aberrant DNA methylation across human tumors. Cell Rep. 2018;25:1066-80.e8.
- [CrossRef] [Google Scholar]
- Navigating the DNA methylation landscape of cancer. Trends Genet. 2021;37:1012-27.
- [CrossRef] [Google Scholar]
- DNA methylation profiling: An emerging paradigm for cancer diagnosis. Annu Rev Pathol. 2022;17:295-321.
- [CrossRef] [Google Scholar]
- Prediction of DNA methylation in the promoter of gene suppressor tumor. Gene. 2018;651:166-73.
- [CrossRef] [Google Scholar]
- The functions and regulation of the PTEN tumour suppressor: New modes and prospects. Nat Rev Mol Cell Biol. 2018;19:547-62.
- [CrossRef] [Google Scholar]
- circACTR2 attenuates gemcitabine chemoresiatance in pancreatic cancer through PTEN mediated PI3K/AKT signaling pathway. Biol Direct. 2023;18:14-26.
- [CrossRef] [Google Scholar]
- PTEN negatively regulates MAPK signaling during Caenorhabditis elegans vulval development. PLoS Genet. 2012;8:e1002881.
- [CrossRef] [Google Scholar]
- PTEN and SHIP: Impact on lymphatic metastasis in breast cancer. J Cancer Res Ther. 2018;14:S937-41.
- [CrossRef] [Google Scholar]
- Immune checkpoint B7-H3 is a therapeutic vulnerability in prostate cancer harboring PTEN and TP53 deficiencies. Sci Transl Med. 2023;15:eadf6724.
- [CrossRef] [Google Scholar]
- Cancer-associated fibroblast-derived exosomal microRNA-20a suppresses the PTEN/PI3K-AKT pathway to promote the progression and chemoresistance of non-small cell lung cancer. Clin Transl Med. 2022;12:e989.
- [CrossRef] [Google Scholar]
- Resveratrol reverses doxorubicin resistance by inhibiting epithelial-mesenchymal transition (EMT) through modulating PTEN/Akt signaling pathway in gastric cancer. J Exp Clin Cancer Res. 2017;36:19.
- [CrossRef] [Google Scholar]
- DNA methyltransferase inhibitors and their therapeutic potential. Curr Top Med Chem. 2018;18:2448-57.
- [CrossRef] [Google Scholar]
- Resistance to hypomethylating agents in myelodysplastic syndrome and acute myeloid leukemia from clinical data and molecular mechanism. Front Oncol. 2021;11:706030.
- [CrossRef] [Google Scholar]
- Down-regulation of p16 and MGMT promotes the anti-proliferative and pro-apoptotic effects of 5-Aza-dC and radiation on cervical cancer cells. Cell Biochem Funct. 2017;35:488-96.
- [CrossRef] [Google Scholar]
- Epigenetic modifiers 5-aza-2'-deoxycytidine and valproic acid differentially change viability, DNA damage and gene expression in metastatic and non-metastatic colon cancer cell lines. Acta Biochim Pol. 2019;66:355-60.
- [CrossRef] [Google Scholar]
- 5-AZA-dC induces epigenetic changes associated with modified glycosylation of secreted glycoproteins and increased EMT and migration in chemo-sensitive cancer cells. Clin Epigenetics. 2021;13:34-49.
- [CrossRef] [Google Scholar]
- HOTAIR suppresses PTEN via DNMT3b and confers drug resistance in acute myeloid leukemia. Hematology. 2021;26:170-8.
- [CrossRef] [Google Scholar]
- Histological evidence: housekeeping genes beta-actin and GAPDH are of limited value for normalization of gene expression. Dev Genes Evol. 2012;222:369-76.
- [CrossRef] [Google Scholar]
- Foxo3a-mediated DNMT3B impedes cervical cancer cell proliferation and migration capacities through suppressing PTEN promoter methylation. J Invest Surg. 2023;36:2162170.
- [CrossRef] [Google Scholar]
- The role of methylation in the CpG island of the ARHI promoter region in cancers. Adv Exp Med Biol. 2020;1255:123-32.
- [CrossRef] [Google Scholar]
- Methylation of tumour suppressor genes in benign and malignant salivary gland tumours: A systematic review and meta-analysis. Epigenetics. 2022;17:1661-76.
- [CrossRef] [Google Scholar]
- Epigenetic dysregulation in autoimmune and inflammatory skin diseases. Clin Rev Allergy Immunol. 2022;63:447-71.
- [CrossRef] [Google Scholar]
- Induction of senescence in cancer cells by 5'-Aza-2'-deoxycytidine: Bioinformatics and experimental insights to its targets. Comput Biol Chem. 2017;70:49-55.
- [CrossRef] [Google Scholar]
- Oncogenic roles and inhibitors of DNMT1, DNMT3A, and DNMT3B in acute myeloid leukaemia. Biomark Insights. 2019;14:1-12.
- [CrossRef] [Google Scholar]
- Genes controlled by DNA methylation are involved in Wilms tumor progression. Cells. 2019;8:921-35.
- [CrossRef] [Google Scholar]
- Pan-cancer analysis of oncogenic TNFAIP2 identifying its prognostic value and immunological function in acute myeloid leukemia. BMC Cancer. 2022;22:1068-83.
- [CrossRef] [Google Scholar]
- DNA looping by two 5-methylcytosine-binding proteins quantified using nanofluidic devices. Epigenetics Chromatin. 2020;13:18-27.
- [CrossRef] [Google Scholar]
- Direct homo-and hetero-interactions of MeCP2 and MBD2. PLoS One. 2013;8:e53730.
- [CrossRef] [Google Scholar]
- Deletion of MBD2 inhibits proliferation of chronic myeloid leukaemia blast phase cells. Cancer Biol Ther. 2018;19:676-86.
- [CrossRef] [Google Scholar]
- Dose-dependent nuclear delivery and transcriptional repression with a cell-penetrant MeCP2. ACS Cent Sci. 2023;9:277-88.
- [CrossRef] [Google Scholar]
- Histone demethylase RBP2 mediates the blast crisis of chronic myeloid leukemia through an RBP2/PTEN/BCR-ABL cascade. Cell Signal. 2019;63:109360.
- [CrossRef] [Google Scholar]
- The role of DNAdemethylating agents in cancer therapy. Pharmacol Ther. 2020;205:107416.
- [CrossRef] [Google Scholar]
- Thymoquinone inhibits growth of acute myeloid leukemia cells through reversal SHP-1 and SOCS-3 hypermethylation: In vitro and in silico evaluation. Pharmaceuticals (Basel). 2021;14:1287-307.
- [CrossRef] [Google Scholar]
- Positive effects of PI3K/Akt signaling inhibition on PTEN and P53 in prevention of acute lymphoblastic leukemia tumor cells. Adv Pharm Bull. 2019;9:470-80.
- [CrossRef] [Google Scholar]
- PTEN/PI3K/Akt pathway alters sensitivity of T-cell acute lymphoblastic leukemia to L-asparaginase. Sci Rep. 2022;12:4043-52.
- [CrossRef] [Google Scholar]
- Single-cell profiling of pediatric T-cell acute lymphoblastic leukemia: Impact of PTEN exon 7 mutation on PI3K/Akt and JAK-STAT signaling pathways. Cytometry B Clin Cytom. 2020;98:491-503.
- [CrossRef] [Google Scholar]
- Marsdenia tenacissimae extraction (MTE) inhibits the proliferation and induces the apoptosis of human acute T cell leukemia cells through inactivating PI3K/AKT/mTOR signaling pathway via PTEN enhancement. Oncotarget. 2016;7:82851-63.
- [CrossRef] [Google Scholar]
- Myeloid leukemia with high EVI1 expression is sensitive to 5-aza-2'-deoxycytidine by targeting miR-9. Clin Transl Oncol. 2020;22:137-43.
- [CrossRef] [Google Scholar]
- 5-Aza-2'-deoxycytidine induced growth inhibition of leukemia cells through modulating endogenous cholesterol biosynthesis. Mol Cell Proteomics. 2012;11:M111.016915.
- [CrossRef] [Google Scholar]
- Effect of STAT3 mediated epigenetic regulation in preeclampsia: an analysis of trial data. Eur Rev Med Pharmacol Sci. 2020;24:5843-55.
- [Google Scholar]
- Loss of PTEN sensitizes head and neck squamous cell carcinoma to 5-AZA-2'-deoxycytidine. Oral Surg Oral Med Oral Pathol Oral Radiol. 2020;130:181-90.
- [CrossRef] [Google Scholar]
- High histone deacetylase 2/3 expression in nonfunctioning pituitary tumors. Front Oncol. 2022;12:875122.
- [CrossRef] [Google Scholar]
- 5-Aza-dC promotes T-cell acute lymphoblastic leukemia cell invasion via downregulation of DNMT1 and upregulation of MMP-2 and MMP-9. Exp Hematol. 2022;114:43-53.e2.
- [CrossRef] [Google Scholar]
- Adult T-cell leukemia-lymphoma acquires resistance to DNA demethylating agents through dysregulation of enzymes involved in pyrimidine metabolism. Int J Cancer. 2022;150:1184-97.
- [CrossRef] [Google Scholar]