


Translate this page into:
Ankyrin repeat domain 1 is dysregulated in keloids and suppresses keloid fibroblast growth, migration, and extracellular matrix deposition

*Corresponding author: Jingrong Li, Department of Dermatology, Guangzhou First People’s Hospital, Guangzhou, China. lili661018@126.com
-
Received: ,
Accepted: ,
How to cite this article: Wu W, Si Y, Yang J, Wen L, Li J. Ankyrin repeat domain 1 is dysregulated in keloids and suppresses keloid fibroblast growth, migration, and extracellular matrix deposition. CytoJournal. 2025;22:17. doi: 10.25259/Cytojournal_111_2024
Abstract
Objective
The etiology and specific pathological mechanisms of keloids remain elusive. Array expression profiling has revealed dysregulation of the transcription cofactor ankyrin repeat domain 1 (ANKRD1) in keloid fibroblasts. The present study focused on examining the expression pattern of ANKRD1 in keloids and assessing its function in human keloid fibroblasts (HKFs).
Material and Methods
Differential mRNA expression profiles in keloid fibroblasts were investigated by analyzing data from gene expression omnibus (GEO) datasets. Immunohistochemistry assays were performed to verify the expression patterns of ANKRD1 and claudin 11 (CLDN11) in keloid tissue samples. Functional studies were conducted by transfecting HKFs with either a small interfering RNA (siRNA) targeting ANKRD1 (siANKRD1) or ANKRD1-overexpressing plasmids. The functional impact of ANKRD1 was assessed using cell proliferation, flow cytometry, and Transwell migration assays. mRNA expression was evaluated using reverse transcription polymerase chain reaction, and protein expression was determined using Western blotting.
Results
Analysis of the GEO series (GSE) GSE44270 revealed eight differentially expressed mRNAs, with ANKRD1 and CLDN11 being the top two downregulated mRNAs. ANKRD1 expression was observed to be lower in keloid tissues than in normal skin tissues, whereas CLDN11 expression showed no significant difference between the two groups. ANKRD1 overexpression suppressed HKF proliferation, migration, and the expression levels of collagen I, fibronectin, matrix metallopeptidase 9, whereas the opposite effects were observed on ANKRD1 knockdown. ANKRD1 did not affect apoptotic cell levels.
Conclusion
ANKRD1 is downregulated in keloids and inhibits the growth, migration, and extracellular matrix deposition of keloid fibroblasts. Thus, ANKRD1 may function as a suppressor in keloid formation.
Keywords
Ankyrin repeat domain 1
Extracellular matrix
Fibroblasts
Keloid

INTRODUCTION
Keloids, one type of pathological scar, are a common and frequently occurring condition in dermatology.[1] Keloids are typically not limited to the original site of the wound but extend to the surrounding skin and may even form raised and hard nodules.[2] The color of keloids is usually red or purple, and they are often accompanied by pain and pruritus.[2] This can cause pessimism, negative emotions, and diminished life satisfaction, thus warranting active interventions. Multiple treatments exist for keloids, including surgical procedures, laser therapy, fat grafting, medication, physical therapy, and radiation therapy.[2,3] However, the formation and treatment of keloids pose complexities, with a complete cure being unattainable for most patients and a high likelihood of post-treatment recurrence, substantially affecting patients’ well-being and psychological state.
The pathological features of keloids include heightened fibroblast proliferation, reduced apoptosis, increased accumulation of the extracellular matrix (ECM), inflammatory cell infiltration, and upregulated expression of growth factors, collagen and matrix metalloproteinases (MMP).[4,5] However, the etiology and specific pathological mechanisms underlying keloids remain elusive, with studies suggesting the involvement of various factors, including genetic susceptibility, epigenetics, dysregulated cytokine signaling, immune-inflammatory responses, and mechanical stress.[6-8] Therefore, further investigation is imperative to elucidate the intricate mechanisms of keloid formation and to lay the theoretical groundwork for more efficacious treatment modalities.
Fibroblasts are crucial in directing the production and restructuring of the ECM, which is essential for wound healing.[9] After skin injury, a reparative cascade is initiated through coordinated cellular interactions.[10] During this phase, dermal fibroblasts proliferate, migrate to the wound site, become activated, synthesize ECM components, and facilitate wound bed restructuring.[10] However, if fibroblasts become hyperactivated and apoptosis is reduced during the later stages of injury repair, this can result in skin tissue fibrosis, leading to scar formation.[7,10] Despite some understanding of the involvement of fibroblasts in scar formation and development, the precise underlying molecular mechanisms remain elusive.
In this study, we aimed to explore the differentially expressed genes (DEGs) in keloid fibroblasts from the gene expression omnibus (GEO) database using bioinformatics and to analyze the function of the candidate gene in human keloid fibroblasts (HKFs). Ankyrin repeat domain 1 (ANKRD1), also known as cytokine-inducible gene C-193 protein, was the candidate gene. It is a transcriptional cofactor expressed in muscle and endothelial cells.[11,12] ANKRD1 is associated with various conditions, including muscular dystrophy, eczema herpeticum, and cancers.[13-15] Its expression is induced by interleukin 1 and tumor necrosis factor-alpha and is associated with immune responses to viruses and immune infiltration.[13,16] In addition, ANKRD1 levels increase in response to wounding and tissue injury and are linked to dermal fibroblast dysfunction.[17] High ANKRD1 expression correlates with poor survival in patients with ovarian carcinoma.[18] Analysis of The Cancer Genome Atlas (TCGA) database showed that ANKRD1 mRNA expression serves as an independent prognostic factor in several cancers, including colon adenocarcinoma, glioblastoma multiforme, lung squamous cell carcinoma, neck squamous cell carcinoma, and stomach adenocarcinoma.[14] The role of ANKRD1 in keloids remains unclear. In this study, we explored the expression of ANKRD1 in keloids and its impact on cell proliferation, apoptosis, migration, and the expression of ECM-related proteins in HKFs.
MATERIAL AND METHODS
Analysis of differentially expressed mRNA in keloid fibroblast using GEO datasets
The GEO dataset (accession: GSE44270) was used to identify differentially expressed mRNAs in keloid fibroblasts through GEO2R analysis. The keloid fibroblast group included samples from nine keloid scars (GSM1081590, GSM1081586, GSM1081589, GSM1081582, GSM1081584, GSM1081583, GSM1081588, GSM1081585, and GSM1081587). The nonlesional fibroblast group comprised samples from four nonlesional areas of individuals with keloid scars (GSM1081600, GSM1081601, GSM1081602, and GSM1081603). The normal fibroblast group comprised samples from three normal skin areas (GSM1081608, GSM1081609, and GSM1081610). Differentially expressed mRNAs in keloid fibroblasts were identified using either the non-lesional fibroblast group or the normal fibroblast group as a control. The intersection(s) of the two lists of differentially expressed mRNAs were identified using an online Venn diagram tool (http://bioinformatics.psb.ugent.be/webtools/Venn/).
Specimens
Keloid tissues were collected during surgeries performed at The Fourth Affiliated Hospital, Guangzhou Medical University between January 2022 and June 2023. The inclusion criteria were as follows: (1) meeting the diagnostic standards for keloids, characterized by visible lesions extending beyond the original incision, with edges displaying crab-like swelling, a pink or purplish hue, firmness on palpation, and lack of elasticity; (2) post-operative histopathology confirming keloid features, such as abundant fibroblasts, eosinophilic hyaline-like collagen fibers, and irregularly arranged collagen fibers forming whirlpool-like patterns with distinct boundaries from surrounding skin; and (3) complete preservation of clinical samples. The exclusion criteria were as follows: (1) prior treatment with medications, laser therapy, or radiation; (2) concurrent malignancies, immune dysfunction, or blood disorders; and (3) other concurrent skin ailments. Normal skin tissue was also obtained during dermatological surgeries for comparison. The study comprised 55 patients with keloids, including 28 males and 27 females aged 20–56 years. In addition, 75 patients with normal skin tissue were enrolled, including 40 males and 35 females. No significant differences were observed in demographic characteristics between the two groups. All participants provided written informed consent, and the study was approved by the Research Ethics Committee of The Fourth Affiliated Hospital, Guangzhou Medical University (Ethics approval number: 2024-H-006). This study was conducted in accordance with the Declaration of Helsinki.
Immunohistochemistry (IHC)
Paraffin-embedded keloid tissues (n = 30) and normal skin tissues (n = 20) were sectioned into 4-µm slices. After deparaffinization and rehydration, antigen retrieval was performed using citrate antigen retrieval solution (P0081; Beyotime, Shanghai, China). Endogenous peroxidase activity was inhibited by treating the slides with 3% hydrogen peroxide (KD10-GR-0.5L; Guangzhou Chemical Reagent Factory, Guangzhou, China) for 15 min. After washing the sections thrice with distilled water for 5 min each time, 3% bovine serum albumin (ST2249; Beyotime, Shanghai, China) was used to block each section. Following three additional washes with phosphate buffer saline (PBS, ST447-1L; Beyotime, Shanghai, China) for 5 min each, the sections were incubated overnight at 4°C with diluted primary antibodies (anti-ANKRD1 antibody, ab247009; Abcam, Cambridge, MA, USA, 1:1000 and anti-claudin 11 (CLDN11) antibody, AF5364; Affinity Biosciences, Cincinnati, OH, USA, 1:800). The next day, the sections were washed with PBS as described previously and incubated with horseradish peroxidase (HRP)-conjugated goat anti-rabbit immunoglobulin G (IgG) (H+L) (A0208; Beyotime, Shanghai, China, 1:50) at 20–25°C for 50 min. Following an additional PBS wash, the sections were incubated with freshly prepared 3, 3'-diaminobenzidine tetrachloride chromogen solution (P0203; Beyotime, Shanghai, China). The sections were rinsed with tap water to stop the chromogen reaction once positive brownish-yellow signals were observed. Finally, the sections were dehydrated and mounted using a glycerol jelly mounting medium (C0187; Beyotime, Shanghai, China). Quantitative analysis of IHC staining results was performed using Image J software (version: 1.8.0; Media Cybernetics, Rockville, MD, USA) and its IHC Profiler plugin. The proportions of positive cells at different staining intensities were measured and scored (negative: 0 points; weak positive: 1 point; moderate positive: 2 points; and strong positive: 3 points). The histochemistry score (H-score) was calculated using the following formula: H-score = (0 × P0) + (1 × P1) + (2 × P2) + (3 × P3), where Pn represents the proportion of positive cells corresponding to each staining intensity level (expressed as a percentage).
Small interfering RNA (siRNA) targeting ANKRD1 (siANKRD1)
Three siANKRD1s were synthesized by RiboBio Co., Ltd (Guangzhou, China): siANKRD1-1 (product number: stB0010745A; target sequence: CGATGGATCTGGTGCTACA), siANKRD1-2 (product number: stB0010745B; target sequence: GTTGCATGATGCGGTGAGA), and siANKRD1-3 (product number: stB0010745C; target sequence: GAATGGAACCAAAGCAATA).
Plasmid overexpressing ANKRD1
The coding sequence of ANKRD1 was amplified using polymerase chain reaction (PCR) with primers ANKRD1-BamH I (5'-cgcggatccgccaccATGATGGTACTGAAAG TAGAGGAACTGG-3') and ANKRD1-XhoI (5' -ccgctcgagTCAGAATGTAGCTATGCGAGAGG TCTTGTA-3'). The PCR amplification products and plasmid pcDNA3.1(+) (V79020; Invitrogen, Carlsbad, CA, USA) were cut using BamHI (1010S; TaKaRa, Dalian, China) and XhoI (1094S; TaKaRa, Dalian, China). After purification, the PCR products were ligated with pcDNA3.1 using T4 DNA Ligase (2011A; TaKaRa, Dalian, China). Following transformation into DH5α-competent Escherichia coli (D1031S; Beyotime, Shanghai, China), the recombinant plasmid was verified using double digestion and was named pcDNA-ANKRD1.
Cell culture and experimental groups
HKFs were purchased from Hunan Fenghui Biotechnology Co. Ltd. (FHHUM184; Changsha, China). This cell line was assessed for mycoplasma contamination and underwent short tandem repeat profiling. The culture medium consisted of 87.5% Dulbecco’s Modified Eagle Medium/Nutrient Mixture F-12 (11320033; Thermo Fisher Scientific, Waltham, MA, USA), 10% fetal bovine serum (A5670701; Gibco, Carlsbad, CA, USA), 1.5% GlutaMAX-1 (35050061; Thermo Fisher Scientific, Waltham, MA, USA), 5 ng/mL recombinant human basic fibroblast growth factor (13256–029; Gibco, Carlsbad, CA, USA), 50 µg/mL Vitamin C (HY-B0166; MedChemExpress, New Jersey, NJ, USA), 1 µg/mL hydrocortisone (HY-N0583; MedChemExpress), 5 µg/mL recombinant human insulin (40112ES25; YEASEN, Shanghai, China), and 1% streptomycin and penicillin (15140122; Thermo Fisher Scientific, Waltham, MA, USA). Cells were cultured at 37℃ in 5% CO2. To investigate the effect of ANKRD1 on HKFs, cells were transfected with negative control siRNA (siNC), siANKRD1, pcDNA3.1, or pcDNA-ANKRD1.
Quantitative reverse transcription PCR (qRT-PCR)
Total RNA from keloids (n = 33), normal skin tissue (n = 55), and cell samples from each group was isolated using TRIzol (15596026CN; Invitrogen, Carlsbad, CA, USA). qRT-PCR was performed using the method described in our previous study.[19] The primer sequences for ANKRD1 were as follows: 5'-GAGTGCGCGGAGCATCTTAT-3' (forward) and 5'-TTGAGATCCGCGCCATACA-3' (reverse). The primer sequences for the reference gene, human 18S rRNA, were as follows: 5'-CCTGGATACCGCAGCTAGGA-3' (forward) and 5'-GCGGCGCAATACGAATGCCCC-3' (reverse). The relative expression level of ANKRD1 was calculated using the 2-ΔΔCt method.
Western blotting
After transfection for 48 h, cell samples were collected and lysed using radioimmunoprecipitation assay lysis buffer (P0013B; Beyotime, Shanghai, China). The protein concentration was measured using bicinchoninic acid protein concentration assay kit (P0012; Beyotime, Shanghai, China), and 30 µg of protein was loaded based on the principle of equal total protein. Sodium dodecyl sulfatepolyacrylamide gel electrophoresis was performed using a 10% separating gel. Following electrophoresis, wet transfer was conducted at 300 mA for 40 min. The membrane was then blocked with a 5% non-fat milk solution at 37°C for 1 h. Thereafter, the membrane was washed once with tris-buffered saline with Tween (TBST) for 5 min and incubation with primary antibodies – anti-ANKRD1 (1:2000; ab247009; Abcam, Cambridge, MA, USA), anti-collagen I (1:1000; ab270993; Abcam, Cambridge, MA, USA), anti-fibronectin (FN, 1:1000; ab268021; Abcam, Cambridge, MA, USA), anti-MMP9 (1:1000, ab137867, Abcam, Cambridge, MA, USA), or anti-glyceraldehyde-3-phosphate dehydrogenase (GAPDH, 1:3000; ab9485; Abcam, Cambridge, MA, USA) – was performed at 37°C for 1 h. The membrane was washed thrice with TBST for 10 min each time and then incubated with HRP-conjugated goat anti-rabbit IgG secondary antibody (1:10000; 4030–05; Southern Biotech, Birmingham, AL, USA) at 37°C for 1 h. Following this, the membrane was washed three more times with TBST for 10 min each time. Finally, Pierce™ Enhanced Chemiluminescence plus Western Blotting Substrate (32134; Thermo Fisher Scientific, Waltham, MA, USA) was used for chemiluminescence, and the signals were exposed to X-ray in a dark room.
Cell proliferation assay
After transfection, 5000 cells in 100 µL of culture medium were seeded into a 96-well plate. The plates were incubated at 37°C in 5% CO2 for 0, 24, 48, and 72 h. Following incubation, the old medium was replaced with 100 µL of new medium containing 10% cell counting kit-8 solution (C0038; Beyotime, Shanghai, China), and the plates were incubated for 2 h. Absorbance (OD) at 450 nm was then measured using a microplate reader (Multiscan MK3; Thermo Fisher Scientific, Waltham, MA, USA).
Measurement of apoptotic cell rate
Becton, Dickinson and Company (BD) Pharmingen™ fluorescein isothiocyanate (FITC) Annexin V Apoptosis Detection Kit I (556547; BD Biosciences, San Diego, CA, USA) was used to measure apoptotic cells. After 24 h of transfection, cells were digested with 0.25% trypsin, collected by centrifugation, and resuspended in 300 µL PBS. After centrifugation at 1000 rpm for 5 min, the cells were resuspended in 50 µL binding buffer with Annexin V-FITC (2.5 µL) and propidium iodide (2.5 µL). After mixing, the tubes were incubated in the dark at 20–25°C for 15 min. The samples were then centrifuged again, resuspended in 300 µL binding buffer, and analyzed for apoptotic cells using a Fluorescence-Activated Cell Sorting (FACS ) Canto II Flow Cytometer (BD Bioscience, San Diego, CA, USA). Data were analyzed using BD FACSDiva software version 8.0.
Transwell migration assay
After 24 h of transfection, 3 × 10⁴ HKFs transfected with siNC, siANKRD1, pcDNA3.1, and pcDNA-ANKRD1 in 200 µL serum-free medium were plated on a filter membrane in a Transwell insert (CLS3422; Corning, NY, USA) with 600 µL complete medium added to the lower chamber of a 24-well plate. The cells were incubated at 37°C in 5% CO2 for 24 h. After removing the medium and non-migrated cells from the top of the membrane, the cells in the upper chamber were fixed with 4% paraformaldehyde (P0099–100 mL; Beyotime, Shanghai, China), stained with crystal violet (C0121–100 mL; Beyotime, Shanghai, China) for 10 min, rinsed 3 times with PBS, and air-dried. Images were captured under a microscope, and migrated cells were counted using Image Pro-Plus software (version 6.0, Media Cybernetics, Rockville, MD, USA).
Scratch assay
Horizontal lines were drawn on the back of a six-well plate using a marker and ruler, spaced 0.5–1 cm apart, with at least five lines crossing each well. Approximately 6 × 10⁵ HKFs, transfected with siNC, siANKRD1, pcDNA3.1, and pcDNA-ANKRD1, were seeded into each well. The next day, vertical scratches were made with a sterilized 20 µL pipette tip, intersecting the marked lines. The wells were washed 3 times with sterile PBS to remove scratched cells, leaving visible gaps. Fresh serum-free medium was added, and the cells were incubated at 37°C with 5% CO2. After 24 h, the cells were observed using a microscope and photographed. Scratch areas were measured using Image J software, and the wound healing percentages were calculated using the following formula: Wound Healing Percentage = (scratch area at time 0 − scratch area at 24 h)/scratch area at time 0 × 100%.
Statistical analysis
GraphPad Prism version 9.0 (GraphPad software, San Diego, CA, USA) was used for statistical analyses. Data in the bar graph are shown as mean ± standard deviation. An unpaired t-test was used to analyze the statistical difference between the two groups, while a one-way analysis of variance was used to assess the statistical differences among more than two groups. P < 0.05 was considered statistically significant.
RESULTS
Differentially expressed mRNA in keloid fibroblast
To identify key regulatory genes involved in keloid formation, we analyzed DEGs in keloid fibroblasts using the GSE44270 dataset. Using the non-lesional fibroblast group as a control, 17 DEGs were identified in keloid fibroblasts, while 47 DEGs were identified when using the normal fibroblast group as a control [Figure 1a and b]. Venn analysis revealed eight common DEGs between the two lists [Figure 1c], and their details are summarized in Table 1. The two most downregulated genes were ANKRD1 and CLDN11, suggesting that these genes play a significant role in regulating keloid fibroblast activity.
| Genes | Log (fold change) | |
|---|---|---|
| a | b | |
| Glutathione peroxidase 7 | 0.70 | 0.76 |
| T-box transcription factor 20 | −0.63 | −0.67 |
| Tetratricopeptide repeat domain 38 | −0.73 | −0.98 |
| Thy-1 cell surface antigen | −0.76 | −0.86 |
| Diacylglycerol kinase iota | −0.95 | −1.12 |
| Copine 7 | −1.17 | −1.35 |
| Claudin 11 | −5.25 | −6.86 |
| Ankyrin repeat domain 1 | −6.70 | −6.70 |
a: Log (fold change) in differentially expressed mRNAs in keloid fibroblasts compared with that of fibroblasts from non-lesional samples in individuals with keloid scars; b: Log (fold change) in differentially expressed mRNAs in keloid fibroblasts compared with that of fibroblasts from individuals without keloid scars
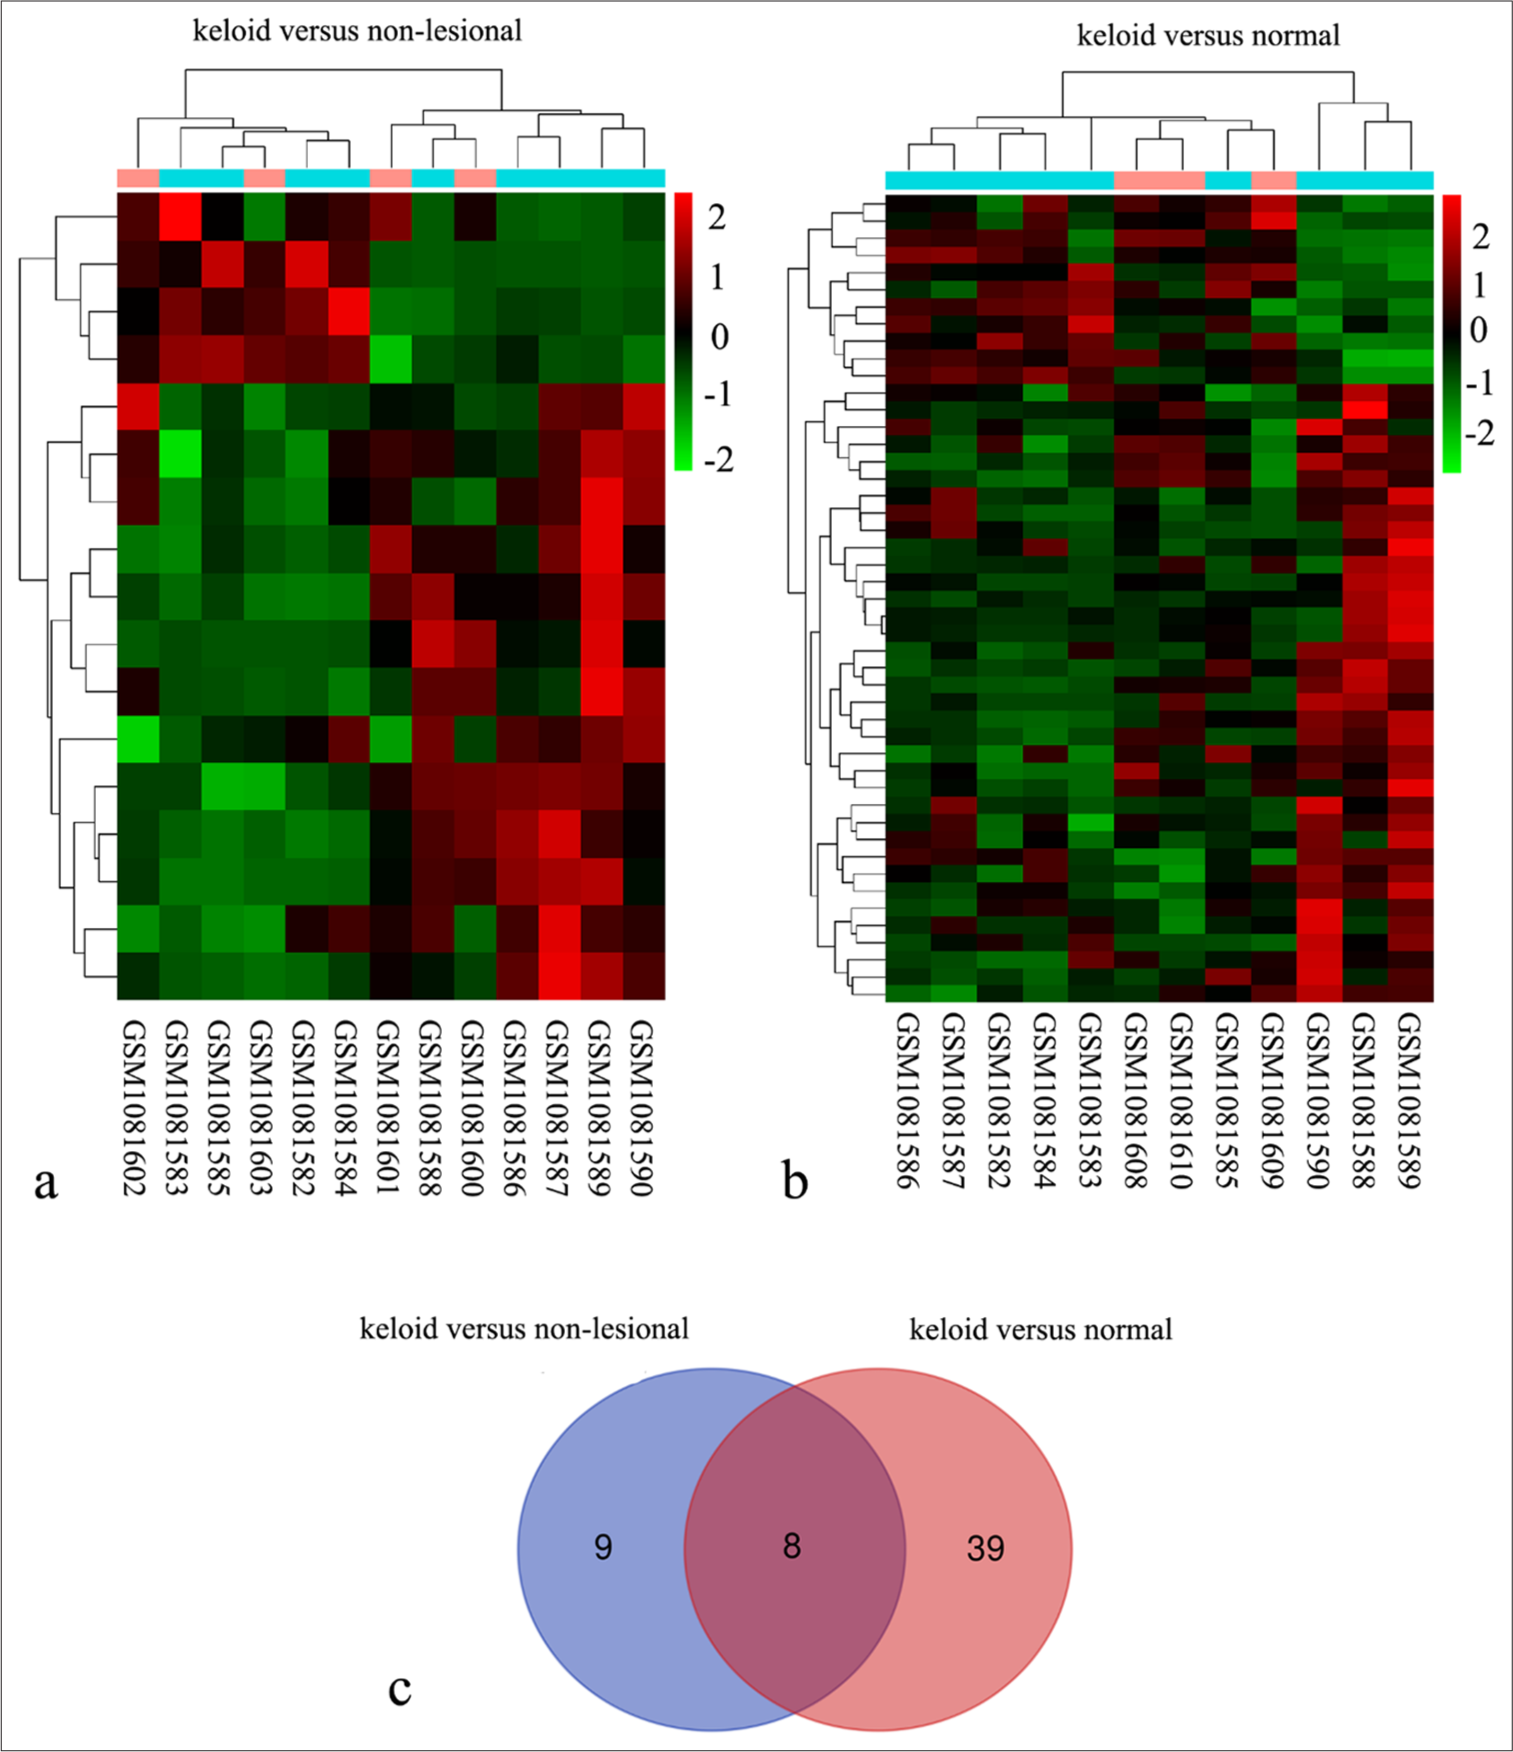
- Identification of eight differentially expressed genes (DEGs) in keloid fibroblasts using the GSE44270 dataset. (a) Heat map comparing nine keloid fibroblast samples from keloid scars (GSM1081590, GSM1081586, GSM1081589, GSM1081582, GSM1081584, GSM1081583, GSM1081588, GSM1081585, and GSM1081587) with four fibroblast samples from non-lesional areas of keloid scar patients (GSM1081600, GSM1081601, GSM1081602, and GSM1081603). (b) Heat map comparing the same nine keloid fibroblast samples with three normal fibroblast samples from healthy skin (GSM1081608, GSM1081609, and GSM1081610). (c) Venn analysis revealed eight common DEGs identified between two comparisons: Keloid versus non-lesional and keloid versus normal.
ANKRD1 and CLDN11 expression level in keloid tissues
To verify the expression profile of ANKRD1 and CLDN11, IHC was performed to detect their expression levels in 30 keloid tissues and 20 normal skin tissues. As shown in Figure 2a-c, ANKRD1 expression levels were reduced in keloid tissues compared with those in normal skin tissues, whereas CLDN11 expression levels did not significantly differ between the two groups. Furthermore, ANKRD1 mRNA expression was significantly lower in keloid tissues than in normal skin tissues [Figure 2d]. These findings prompted us to analyze the role of ANKRD1 in HKFs.
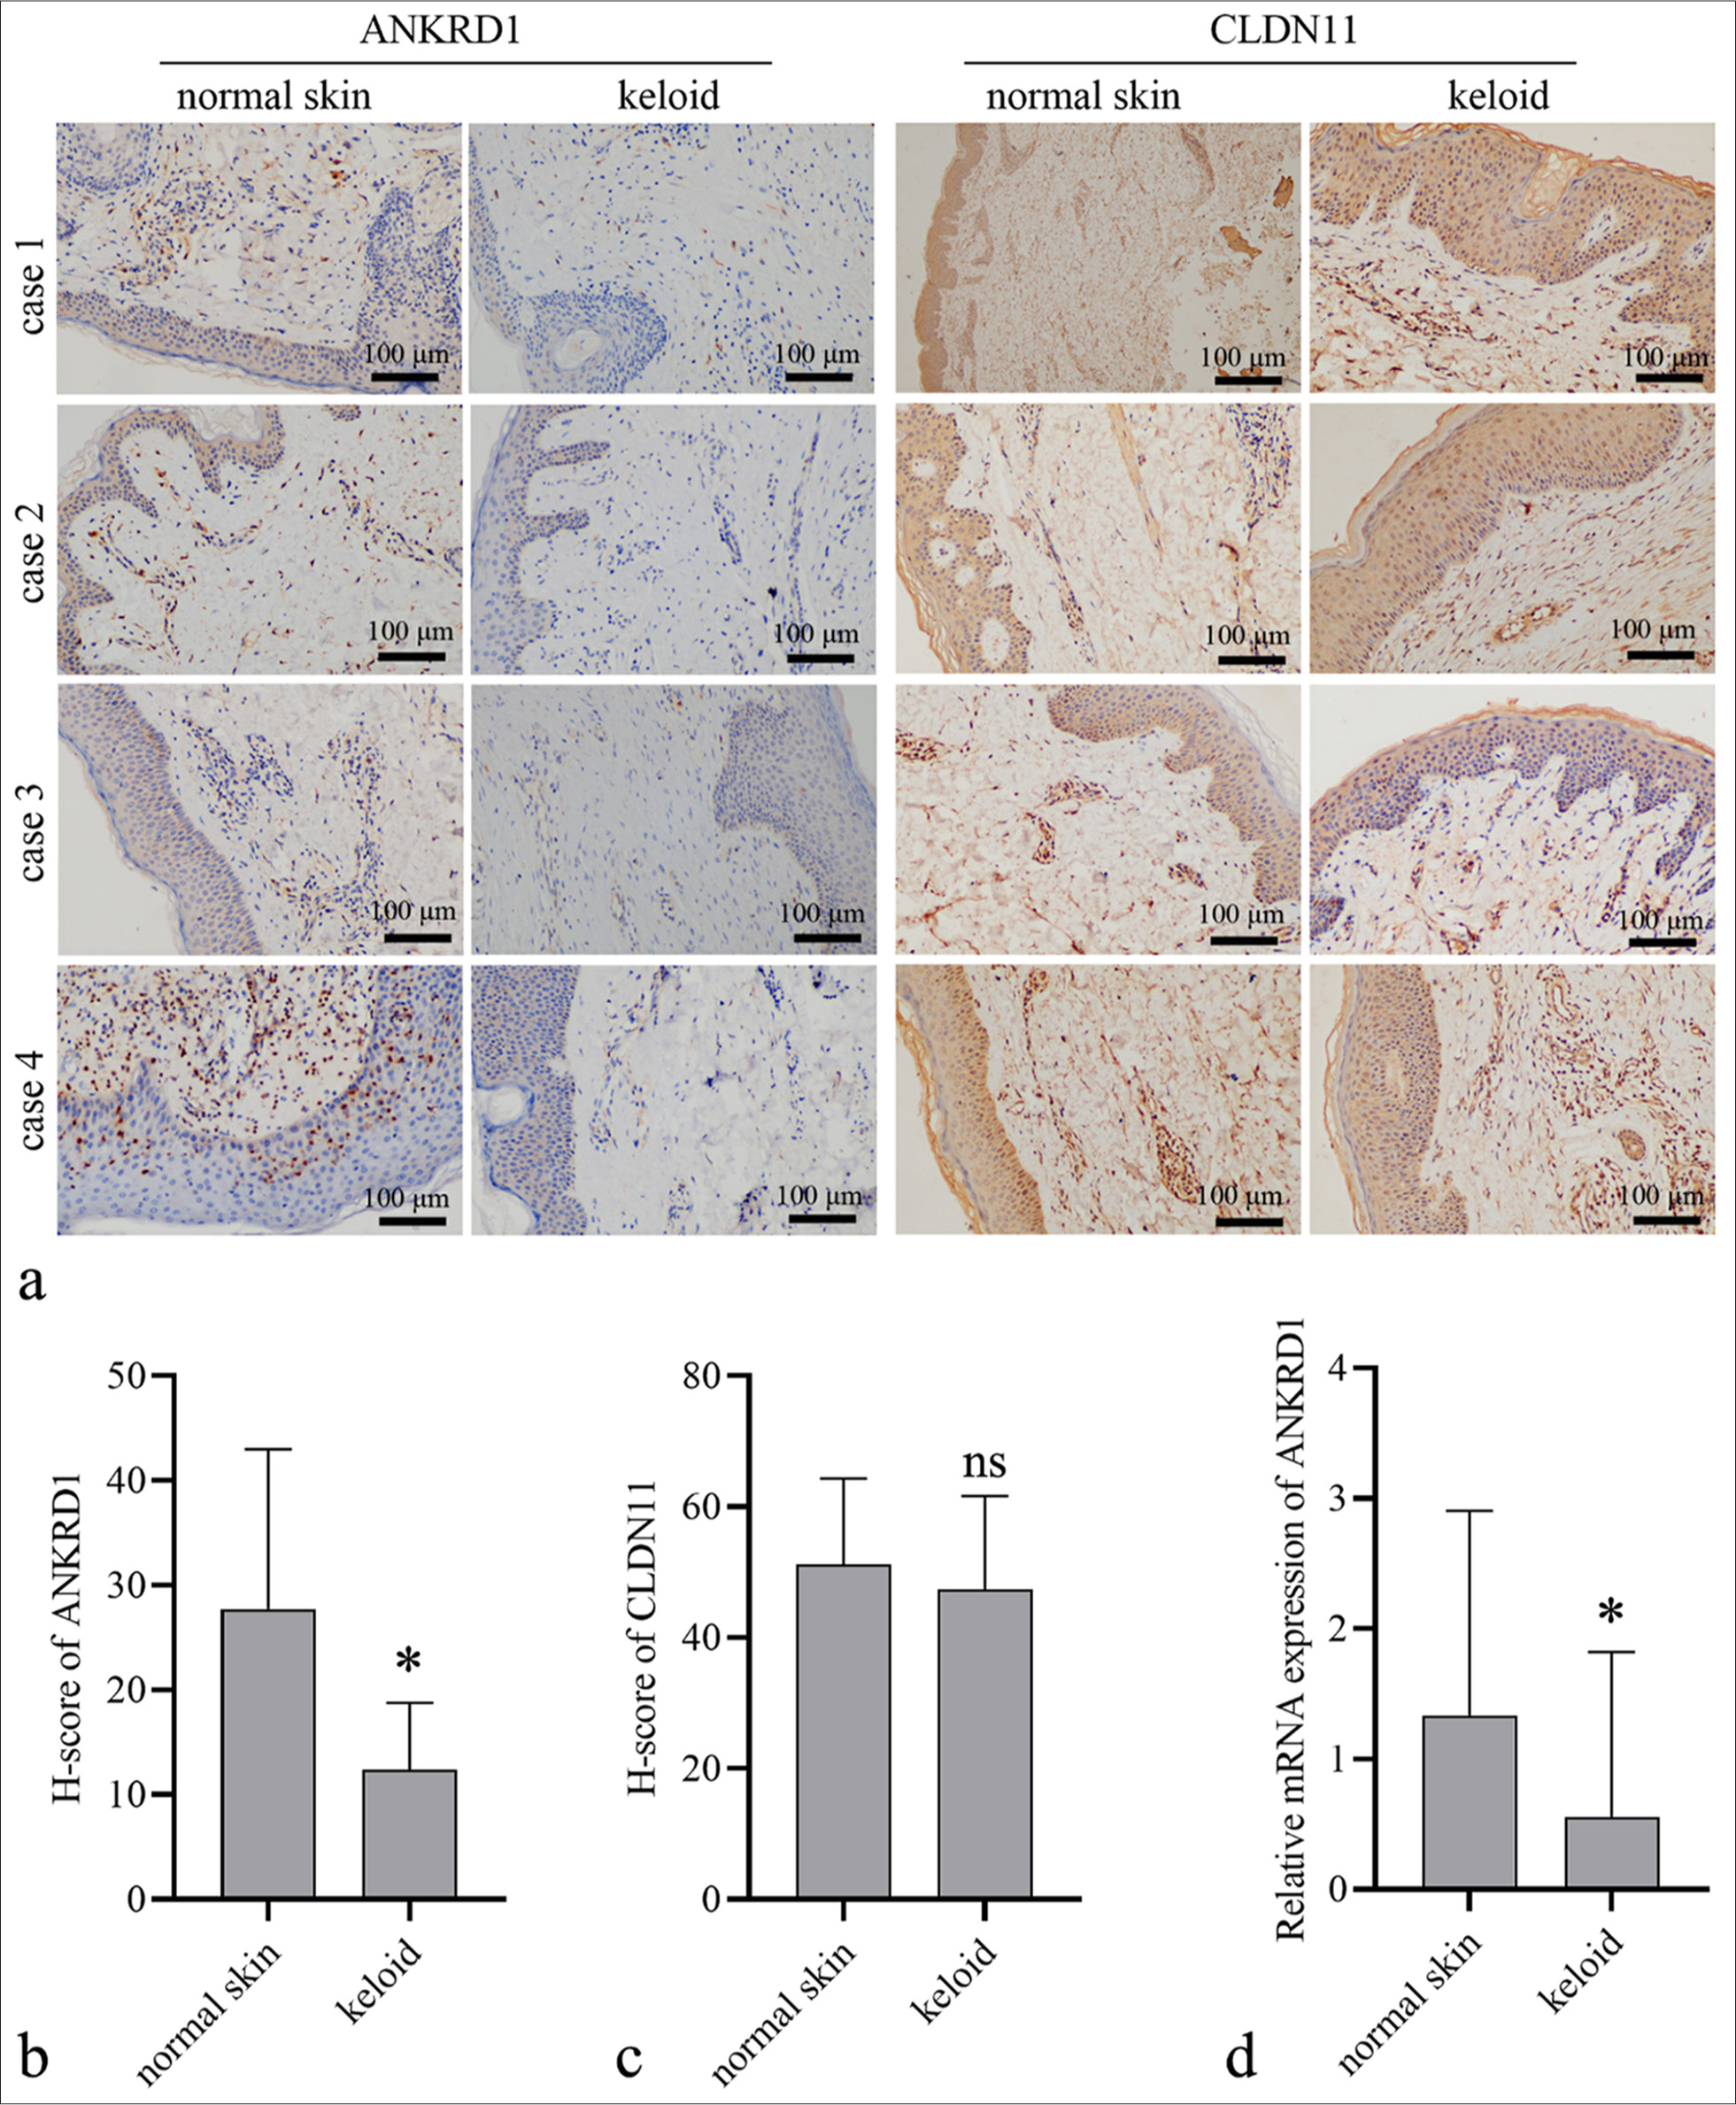
- Ankyrin repeat domain 1 (ANKRD1) and claudin 11 (CLDN11) expression levels in keloid and normal skin tissues. (a) Representative images of IHC results (20×) results. (b and c) Quantitative analysis of the expression of ANKRD1 and CLDN11 in keloid tissues (n = 30) and normal skin tissues (n = 20). Protein expression was quantified based on the histochemistry score (H-score) measured using ImageJ software. (d) ANKRD1 messenger RNA (mRNA) expression levels in keloid tissues (n = 33) and normal skin tissues (n = 55). An unpaired t-test was used to analyze the statistical differences between the keloid and normal skin groups. ✶P < 0.05 when compared to normal skin ns, P > 0.05. IHC: Immunohistochemistry.
Effect of ANKRD1 on HKF proliferation and apoptosis
To knock down ANKRD1 in HKFs, three siANKRD1 were synthesized. siNC and the three siANKRD1 constructs at concentrations of 25, 50, and 100 µM were transfected into HKFs. The results shown in Figure 3a indicate that siANKRD1–3 had the highest interference efficiency. Therefore, siANKRD1–3 was selected for subsequent assays and referred to as siANKRD1. Transfection with pcDNAANKRD1 elevated the mRNA expression of ANKRD1 in HKFs [Figure 3b]. Western blotting confirmed that ANKRD1 was effectively knocked down in the siANKRD1-transfected cells and overexpressed in the pcDNA-ANKRD1-transfected cells [Figure 3c and d]. Subsequently, we assessed the impact of ANKRD1 knockdown and overexpression on apoptosis and cell proliferation. After culturing for 24, 48, and 72 h, the OD value at 450 nm for HKFs was higher in the siANKRD1 group than that in the siNC group and lower in the pcDNA-ANKRD1 group than that in the pcDNA3.1 group [Figure 3e]. These results indicated that ANKRD1 knockdown promoted HKF proliferation, whereas ANKRD1 overexpression suppressed HKF proliferation. The results in Figures 3f and g show that neither ANKRD1 knockdown nor overexpression affected the percentage of early apoptotic cells.
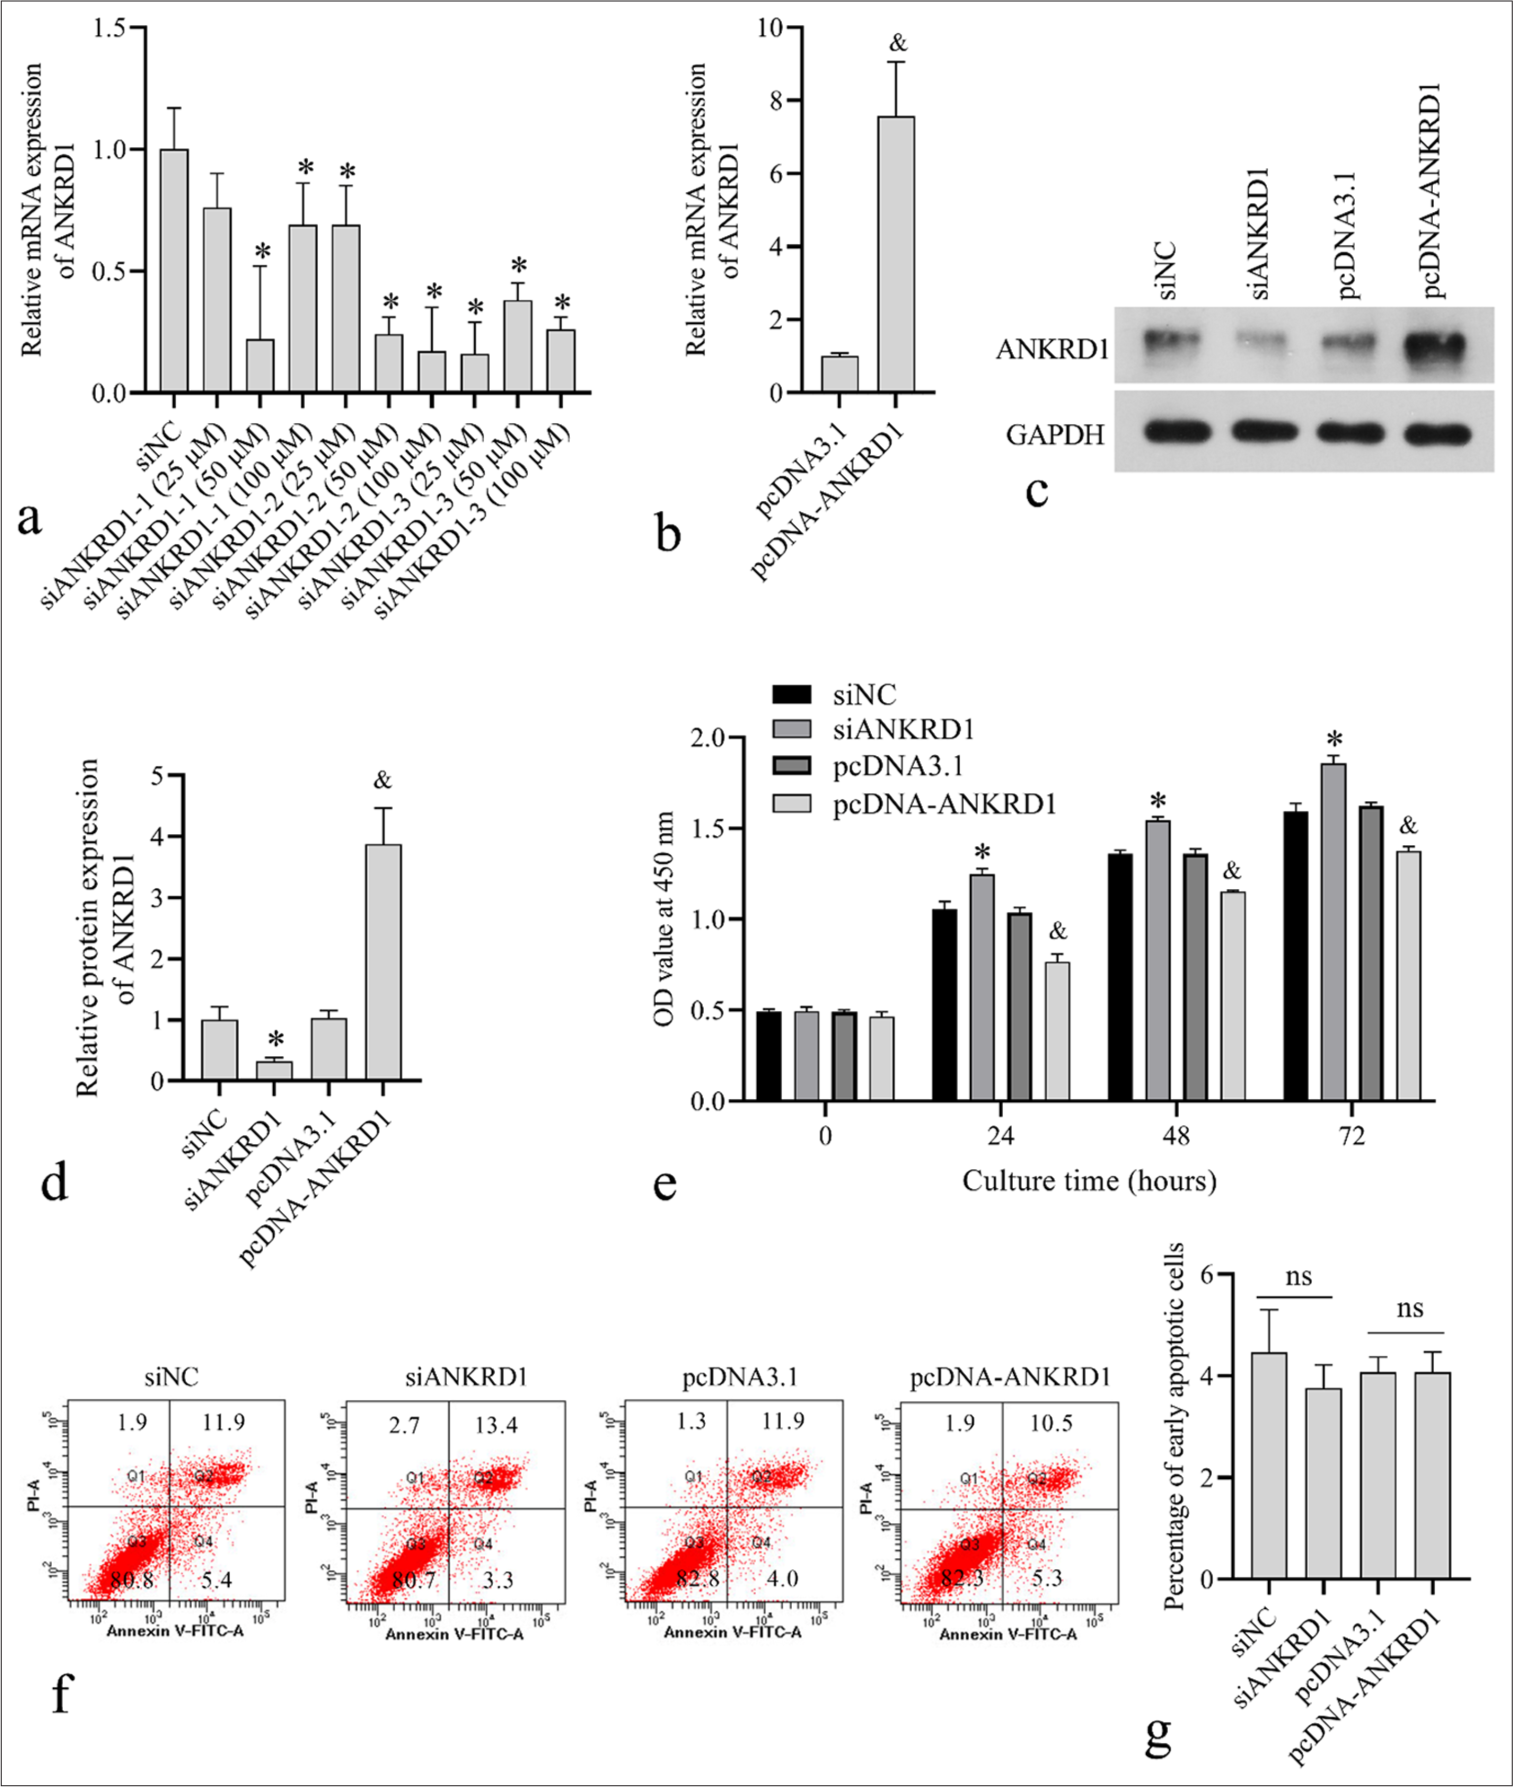
- Effect of ankyrin repeat domain 1 (ANKRD1) knockdown and overexpression on human keloid fibroblast (HKF) proliferation and apoptosis. (a) ANKRD1 messenger RNA (mRNA) levels after 24 h of transfection with negative control siRNA (siNC) and three siRNA targeting ANKRD1 (siANKRD1) at concentrations of 25, 50, and 100 µM. (b) ANKRD1 mRNA levels after 24 h of transfection with empty vector pcDNA3.1 and ANKRD1 overexpression vector pcDNA-ANKRD1. (c and d) ANKRD1 protein levels after 48 h of transfection with siNC, siANKRD1, pcDNA3.1, and pcDNA-ANKRD1. Panel c shows the western blot image. Panel d presents the statistical analysis of ANKRD1 expression normalized to glyceraldehyde-3-phosphate dehydrogenase. (e) Absorbance (OD) values at 450 nm measured using Cell Counting Kit-8 after transfection for 24, 48, and 72 h with siNC, siANKRD1, pcDNA3.1, and pcDNA-ANKRD1. (f and g) Apoptotic cell percentages assessed using flow cytometry after 24 h transfection with siNC, siANKRD1, pcDNA3.1, and pcDNA-ANKRD1. Panel f shows the flow cytometry scatter plot. The number in each quadrant is the percentage of cells. Panel g shows the statistical results of early apoptotic cells in quadrant 4 (Q4). For all bar graphs, n = 3. A one-way analysis of variance was used to analyze the statistical difference in panels a, d, e, and g. An unpaired t-test was used to analyze the statistical difference in panel b.✶P < 0.05 when compared to siNC; and, P < 0.05 when compared to pcDNA3.1; ns, P > 0.05. siRNA: Small interfering RNA.
Effect of ANKRD1 on HKF cell migration capability
Transwell and scratch assays were conducted to assess the impact of ANKRD1 on HKF migration. As shown in Figures 4a and b, the number of migrated HKFs increased in the siANKRD1 group compared with those in the siNC group and decreased in the pcDNAANKRD1 group compared with the pcDNA3.1 group. In addition, the wound healing percentage was higher in the siANKRD1 group than in the siNC group and lower in the pcDNA-ANKRD1 group than in the pcDNA3.1 group [Figure 4c and d]. These results suggest that ANKRD1 knockdown enhances HKF migration, whereas ANKRD1 overexpression inhibits it.
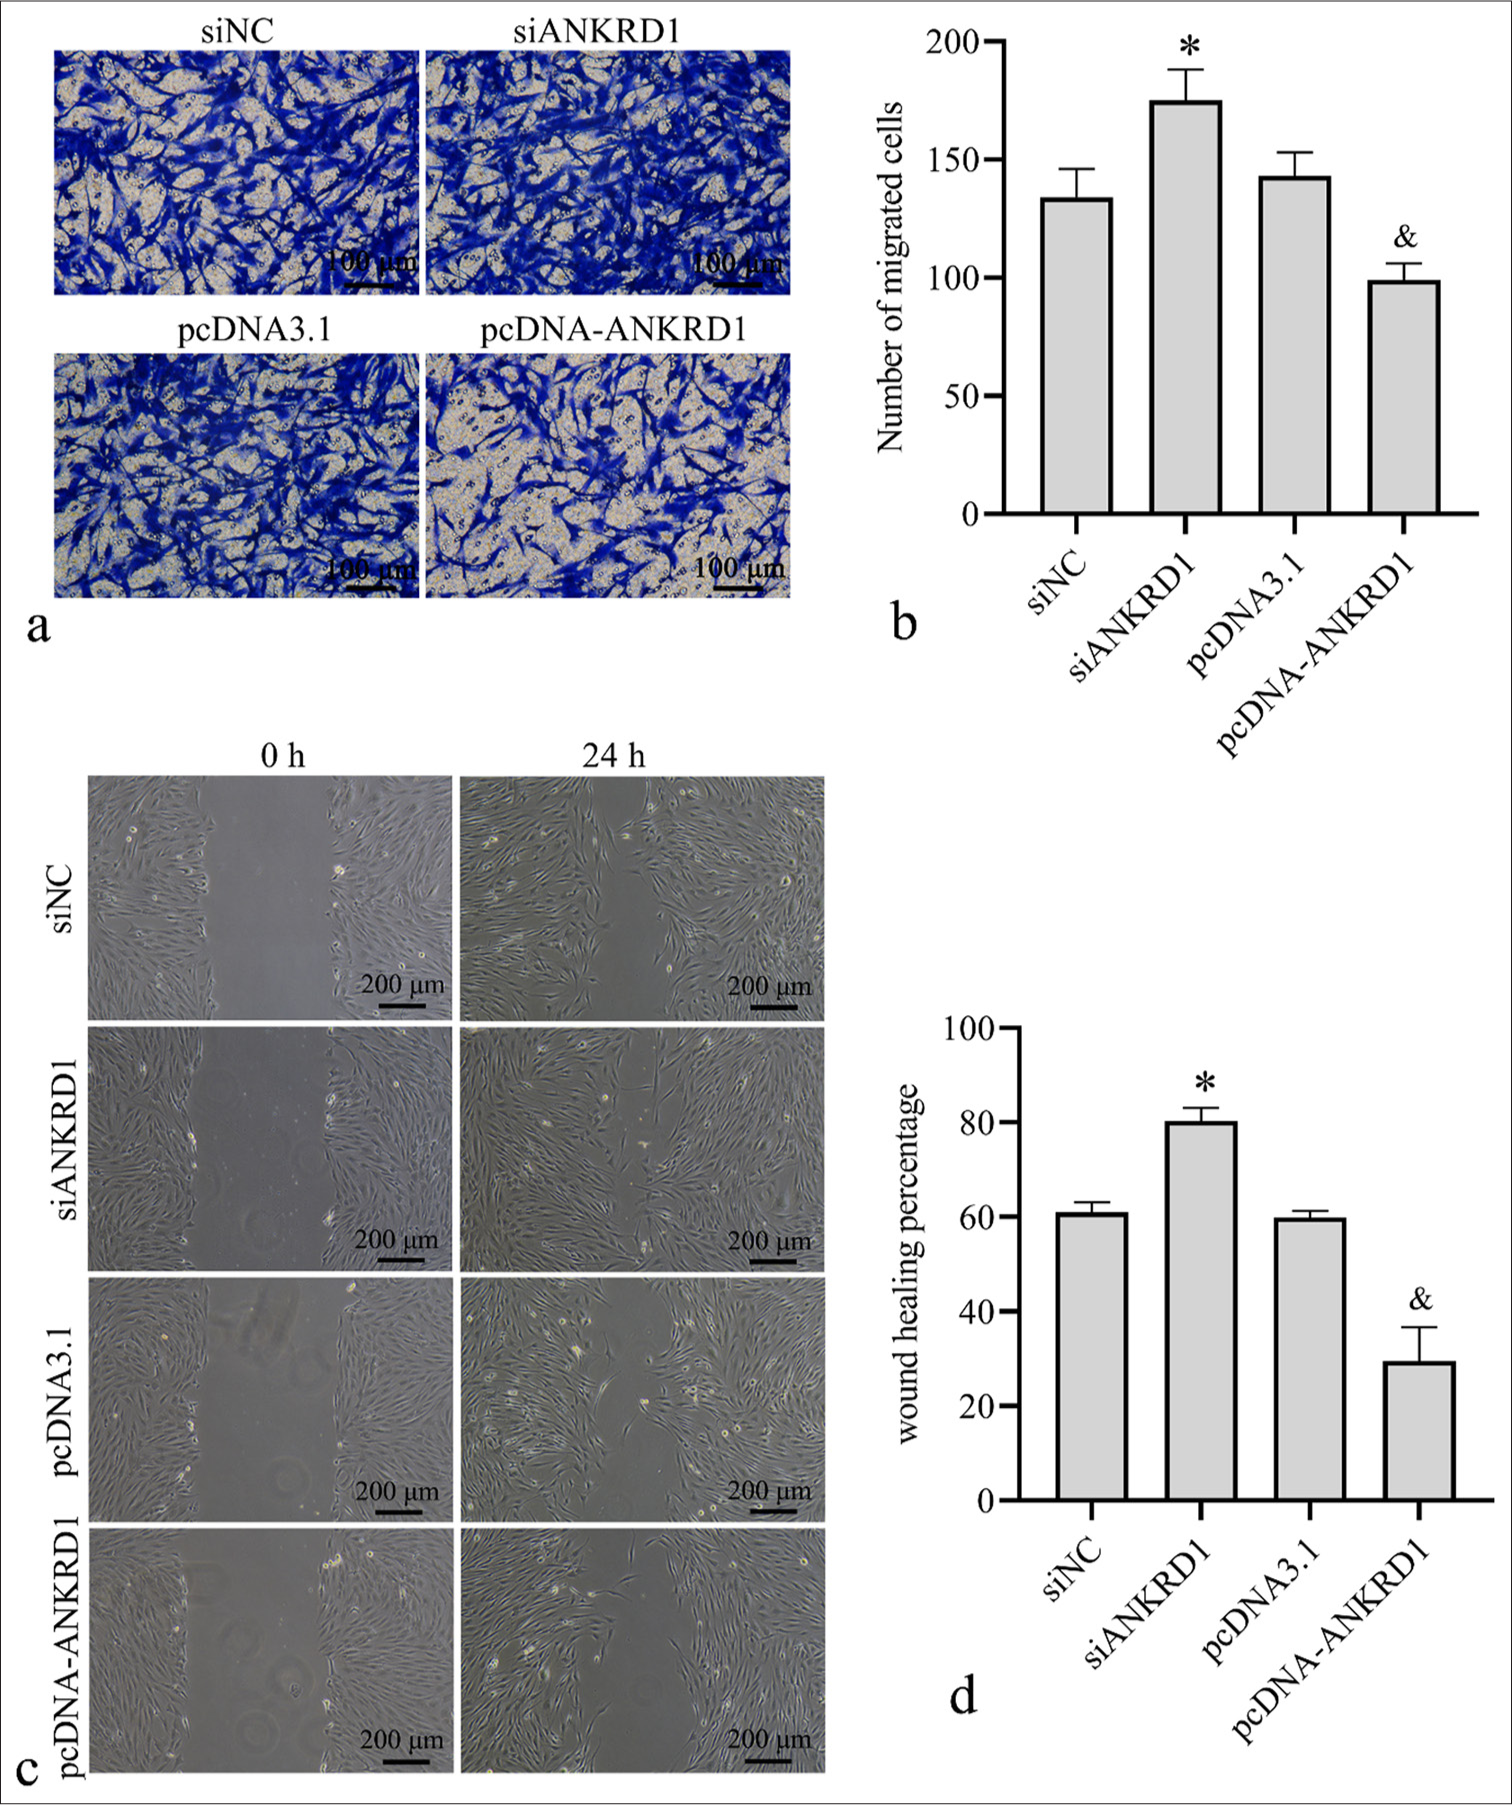
- Effect of Ankyrin repeat domain 1 (ANKRD1) knockdown and overexpression on human keloid fibroblast (HKFs) cell migration. HKFs were transfected with negative control siRNA (siNC), siRNA targeting ANKRD1 (siANKRD1), empty vector pcDNA3.1, and ANKRD1 overexpression vector pcDNA-ANKRD1. After 24 h of transfection, cells were used for Transwell migration and scratch assays. (a) Images of Transwell migration assay (20×). (b) Statistical analysis of the number of migrated cells. (c) Images of wound healing captured 24 h post-scratch. (d) Statistical analysis of the percentage of wound healing. A one-way analysis of variance was used to analyze the statistical differences, n = 3. ✶P < 0.05 when compared to siNC; and, P < 0.05 when compared to pcDNA3.1. siRNA: Small interfering RNA.
Effect of ANKRD1 on the expression of ECM-related proteins in HKFs
To explore the role of ANKRD1 in regulating the ECM in HKFs, we assessed the impact of ANKRD1 knockdown and overexpression on the expression of collagen I, FN, and MMP9. Collagen I is a structural protein in the ECM, FN is an adhesion protein, and MMP9 is a key enzyme involved in ECM remodeling.[20] The results showed that the levels of collagen I [Figure 5a and b], FN [Figure 5c and d], and MMP9 [Figure 5e and f] were elevated in the siANKRD1 group compared with those in the siNC group and reduced in the pcDNA-ANKRD1 group compared with those in the pcDNA3.1 group. These findings suggest that knocking down ANKRD1 enhances extracellular matrix deposition, whereas overexpressing ANKRD1 inhibits it.
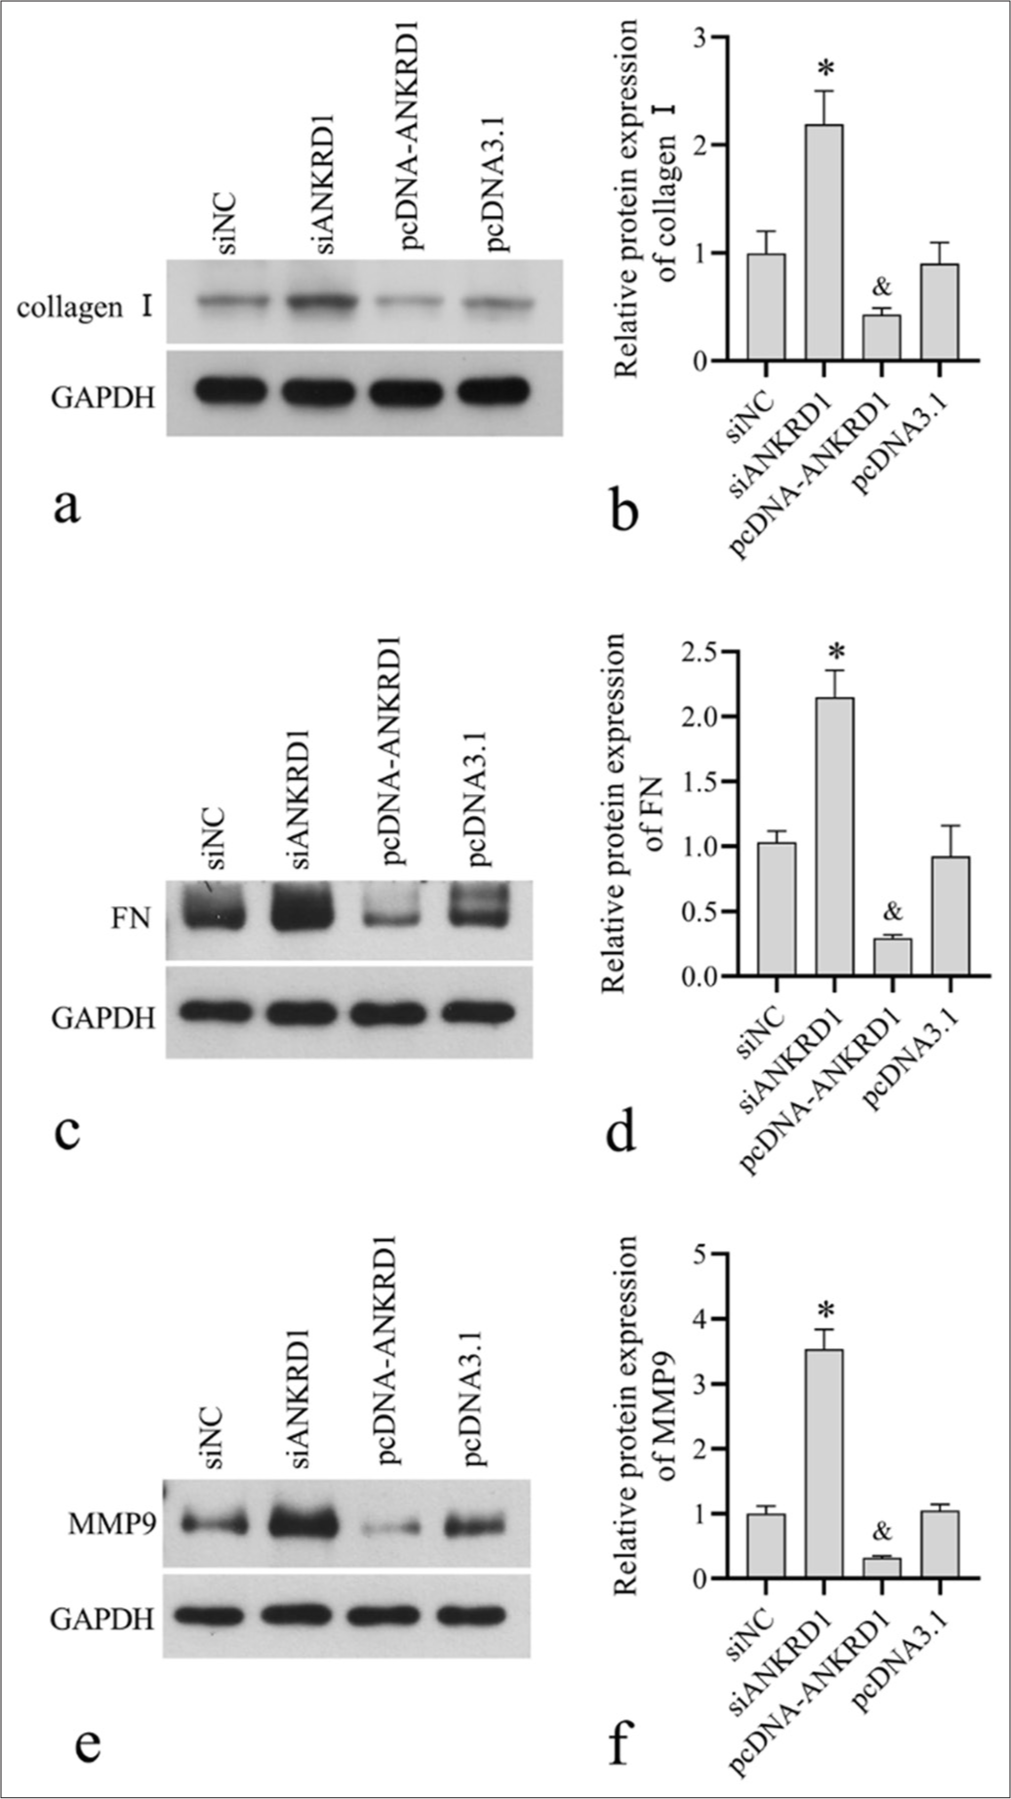
- Effect of Ankyrin repeat domain 1 (ANKRD1) knockdown and overexpression on the expression of collagen I, fibronectin (FN), matrix metallopeptidase 9 (MMP9). Human keloid fibroblasts were transfected with negative control siRNA (siNC), siRNA targeting ANKRD1 (siANKRD1), empty vector pcDNA3.1, and ANKRD1 overexpression vector pcDNA-ANKRD1. After 48 h of transfection, cells were harvested for Western blotting to detect collagen I (a, b), FN (c, d), and MMP9 (e, f) expression. Panels a, c, and e are the images of Western blot . (d-f) Panels b, d, and f are the statistical analysis of relative proteinexpression normalized to glyceraldehyde-3-phosphate dehydrogenase. A one-way analysis of variance was used to analyses the statistical difference, n = 3. ✶P < 0.05 when compared to siNC; and, P < 0.05 when compared to pcDNA3.1. siRNA: Small interfering RNA.
DISCUSSION
Our bioinformatic analysis revealed that ANKRD1 was differentially expressed in keloid fibroblasts. Dysregulated ANKRD1 suggests a potential role in keloid progression. To further understand this, we examined ANKRD1 expression in keloids and its impact on cell proliferation, apoptosis, migration, and the expression of ECM-related proteins in HKFs. The present study demonstrated that ANKRD1 is downregulated in keloids and plays a suppressive role in keloid fibroblast growth, migration, and ECM deposition. Our results provide preliminary evidence that ANKRD1 contributes to keloid progression and offer a new theoretical basis for understanding the molecular mechanisms underlying keloids.
ANKRD1 expression was induced by wounding and tissue injury.[17] Global deletion of ANKRD1 has been shown to delay excisional wound closure in a mouse model.[17] These findings indicate a potential role for ANKRD1 in wound healing. Since keloid formation arises from aberrant wound-healing processes, our investigation revealed the downregulation of ANKRD1 in keloids. Consequently, we postulate that decreased ANKRD1 expression may contribute to impaired wound healing and subsequent keloid formation. Unraveling the factors responsible for the reduced expression of ANKRD1 is crucial for understanding its regulatory mechanisms and guiding future research.
Keloids are benign skin tumors.[21] The principal pathological characteristics of keloids include excessive fibroblast proliferation and enlarged and abnormal distribution of the ECM.[22-24] In addition, strong migration of fibroblasts is an important factor in keloid formation.[10] In our study, we analyzed the effects of ANKRD1 knockdown and overexpression on cell proliferation, migration, and the expression levels of ECM-related proteins, including collagen I, FN, and MMP9. Our results indicate that ANKRD1 overexpression suppressed HKF proliferation, migration, and the expression levels of collagen I, FN, and MMP9. Conversely, the results from overexpression and knockdown showed opposite trends, suggesting that ANKRD1 plays a suppressive role in keloid formation. In normal fibroblasts, ANKRD1 knockout has been shown to decrease migration capability.[17] In addition, in ANKRD1 knockout fibroblasts, the transcription of MMP13 and MMP10 is enhanced.[25] MMPs are proteolytic enzymes that degrade the ECM.[26] This indicates that ANKRD1 has distinct functions in normal and keloid fibroblasts, with its role as a transcriptional cofactor varying depending on the activation of diverse downstream signaling pathways.
ANKRD1 is known to regulate cell proliferation and apoptosis in various cell types, including cancer cells and cardiomyocytes.[27,28] However, our research shows that ANKRD1 only suppresses HKF proliferation and does not affect apoptosis in HKFs. Previous studies have found that keloid tissue exhibits excessive proliferation, yet apoptosis levels are similar to those in normal tissue.[29] This suggests that the mechanisms controlling apoptosis in keloid tissue may differ from those in other cells. In addition, the pathway through which ANKRD1 regulates apoptosis might be obstructed by some unidentified mechanism.
We observed that ANKRD1 affects the expression of ECM-related proteins. Given the functional characteristics of collagen I, FN, and MMP9,[20] we hypothesize that ANKRD1 influences ECM deposition. ECM plays a crucial role in regulating various biological functions, including cell adhesion, proliferation, differentiation, migration, cell-cell interactions, and intracellular signaling events.[24] Therefore, we propose that ANKRD1 may modulate HKF proliferation and migration through its regulation of ECM deposition. As ANKRD1 functions as a transcriptional cofactor, future studies will focus on identifying the genes whose transcription is influenced by ANKRD1, particularly those critical for HKF ECM deposition. This work will enhance our understanding of the molecular mechanisms through which ANKRD1 regulates keloid formation.
SUMMARY
Our findings demonstrate that ANKRD1 is downregulated in keloids and inhibits the growth, migration, and ECM deposition of keloid fibroblasts. This study elucidates the role of ANKRD1 in keloid formation, advancing research in this area and establishing a solid experimental basis for future investigations. However, current results do not fully elucidate the mechanisms through which ANKRD1 functions. Further experiments are required to determine the downstream and upstream signaling pathways of ANKRD1. In addition, animal models are needed to validate the effects of ANKRD1 on keloid formation.
ACKNOWLEDGMENT
Not applicable.
AVAILABILITY OF DATA AND MATERIALS
The datasets generated during and/or analyzed during the present study will be available from the corresponding author on reasonable request.
ABBREVIATIONS
ANKRD1: Ankyrin repeat domain 1
CLDN11: Claudin 11
GAPDH: Glyceraldehyde-3-phosphate dehydrogenase
GEO: Gene Expression Omnibus
HKF: Keloid fibroblasts
OD: Absorbance
PBS: Phosphate buffer saline
qRT-PCR: Quantitative reverse transcription PCR
siANKRD1: Small interfering RNA targeting ANKRD1
AUTHOR CONTRIBUTIONS
WQW and JRL: Designed the experiments, and wrote the draft manuscript; WQW: Performed the cell experiments; YS: Performed immunohistochemistry; JY and LYW: Contributed data collection and analysis; JRL and YS: Revised the draft manuscript. All authors read and approved the final manuscript.
ETHICS APPROVAL AND CONSENT TO PARTICIPATE
This study on human tissues was approved by the Research Ethics Committee of The Fourth Affiliated Hospital, Guangzhou Medical University (Ethics approval number: 2024-H-006). Written informed consent was obtained from all patients involved in this study. This study was conducted in accordance with the Declaration of Helsinki.
CONFLICT OF INTEREST
The authors declare no conflict of interest.
EDITORIAL/PEER REVIEW
To ensure the integrity and highest quality of CytoJournal publications, the review process of this manuscript was conducted under a double-blind model (authors are blinded for reviewers and vice versa) through an automatic online system.
FUNDING Not applicable.
References
- The epidemiology of keloids [M] In: Téot L, Mustoe TA, Middelkoop E, Gauglitz GG, eds. Textbook on scar management. State of the art management and emerging technologies. Cham, CH: Springer; 2020. p. :29-35.
- [CrossRef] [Google Scholar]
- Keloids: A review of therapeutic management. Int J Dermatol. 2021;60:661-71.
- [CrossRef] [PubMed] [Google Scholar]
- Keloids and hypertrophic scars: Pathophysiology, classification, and treatment. Dermatol Surg. 2017;43(Suppl 1):S3-18.
- [CrossRef] [PubMed] [Google Scholar]
- Keloids: Pathophysiology and management. Dermatol Online J. 2007;13:9.
- [CrossRef] [PubMed] [Google Scholar]
- Genetic susceptibility to raised dermal scarring. Br J Dermatol. 2009;161:8-18.
- [CrossRef] [PubMed] [Google Scholar]
- Molecular mechanism of myofibroblast formation and strategies for clinical drugs treatments in hypertrophic scars. J Cell Physiol. 2020;235:4109-19.
- [CrossRef] [PubMed] [Google Scholar]
- Therapeutic targeting of mechanical stretch-induced fak/erk signaling by fisetin in hypertrophic scars. Eur J Pharmacol. 2022;932:175228.
- [CrossRef] [PubMed] [Google Scholar]
- The interplay of fibroblasts, the extracellular matrix, and inflammation in scar formation. J Biol Chem. 2022;298:101530.
- [CrossRef] [PubMed] [Google Scholar]
- Loss of desmin triggers mechanosensitivity and up-regulation of ankrd1 expression through akt-nf-κb signaling pathway in smooth muscle cells. FASEB J. 2012;26:757-65.
- [CrossRef] [PubMed] [Google Scholar]
- 26s proteasome regulation of ANKRD1/carp in adult rat ventricular myocytes and human microvascular endothelial cells. Biochem Biophys Res Commun. 2012;425:830-5.
- [CrossRef] [PubMed] [Google Scholar]
- Ankyrin repeat domain 1 regulates innate immune responses against herpes simplex virus 1: A potential role in eczema herpeticum. J Allergy Clin Immunol. 2018;141:2085-93.e1.
- [CrossRef] [PubMed] [Google Scholar]
- Pan-cancer integrated analysis of ANKRD1 expression, prognostic value, and potential implications in cancer. Sci Rep. 2024;14:5268.
- [CrossRef] [PubMed] [Google Scholar]
- ANKRD1 expression is aberrantly upregulated in the mdm mouse model of muscular dystrophy and induced by stretch through nfκb. J Muscle Res Cell Motil. 2024;45:191-200.
- [CrossRef] [PubMed] [Google Scholar]
- Ankrd1 and spp1 as diagnostic markers and correlated with immune infiltration in biliary atresia. Medicine (Baltimore). 2021;100:e28197.
- [CrossRef] [PubMed] [Google Scholar]
- Global deletion of ANKRD1 results in a wound-healing phenotype associated with dermal fibroblast dysfunction. Am J Pathol. 2015;185:96-109.
- [CrossRef] [PubMed] [Google Scholar]
- Inhibition of ANKRD1 sensitizes human ovarian cancer cells to endoplasmic reticulum stress-induced apoptosis. Oncogene. 2015;34:485-95.
- [CrossRef] [PubMed] [Google Scholar]
- NOP14 inhibits melanoma proliferation and metastasis by regulating wnt/β-catenin signaling pathway. Braz J Med Biol Res. 2018;52:e7952.
- [CrossRef] [PubMed] [Google Scholar]
- The role of extracellular matrix in wound healing. Dermatol Surg. 2023;49:S41-8.
- [CrossRef] [PubMed] [Google Scholar]
- Spontaneous keloids: A literature review. Dermatology. 2018;234:127-30.
- [CrossRef] [PubMed] [Google Scholar]
- The roles of inflammation in keloid and hypertrophic scars. Front Immunol. 2020;11:603187.
- [CrossRef] [PubMed] [Google Scholar]
- Keloids: The paradigm of skin fibrosis-pathomechanisms and treatment. Matrix Biol. 2016;51:37-46.
- [CrossRef] [PubMed] [Google Scholar]
- Dermal extracellular matrix molecules in skin development, homeostasis, wound regeneration and diseases. Semin Cell Dev Biol. 2022;128:137-44.
- [CrossRef] [PubMed] [Google Scholar]
- ANKRD1 acts as a transcriptional repressor of mmp13 via the ap-1 site. Mol Cell Biol. 2014;34:1500-11.
- [CrossRef] [PubMed] [Google Scholar]
- The immunomodulatory role of matrix metalloproteinases in colitis-associated cancer. Front Immunol. 2022;13:1093990.
- [CrossRef] [PubMed] [Google Scholar]
- Ankyrin repeat domain 1 overexpression is associated with common resistance to afatinib and osimertinib in egfr-mutant lung cancer. Sci Rep. 2018;8:14896.
- [CrossRef] [PubMed] [Google Scholar]
- Overexpression of ankyrin repeat domain 1 enhances cardiomyocyte apoptosis by promoting p53 activation and mitochondrial dysfunction in rodents. Clin Sci (Lond). 2015;128:665-78.
- [CrossRef] [PubMed] [Google Scholar]
- A comparison of apoptosis levels in keloid tissue, physiological scars and normal skin. Am J Transl Res. 2017;9:5548-57.
- [Google Scholar]