


Translate this page into:
Exploration on the potential predictive value of regulator of G-protein signaling 2 in the efficacy of concurrent chemoradiotherapy on cervical squamous cell carcinoma

*Corresponding author: Yi Liu, Department of Gynecology, Affiliated Hospital of Zunyi Medical University, Zunyi, China. 15308529955@163.com
-
Received: ,
Accepted: ,
How to cite this article: Liu Y, Xu J, Zou X, Li L. Exploration on the potential predictive value of regulator of G-protein signaling 2 in the efficacy of concurrent chemoradiotherapy on cervical squamous cell carcinoma. CytoJournal. 2025;22:53. doi: 10.25259/Cytojournal_225_2024
Abstract
Objective:
Concurrent chemotherapy and radiotherapy (CCRT) has been applied as a therapeutic modality for cervical squamous cell carcinoma (CESC). Our aim is to investigate the potential marker(s) of the efficacy of CCRT in CESC.
Material and Methods:
Potential candidates predictive of the efficacy of CCRT in CESC were identified. Differentially expressed genes (DEGs) were screened, followed by performing functional enrichment analyses. CCRT-related biomarkers were identified. In addition, the CIBERSORT algorithm was employed to determine the immune cell infiltration. Immune cell subsets from donors and specific cytokines were evaluated, and the biological functions of CESC cells following cisplatin treatment or coculture with M2 macrophages were explored.
Results:
A total of 56 DEGs were singled out. These DEGs were enriched in pathways relevant to CESC and CCRT. They were narrowed down to eight CCRT-related biomarkers with good predictive values. Notably, most of the biomarkers were negatively correlated with M2 macrophages (P < 0.05), and regulator of G-protein signaling 2 (RGS2) exhibited low expression in CESC (P < 0.05). Flow cytometry results revealed that patients with CCRT-resistant CESC had high percentages of M2 macrophages, CD4 T cells, regulatory T cells and T helper 2 cells but low percentages of T helper 1 cells, and T helper 17 cells, M1 macrophages, and CD8 T cells (P < 0.05). Aside from interleukin (IL4) and IL-10, the remaining specific cytokines exhibited low expression in patients with CCRT-resistant CESC (P < 0.05). Furthermore, the cell cycle progression and metastasis of CESC cells were evidently promoted by M2 macrophages but were suppressed by cisplatin intervention (P < 0.05). Moreover, in CESC cells, cisplatin repressed the levels of IL-4 and IL-10 yet boosted those of the remaining cytokines, whereas M2 macrophages had the opposite effects (P < 0.05). RGS2 silencing promoted the phosphorylation of phosphatidylinositol 3-kinase/protein kinase B/transcriptional signal transducer and activator 6 in macrophages, whereas RGS2 overexpression had the opposite effect (P < 0.05).
Conclusion:
This study interpreted and explored the possible predictive values of RGS2 in the efficacy of CCRT in CESC. It may provide other insights for the management of CESC.
Keywords
Biomarkers
Cervical squamous cell carcinoma
Chemotherapy
Radiotherapy
Regulator of G-protein signaling 2

INTRODUCTION
Cervical cancer (CC) remains an important cancer burden for women, particularly those in low- and middle-income nations, across the world.[1] As one of the most frequently diagnosed gynecological malignancies all over the world, CC is believed to be associated with human papillomavirus infection, tobacco consumption, increased delivery number, and extended oral contraceptive application.[2] In China, cervical squamous cell carcinoma (CESC) is the most common type of CC, and most patients with this malignancy are diagnosed at locally advanced stages, for which concurrent chemotherapy and radiotherapy (CCRT) has been established as the standard therapeutic modality.[3] However, the survival of patients receiving CCRT remains unsatisfactory, and undesired therapeutic resistance, as well as disease relapses, has made predicting the treatment efficacy of CCRT in patients with CESC and identifying a reliable biomarker evaluating the efficacy of CCRT a necessity.[4-6]
To define the global gene expression profile within single cells, single-cell RNA sequencing (scRNA-seq) is a technique that has made the exploration of previously hidden heterogeneities in specific cell populations possible.[7] Previously, the heterogeneous microenvironment, new immunoreaction patterns, possible biomarkers, and peculiar therapeutic strategies for CESC has been revealed with the help of scRNA-seq.[8] Another scRNA-seq analysis has revealed that naïve CD4+ T cells interact with M0 macrophages in the immunosuppressive microenvironment of CC.[9] Moreover, while examining the application of scRNA-seq in evaluating the efficacy of using CCRT to treat CESC, a novel research suggested that lumican is a possible predictor and its high expression is linked to a poor outcome of CCRT in patients suffering from CESC.[10] This study therefore prompted us to investigate additional relevant biomarkers while examining the efficacy of treating CESC patients with CCRT.
Ever since its discovery in mammalian cells back in the late 1990s, the regulator of G-protein signaling (RGS) protein family has been reported to function crucially in the regulation of cellular signaling events downstream of G-protein coupled receptors.[11,12] Furthermore, accumulating pieces of evidence have underlined that RGS proteins are critical mediators in controlling cellular processes and the dysfunction of RGS proteins may be related to the pathogenesis of certain diseases, like cancer.[13] As a member of the RGS protein family, RGS2 shares a strong association with the initiation and progression of certain female diseases, such as hysteromyoma, gestational hypertension, preeclampsia, postpartum depression, and breast cancer.[13] Nonetheless, the involvement of RGS2 in CC (or CESC) remains blank, l et alone its potential involvement in evaluating the efficacy of treating CESC patients with CCRT. Hence, in our present study, we attempt to bridge this gap to complete our understanding of treating CESC patients with CCRT.
MATERIAL AND METHODS
Data sources
The bulk RNA-sequencing dataset GSE168009, RNA microarray dataset GSE56363, and scRNA-seq dataset GSE208653 were all obtained from the database of Gene Expression Omnibus (GEO, https://www.ncbi.nlm.nih.gov/geo/). According to the World Health Organization evaluation criteria and Response Evaluation Criteria in Solid Tumors criteria (V.1.1), the patients in the dataset GSE56363 were allocated to the non-complete response to CCRT (NCR, n = 9) and complete response to CCRT (CR, n = 12) groups.[14] Meanwhile, patients were divided into no durable benefit (defined as progression-free survival was applied as the gene expression when multiple probes matched to one gene.
Differentially expressed genes (DEGs) analysis
Limma package (version 3.42.2, The Walter and Eliza Hall Institute of Medical Research, Melbourne, Australia) was applied to analyze the DEGs in these groups of datasets GSE56363 and GSE168009 at the cut-off criteria false discovery rate (FDR) < 0.05 and |log2fold change (FC)| ≥ 1.[15] Relevant volcano plots were drawn to visualize these DEGs in these groups. These DEGs was subjected to the functional enrichment analysis via Kyoto Encyclopedia of Genes and Genomes (KEGG) analysis via ClusterProfiler package (version 0.4.6, Baylor College of Medicine, Houston, TX, USA).[16]
Single-cell data analysis
The “Read10X” function in the Seurat package (version 3.2.3, Satija Lab, New York, USA)[17] was applied to read the scRNA-seq data in each sample. Cells with gene counts >200 and mitochondrial counts <10% were retained and standardized through the SCTransform formula. After principal component analysis (PCA) downscaling, the Harmony package[18] was used to remove the batch effects of different samples, and dimensionality reduction was implemented through the “RunUMAP” function. The two functions “FindNeighbors” and “FindClusters” were applied for the clustering of cell subpopulations at dims = 30 and resolution = 0.05 (the further subclustering of macrophages was initiated at dims = 20 and resolution = 0.01). The main cell subpopulations were annotated using the database CellMarker 2.0 (http://biocc.hrbmu.edu.cn/CellMarker/)[19] on the basis of relevant marker genes.
Sorting and validation of CCRT-relevant biomarkers
CCRT-relevant biomarkers were sorted out using the glmnet package to perform least absolute shrinkage and selection operator (LASSO) regression analysis,[20] the “rfe” function in the caret package to perform support vector machine-recursive feature elimination (SVM-RFE) analysis,[21] and random forest algorithm.[22] The sorted CCRT-relevant biomarkers were then subjected to validation through receiver operating characteristic (ROC) analysis with the help of the p-ROC package.[23] Accordingly, we calculated the area under the curve (AUC).
Analysis on immune cell infiltration
The CIBERSORT package[24] in R was employed to calculate the immune cell infiltration between patients with CR and NCR in the GSE56363 and GSE168009 datasets, and LM22, the expression dataset of 22 common immune infiltrating cells, was obtained from the official website of CIBERSORT (https://cibersortx.stanford.edu/). Correlations between biomarkers and immune cell infiltration were calculated on the basis of the Spearman correlation coefficient (P < 0.05). On the basis of the transcriptomic expression profiles of the samples, the expression of biomarkers in patients with CR and NCR in both datasets was subsequently analyzed using the “ssGSEA” function of the gene set variation analysis package.[25]
Patients
All clinical examinations were performed following the 2024 version of the Declaration of Helsinki.[26] The Institutional Review Board of the Affiliated Hospital of Zunyi Medical University approved the collection of human tumor and blood samples of this study. Consent was obtained from a total of 15 patients which were enrolled in this study or their families. The 15 patients were diagnosed with locally advanced squamous cell carcinoma of the cervix and treated with CCRT. One week before and 3 weeks after the start of CCRT, tumor samples were collected by biopsy. Radiotherapy consisted of external pelvic irradiation radiotherapy (34–30 Gy; 15–17 sessions) and one cycle of paclitaxel (33069-62-4, Hengrui Medicine, Jiangsu, China) chemotherapy (135–175 mg/m2) followed by cisplatin (50–70 mg/m2). After CCRT treatment, the patients were classified into the sensitive, partially sensitive, and resistant groups in accordance with treatment efficacy. The inclusion criteria were (1) diagnosed with CESC and definitive CCRT; (2) aged between 18 and 85 years; (3) with FIGO stage IB2–IVA tumors without a prior history of chemotherapy or radiation; (4) with Eastern Cooperative Oncology Group physical status of 0–1; and (5) underwent a medical history and physical examination, including abdominal and pelvic magnetic resonance imaging, chest computed tomography, complete blood count, and liver and renal function assessment. All patient data were anonymized to protect patient privacy. Exclusion criteria were (1) a history of any other malignancies; (2) lactation or pregnancy; (3) renal, pulmonary, hepatic, or cardiac failure; (4) distant metastases; and (5) failure to provide complete clinical data (e.g., laboratory results, medical history, and imaging).
Isolation of peripheral blood mononuclear cells (PBMCs) through Ficoll–Paque density gradient centrifugation
Following a previous report, PBMCs were extracted from peripheral blood using the Ficoll–Paque method.[27] In brief, the top layer containing plasma was removed after centrifuging acid-citrate-dextrose solution, solution A anticoagulated blood at 800 × g for 30 min, and an equal volume of phosphate-buffered saline (PBS, pH 7.4) containing 0.05 M ethylenediaminetetraacetic acid (EDTA;15575-020, ThermoScientific, Waltham, MA, USA) was used to dilute the remaining blood. A total of 12.5 mL of diluted blood was layered on 25 mL of Ficoll–Paque PLUS (GE Healthcare). The gradient was centrifuged at 400 × g for 30 min in a swinging bucket rotor without a brake at room temperature. The PBMC interface was carefully eliminated through pipetting and washed using PBS–EDTA through centrifugation at 250 × g for 10 min. Ammonium chloride–potassium lysis buffer (A1049201, ThermoScientific, Waltham, MA, USA) was used to suspend PBMC pellets, which were incubated with gentle mixing to lyse contaminated red blood cells for 10 min at room temperature. They were then washed with PBS–EDTA. A Countess automatic cell counter (AMQAX1000, ThermoScientific, Waltham, MA, USA) was employed to quantify the cells and detect the cell viability. Inactive cells were identified by Tepan blue staining, and cell viability was calculated using total cell and inactive cell counts. Cells were resuspended in RPMI1640 (11875093, ThermoScientific, Waltham, MA, USA) medium containing 1% penicillin–streptomycin (15070063, ThermoScientific, Waltham, MA, USA), 10% fetal bovine serum (FBS, 10099158, ThermoScientific, Waltham, MA, USA), and cultured in a humid atmosphere (5% carbon dioxide [CO2] and 37°C) for subsequent studies.
Mycoplasma assay
The MycoAlert (Lonza) assay[28] is intended for use in 96-well plates and was performed in accordance with the manufacturer’s specifications. Briefly, 50 μL of the sample and reagents were combined and incubated. The primary signal was then analyzed. Next, the sample was added with 50 μL of the substrate and incubated. A secondary reading was then conducted. The assay plate was read on a ViewLux microplate imager (VLU-0001, PerkinElmer, Waltham, MA, USA) to quantify luminescence within an exposure of 30 s. Samples were labeled positive for mycoplasma if the ratio of secondary luminescence to primary luminescence was >1.2 (<0.9 is negative, and 0.9 ≤1.2 indicates an equivocal result).
Cell identification through short tandem repeat (STR) analysis
To confirm the unique identity of the cells and to avoid cell confusion or misuse, STR analysis[28] was performed separately for each sample. This technique is one of the few DNA analysis techniques that can be used for the routine identification (certification) of human stem cells, cell lines, and tissues. For the identification of human cells, the Iranian Biological Resource Center performed STR with 16 markers from Applied Biosystems (AmpFlSTR Identifiler Plus PCR Amplification Kit, cat# 4440211).
Flow cytometry
Human PBMCs were purified from the buffy coat from donors in the sensitive, partially sensitive, and resistance groups on the basis of their sensitivity to CCRT (n = 5) through density gradient centrifugation using Ficoll’s method and suspended in Roswell Park Memorial Institute-1640 medium (31800105, ThermoScientific, Waltham, MA, USA) at a density of 2 × 10⁶ cells/mL.
A multicolor flow cytometry protocol was applied to characterize the immune cell subtypes of PBMCs. In detail, 5 × 10⁵ PBMCs were reacted with antibodies (1:1000) against CD45 (phycoerythrin, 13-0459-82, ThermoScientific, USA), CD4 (fluorescein isothiocyanate, 11-0049-42, ThermoScientific, USA), CD8 (Alexa Fluor 488, 53-0086-42, ThermoScientific, USA), Foxp3 (Alexa Fluor 647, IC8970R, Novus Biologicals, Centennial, CO, USA), Interleukin (IL)-2 (allophycocyanin, 17-7029-82, ThermoScientific, USA), IL-4 (PE–cyanine 7, 25-7049-82, ThermoScientific, USA), and IL-17 (biotin, 209-306-B32, ThermoScientific, USA). Relevant data were acquired using a BD FACSCanto II flow cytometer (BD Biosciences, Franklin Lakes, NJ, USA) and FlowJo v10 (FlowJo LLC., Ashland, OR, USA). The percentage of different immune cell subtypes was accordingly calculated.
Cell culture and intervention
The Hela cell line (BNCC342189), an adenocarcinoma of human cervical epithelial tissue, was ordered from BeiNa Culture Collection, Beijing, China. It was cultured at a concentration of 2 × 10⁶ cells/mL and reinoculated every 48 h. The Hela cell line was kept in high-sugar Dulbecco’s modified Eagle medium (11965084, ThermoScientific), 10% FBS (10099158, ThermoScientific, Waltham, MA, USA), and 1% penicillin–streptomycin (15070063, ThermoScientific, Waltham, MA, USA) in a 37°C thermostat (Thermo Forma, Marietta, OH, the USA) in 5% CO2 and 95% humidity. Cells were STR characterized and tested negative for mycoplasma. All experiments were performed under the same culture conditions. For subsequent assays, CC cells were treated with cisplatin (2 μg/mL, S1552, Beyotime, Shanghai, China) or cocultured with M2 macrophages from human PBMCs for 24 h.[29]
The small interfering RNA (siRNA) and overexpression plasmid of RGS2 were ordered from GenePharma (Shanghai, China) and applied for transfection with the help of the Lipofectamine 3000 transfection reagent (L3000-001, ThermoScientific, Waltham, MA, USA). All cells were harvested after 48 h for subsequent analysis (the sequencing results of the RGS2 messenger RNA [mRNA] regions and plasmid vectors targeted by the siRNA sequences are shown in Supplementary Material 1). RGS2 levels were then calculated to determine overexpression or knockdown efficiency.
Cell migration and invasion assay
CC cells under the indicated interventions were seeded into a Transwell chamber (8 μm, CLS3422, MerckSigma, Darmstadt, Germany) added with 200 μL of serum-free culture medium and precoated with thawed Matrigel matrix (C0383, Beyotime, Shanghai, China). Meanwhile, 700 μL of complete culture medium with 10% bovine calf serum was supplemented into the lower chamber. After 48 h of culture, cotton swabs were used to remove the cells remaining in the upper Transwell chamber, while those in the lower chamber were serially fixed in methanol (494437, MerckSigma, Darmstadt, Germany) for 15 min and dyed with 0.1% crystal violet staining solution (V5265, MerckSigma, Darmstadt, Germany) for 30 min. The numbers of migrated/invaded cells were finally observed under an inverted microscope (CKX53, Olympus Corporation, Tokyo, Japan).
Cell cycle analysis
CC cells in different groups were fixed by 70% ethanol (E7148, MerckSigma, Darmstadt, Germany) and incubated in 100 μL of propidium iodide solution (500 μg/mL, 537060, MerckSigma, Darmstadt, Germany) in a dark room for 15 min. A BD FACSCanto II flow cytometer (BD Biosciences, Franklin Lakes, NJ, USA) was applied for cell cycle analysis, and the data concerning the percentages of cells in different cycles were processed with FlowJo v10 software (FlowJo LLC., Ashland, OR, USA).
Cell viability analysis
CC cells were seeded into a 96-well plate at a density of 2000 cells/well at 37℃ with 5% CO2. The supernatant in each well was then replaced with a medium containing 10 μL of cell counting kit-8 (CCK-8) working solution (96992, MerckSigma, Darmstadt, Germany). Cells in each group were additionally cultured in an incubator at 37℃ with 5% CO2 for the required time. Absorbance at 450 nm was measured using an enzyme marker (ThermoScientific, Varioskan Flash, the USA), and cell viability was quantified accordingly.
Real-time quantitative polymerase chain reaction (qPCR) analysis
Total RNA was isolated with the help of TRIzol RNA extraction reagent (15596026, ThermoScientific, Waltham, MA, USA), and a spectrophotometer (A51119700DPC, ThermoScientific, Waltham, MA, USA) was applied to read the purity and quantity of the separated RNA. Next, a complementary DNA (cDNA) synthesis kit (D7178S, Beyotime, Shanghai, China) was applied to synthesize cDNA from 1 μg of total RNA for subsequent qPCR analysis by applying SYBR Green qPCR Mix (D7260, Beyotime, Shanghai, China) and a CFX384 Touch real-time PCR thermocycler (Bio-Rad) with the parameters as follows: 95℃ for 2 min (predenaturation) and 40 cycles at 95℃ for 15 s (denaturation) and at 60℃ for 30 s (extension). Glyceraldehyde-3-phosphate dehydrogenase (GAPDH) is an enzyme in the glycolytic reaction. It is widely distributed in the cells of various tissues. It is abundant in cells, accounting for 10–20% of total proteins. The GAPDH gene has a highly conserved sequence. It is a housekeeping gene that shows a high expression in virtually all tissues, with the protein expression of GAPDH in the same cell or tissue generally being constant without being influenced by inducing substances containing partial recognition sites and phospholipids. Therefore, GAPDH was chosen as the housekeeping gene for qPCR analysis. The relative expression of all mRNAs was normalized using the expression of the housekeeping gene and assayed by the 2−ΔΔCT method,[30] wherein target gene expression is reported as an fold change in the normalized signal relative to the GAPDH gene. Table 1 listed the primers used for this assay for reference.
| Gene | Primers (5'–3') | |
|---|---|---|
| Forward | Reverse | |
| TLR3 | GCGCTAAAAAGTGAAGAACTGGAT | GCTGGACATTGTTCAGAAAGAGG |
| TLR7 | CTTTGGACCTCAGCCACAACCA | CGCAACTGGAAGGCATCTTGTAG |
| TLR9 | TGAGCCACAACTGCATCTCGCA | CAGTCGTGGTAGCTCCGTGAAT |
| IFNG | GAGTGTGGAGACCATCAAGGAAG | TGCTTTGCGTTGGACATTCAAGTC |
| IL-6 | AGACAGCCACTCACCTCTTCAG | TTCTGCCAGTGCCTCTTTGCTG |
| IL-17 | CGGACTGTGATGGTCAACCTGA | GCACTTTGCCTCCCAGATCACA |
| IL-4 | CCGTAACAGACATCTTTGCTGCC | GAGTGTCCTTCTCATGGTGGCT |
| IL10 | TCTCCGAGATGCCTTCAGCAGA | TCAGACAAGGCTTGGCAACCCA |
| CCL2 | AGAATCACCAGCAGCAAGTGTCC | TCCTGAACCCACTTCTGCTTGG |
| COX2 | CGGTGAAACTCTGGCTAGACAG | GCAAACCGTAGATGCTCAGGGA |
| PGE2 | CCTTCAAGGTTCTGTGCTCAGC | CATCAGCTTAGCTGGACACTGC |
| RGS2 | CTCTACTCCTGGGAAGCCCAAA | TTGCTGGCTAGCAGCTCGTCAA |
| GAPDH | GTCTCCTCTGACTTCAACAGCG | ACCACCCTGTTGCTGTAGCCAA |
TLR (3, 7, and 9): Toll-like receptor (3, 7, and 9), CCL2: Chemokine (CC-motif) ligand 2, COX2: Cyclooxygenase-2, PGE2: Prostaglandin E2, IFNG: Interferon-gamma, IL (4, 6, 17, and 10): Interleukin (4, 6, 17, and 10), RGS2: Regulator of G-protein signaling 2, GAPDH: Glyceraldehyde-3-phosphate dehydrogenase, A: Adenine, C: Cytosine, G: Guanine, T: Thymine.
Immunoblotting analysis
Samples were rinsed twice with PBS then lysed with radioimmunoprecipitation assay (89901, ThermoScientific, Waltham, MA, USA) lysate containing 1% phenylmethylsulfonyl fluoride (36978, ThermoScientific, Waltham, MA, USA) and 2% phosphatase inhibitor (78443, ThermoScientific, Waltham, MA, USA). The same amount of protein in each sample was separated through 12% sodium dodecyl sulfate–polyacrylamide gel electrophoresis. The separated proteins were then moved to a polyvinylidene fluoride (PVDF, MerckSigma, GE10600023, Darmstadt, Germany) membrane. This PVDF membrane was electrophoresed with phosphatidylinositol 3-kinase (PI3K, 1/2000 dilution, #4292, Cell Signaling Technology, Danvers, MA, USA), phospho-PI3K (p-PI3K, 1/2000 dilution, NBP3-13116, Novus Biologicals, Centennial, Colorado, USA), protein kinase B (AKT, 1/1000 dilution, #4685, Cell Signaling Technology, Danvers, MA, USA), phospho-AKT (1/1000 dilution, #4060, Cell Signaling Technology, Danvers, MA, USA), signal transducer and activator of transcription 6 (STAT6, 1/1000 dilution, #5397, Cell Signaling Technology, Danvers, MA, USA), phospho-STAT6 (1/1000 dilution, #9361, Cell Signaling Technology, Danvers, MA, USA), and the primary antibody to the internal reference GAPDH (1/1000 dilution, #5174, Cell Signaling Technology, Danvers, MA, USA) were incubated overnight at 4°C. After being washed, the PVDF membrane was incubated with goat antirabbit or goat antimouse immunoglobulin G horseradish peroxidase–coupled secondary antibodies (7076S or 7074S, Cell Signaling Technology, Danvers, MA, USA) for 1 h at room temperature. Finally, enhanced chemiluminescence Protein Blotting Reagent (36208ES60, Shanghai Ye Sheng Biotechnology Co., Ltd.) was prepared at a 1:1 ratio for development. LI-COR Odyssey Fluorescence Imaging System (LI-COR Biosciences, Lincoln, NE, the USA) was employed to develop the protein bands. ImageJ (version 5.0, Bio-Rad, Hercules, CA) was employed to process images, and the gray value was calculated. The relative expression of the target protein was shown as the ratio of the gray value of the target band to the gray value of the GAPDH (the internal reference) band.
Statistical analysis
The R package used in this study was from the Bioconductor R project (https://bioconductor.org), and data analysis was performed with R software version 4.1.0 (R Foundation, Vienna, Austria) and GraphPad Prism 8.0.2 (GraphPad Software, San Diego, CA). The Wilcoxon rank–sum test was employed to calculate the difference between two groups of continuous variables. Correlations were calculated using the Spearman method. The normality of the variables was verified with the Shapiro–Wilk test. Values were analyzed through one-way analysis of variance and multiple comparisons were conducted applying Dunnett’s post hoc test. Non-parametric tests were utilized in the case of unequal variances between groups. All measurements were derived from three independent tests and expressed as mean ± standard deviation. Each legend includes a description of each statistical analysis performed. P < 0.05 was denoted a statistical significance for all tests.
RESULTS
DEG analysis
First, the DEGs in patients with late-stage CESC receiving CCRT from GSE56363 and GSE168009 were identified. In accordance with the results, 12 of 21 patients were allocated to the complete response group, wherein 386 downregulated DEGs and 444 upregulated DEGs were selected [Figure 1a]. Next, in the GSE168009 dataset, five of nine patients were assigned to the durable clinical benefit group, which contained 537 DEGs, including 193 downregulated DEGs and 344 upregulated DEGs [Figure 1b]. All these DEGs in the two datasets were visualized and presented in the form of volcano plots. Next, Venny was applied to draw a Venn diagram to intersect the common DEGs of the two datasets, and 56 common DEGs were identified [Figure 1c]. KYOTO Encyclopedia of Genes and Genomes functional enrichment analysis was then conducted on these common DEGs, which were mainly enriched in PI3K–Akt signaling pathway, focal adhesion, protein digestion and absorption, and amoebiasis [Figure 1d].
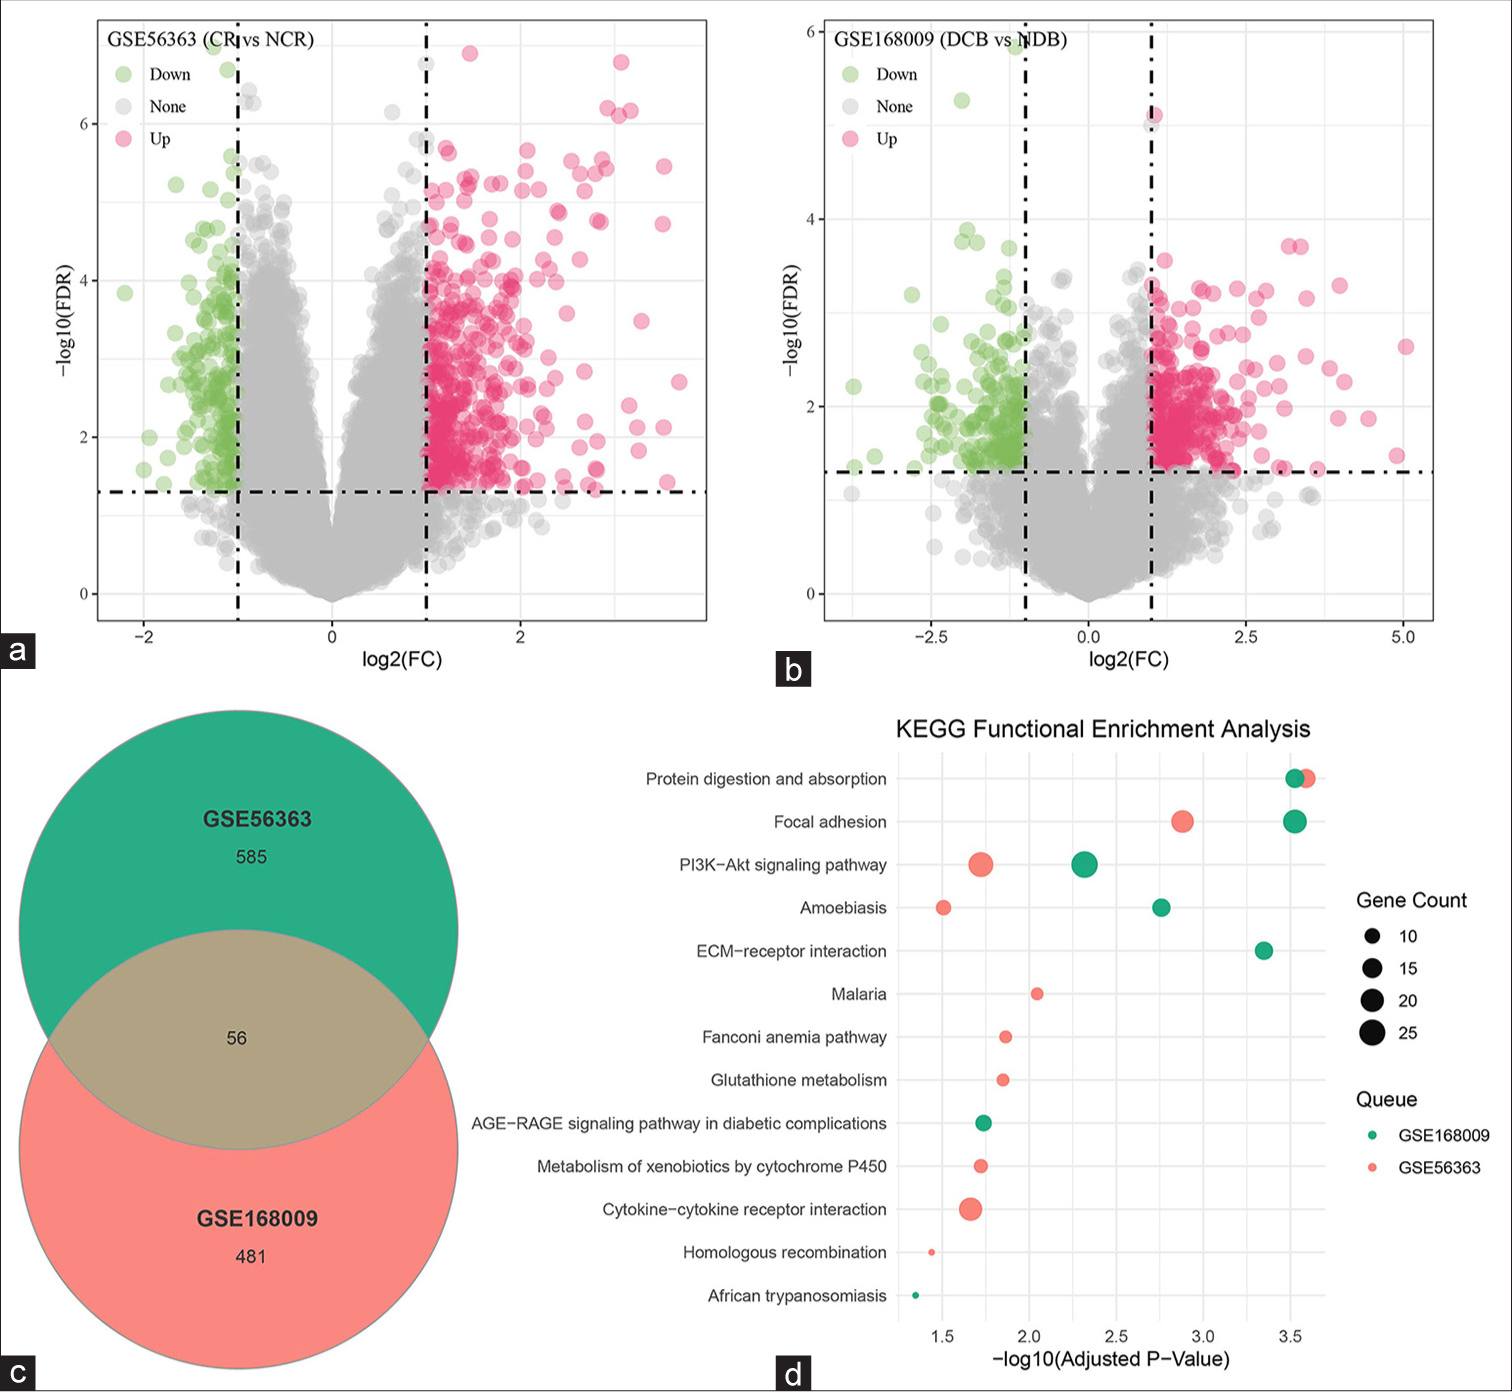
- DEG analysis. (a and b) Analysis of the DEGs in the datasets (a) GSE56363 and (b) GSE168009. (c) Common DEGs in the datasets GSE56363 and GSE168009 identified through Venny. (d) KEGG functional enrichment analysis of the intersecting DEGs. DEGs: Differentially expressed genes, CR: Complete response, NCR: Non-complete response, NDB: No durable benefit, DCB: Durable clinical benefit, KEGG: KYOTO Encyclopedia of Genes and Genomes.
Sorting and validation of CCRT-related biomarkers
In accordance with the prior analysis, 56 common DEGs were identified. They included 21 up-regulated and six down-regulated DEGs that shared consistent trends in the dataset GSE56363 and GSE168009. These 27 DEGs were hereafter applied to sort CCRT-related biomarkers using LASSO regression, SVM-RFE, and random forest analyses. 9, 20, and 19 CCRT-related biomarkers were sorted out through these three analyses [Table 2]. Venny was applied again to intersect common DEGs, and eight common CCRTbiomarkers were then identified [Figure 2a]. The AUC of these eight common biomarkers was calculated on the basis of the relevant ROC curve, and these biomarkers had high AUC values on the training set GSE56363 and validation set GSE168009 [Figure 2b and c], hinting at their predictive value and accuracy.
| LASSO regression analysis (n=9) | SVM-RFE analysis (n=20) | Random forest analysis (n=19) |
|---|---|---|
| ASS1, CD19, CYP2S1, IFI6, ITGB6, KRT79, OSR2, RGS2, WWC1 | ZFP36, OSR2, PPP1R15A, KRT79, HBA2, TTC22, ITGB6, HBA1, CD19, WWC1, RGS2, CYP2S1, GRB14, SCCPDH, KRT15, ASS1, CSTB, KRT13, KRT31, FHOD3 | PPP1R15A, ZFP36, ITGB6, RGS2, KRT79, GRB14, OSR2, WWC1, KRT15, TTC22, FHOD3, HBA2, IFI6, CD19, HBA1, ASS1, SERPINB13, SCCPDH, CYP2S1 |
The common biomarkers of the three analyses are shown in bold.
ASS1: Argininosuccinate synthase 1, CD19: Cluster of differentiation 19, CYP2S1: Cytochrome P450 2S1, IFI6: Interferon-α inducible protein 6, ITGB6: Integrin subunit β6, KRT (15, 13, 31, and 79): Keratin (15, 13, 31, and 79), RGS2, Regulator of G-protein Signaling 2, OSR2: Odd-jump-associated transcription factor 2, ZFP36: Zinc finger protein 36, WWC1: WW and C2 domain containing 1 Gene, PPP1R15A: Growth arrest and DNA damage-inducible protein 34, HBA2: Hemoglobin subunit α2 Gene, TTC22: Tetratricopeptide repeat domain 22, HBA1: Hemoglobin subunit α1 Gene, GRB14: Growth factor receptor binding protein 14, SCCPDH: Saccharin dehydrogenase (presumed), CSTB: Cystatin B, FHOD3: Formic acid–containing homology 2 structural domain 3, CCRT: Concurrent chemotherapy and radiotherapy, LASSO: Least absolute shrinkage and selection operator, SVM-RFE: Support vector machines recursive feature elimination.
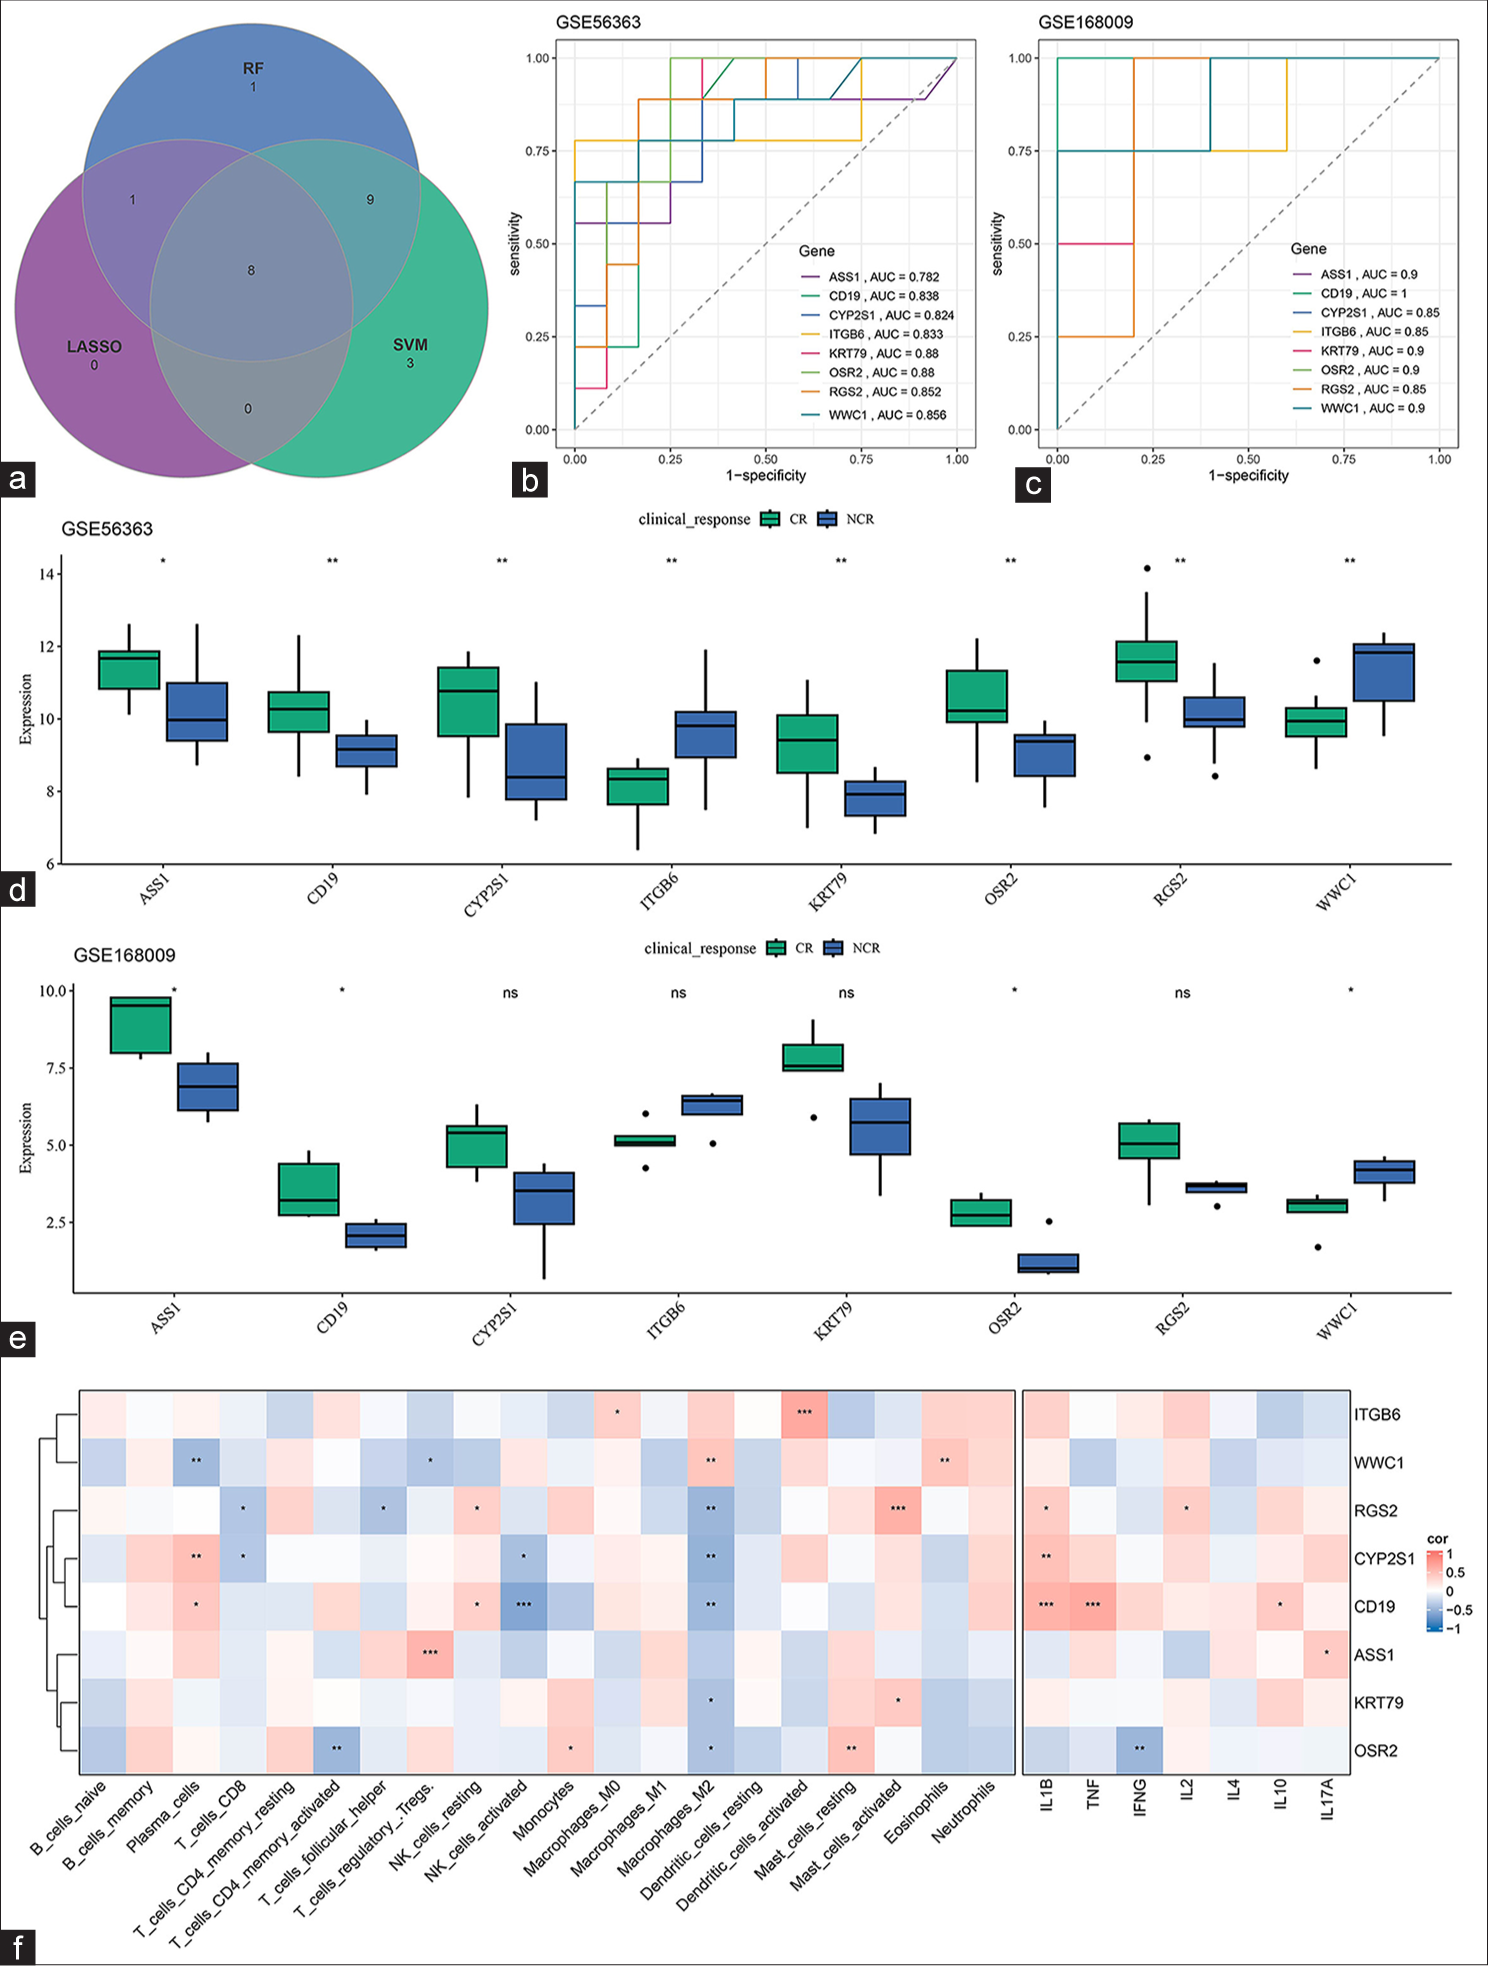
- Sorting and validation of CCRT-related biomarkers. (a) Common CCRT-related biomarkers in the GSE56363 dataset sorted on the basis of LASSO regression, SVM-RFE, and random forest analyses. (b and c) ROC curve of the common CCRT-related biomarkers in the (b) GSE56363 and (c) GSE168009 datasets. (d and e) Differential expression of the common CCRT-related biomarkers in different groups of patients. (f) Correlation of the common CCRT-related biomarkers and different types of immune cells. ns: Not significant, P > 0.05; ✶P < 0.05; ✶✶P < 0.01; ✶✶✶P < 0.001. CCRT: Concurrent chemotherapy and radiotherapy, LASSO: Least absolute shrinkage and selection operator, SVM-RFE: Support vector machines recursive feature elimination, ASS1: Argininosuccinate synthase 1, CD19: Cluster of differentiation 19, CYP2S1: Cytochrome P450 2S1, ITGB6: Integrin subunit β6, KRT 79: Keratin 79, OSR2: Odd-jump-associated transcription factor 2, WWC1: WW and C2 domain containing 1 gene, RGS2, Regulator of G-protein signaling 2, TNF: Tumor necrosis factor, IFNG: Interferon-gamma, IL (1B, 2, 4, 17A, and 10): Interleukin (1B, 2, 4, 17A, and 10), AUC: Area under the ROC curve, SVM: Support vector machine, RF: Random forest, CR: Complete response, LASSO: Least absolute shrinkage and selection operator, NCR: Non-complete response, ROC: Receiver operating characteristic.
Furthermore, comparison of the differential expression of the eight biomarkers in the different groups of patients in these two datasets demonstrated the significantly differential expression levels of ASS1, CD19, OSR2, and WWC1 in these groups [Figure 2d and e]. In addition, the correlation of these biomarkers with immune cells was determined to explore their potential effects in the tumor immune microenvironment. Most of these biomarkers were significantly negatively correlated with M2 macrophage cells. In particular, RGS2 and CD19 were correlated with most immune cells [Figure 2f].
Single-cell landscape in CESC
After filtering, standardization, principal component analysis PCA downscaling, uniform manifold approximation and projection (UMAP) dimension reduction, and unsupervised clustering, nine main cell subpopulations were characterized from GSE208653 and annotated on the basis of the relevant markers [Figure 3a and b]: T cells (CD2 and CD3D), epithelial cells (epithelial cell adhesion molecule, and keratin 18), neutrophils (colony-stimulating factor 3 receptor), macrophages (Lysozyme, Complement C1q subcomponent A, and Complement C1q subcomponent B), plasma cells (marginal zone B1 and immunoglobulin heavy constant gamma 1), fibroblasts (liabilities under management, core proteoglycan, and collagen type I alpha 1 chain), mast cells (trypsinogen activation peptide stimulates protease activated receptor 2, trypsinogen activation peptide stimulates protease activated receptor 1, and carboxypeptidase A3), B cells (membrane-spanning 4–domain family, subfamily A and cluster of differentiation 79A (CD79A)), and endothelial cells (Von Willebrand factor and Plasma membrane vesicle–associated protein) [Figure 3c], (P < 0.05).
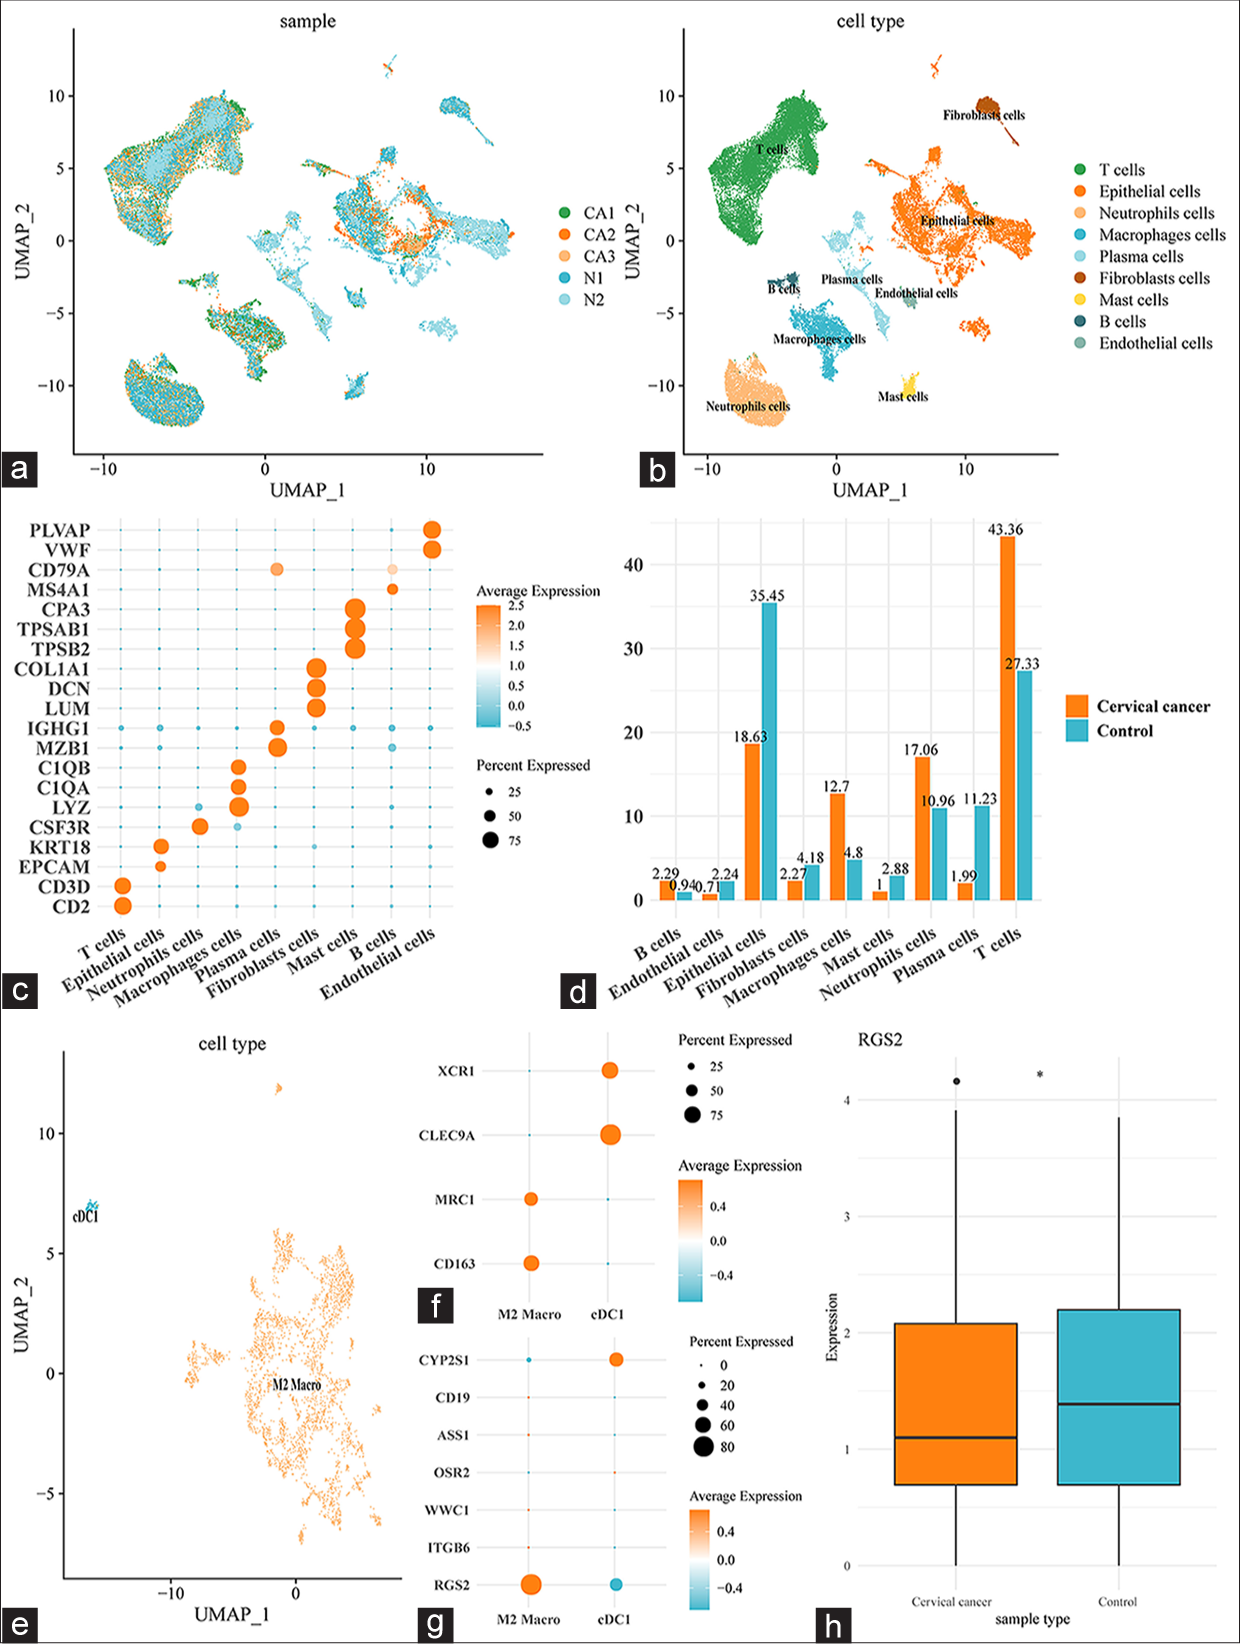
- Single-cell landscape in CESC. (a) The different cell subpopulations of different samples were shown in UMAP plot. (b) The annotated cell subpopulations were shown in UMAP plot. (c) Bubble plot illustrating the different markers specific to the annotated cell subpopulations. (d) Percentage of different cell subpopulations in CESC and normal cervical tissue samples. (e) UMAP plot depicting the subclusters of macrophage cells. (f) Bubble plot of the expression of the specific marker genes of the subclusters of macrophage cells. (g) Bubble plot showing the expression of CCRT-related biomarkers in the subclusters of macrophage cells. (h) RGS2 expression in M2 macrophages in different types of samples. ✶P < 0.05. CD (1, 19, 3D, 136, and 79A): Cluster of differentiation (1, 19, 3D, 136, and 79A), CYP2S1: Cytochrome P450 2S1, ITGB6: Integrin subunit β6, KRT 18: Keratin 18, OSR2: Odd-jump-associated transcription factor 2, WWC1: WW and C2 domain containing 1 gene, RGS2: Regulator of G-protein signaling 2, EPCAM: Epithelial cell adhesion molecule, CSF3R: Colony stimulating factor 3 receptor, LYZ: Lysozyme, C1Q (A and B): Complement C1q subcomponent (A and B), MZB1: Marginal zone B1, IGHG1: Immunoglobulin heavy constant gamma 1, LUM: Liabilities under management, DCN: Core proteoglycan, COL1A1: Collagen type I alpha 1 chain, TPSB2: Trypsin-like enzymes 2, TPSAB1: Trypsinogen activation peptide stimulates protease activated receptor 2, CPA3: Carboxypeptidase A3, MS4A1: Membrane-spanning 4–domain family, subfamily A, VWF: Von Willebrand factor, PLVAP: Plasma membrane vesicle–associated protein, CESC: Cervical squamous cell carcinoma, CCRT: Concurrent chemotherapy and radiotherapy.
In addition, the percentages of these nine cell subpopulations in CESC and normal cervical tissue samples were compared. T cells (43.36%), epithelial cells (18.63%), neutrophils (17.06%), and macrophages (12.7%) were mainly present in CESC tissues, whereas epithelial cells (35.45%), T cells (27.33%), plasma cells (11.23%), and neutrophils (10.96%) were seen in normal cervical tissues [Figure 3d]. In consideration of the abnormally high percentage of macrophages in CESC tissues, the specific effects of the macrophages were further analyzed and two main subclusters were discovered: cDC1 (showing higher XCR1 and CLEC9A gene expression levels than other subclusters) and M2 macro (showing higher MRC1 and CD163 gene expression levels than other subclusters) [Figure 3e and f]. Subsequently, the expression levels of eight CCRT-related biomarkers in these two subclusters were compared, and RGS2 was seen to be expressed at higher levels in M2 macrophages than in the cDC1 subcluster [Figure 3g] and at low levels in M2 macrophages in CESC samples [Figure 3h], (P < 0.05). These pieces of evidence hint at the potential involvement of RGS2 in immunoregulation and immune response in CESC.
Immune cell subpopulation analysis
The percentages of different immune cell subpopulations in PBMCs from candidates, including those who were sensitive, partially sensitive, and resistant to CCRT, were then evaluated. PBMCs were accordingly collected and subjected to flow cytometry to distinguish these subpopulations [Figure 4a]. Thereafter, the percentages of these subpopulations were quantified, and the percentages of M1 macrophages (P < 0.01), CD8 T cells (P < 0.01), T helper 1 cells (P < 0.001), and T helper 17 cells (P < 0.001) were found to be lower in CCRT-resistant candidates than in CCRT-sensitive participants, whereas those of M2 macrophages (P < 0.001), CD4 T cells (P < 0.01), T helper 2 cells (P < 0.001), and regulatory T cells (P < 0.001) were observed to be high [Figure 4b-i].
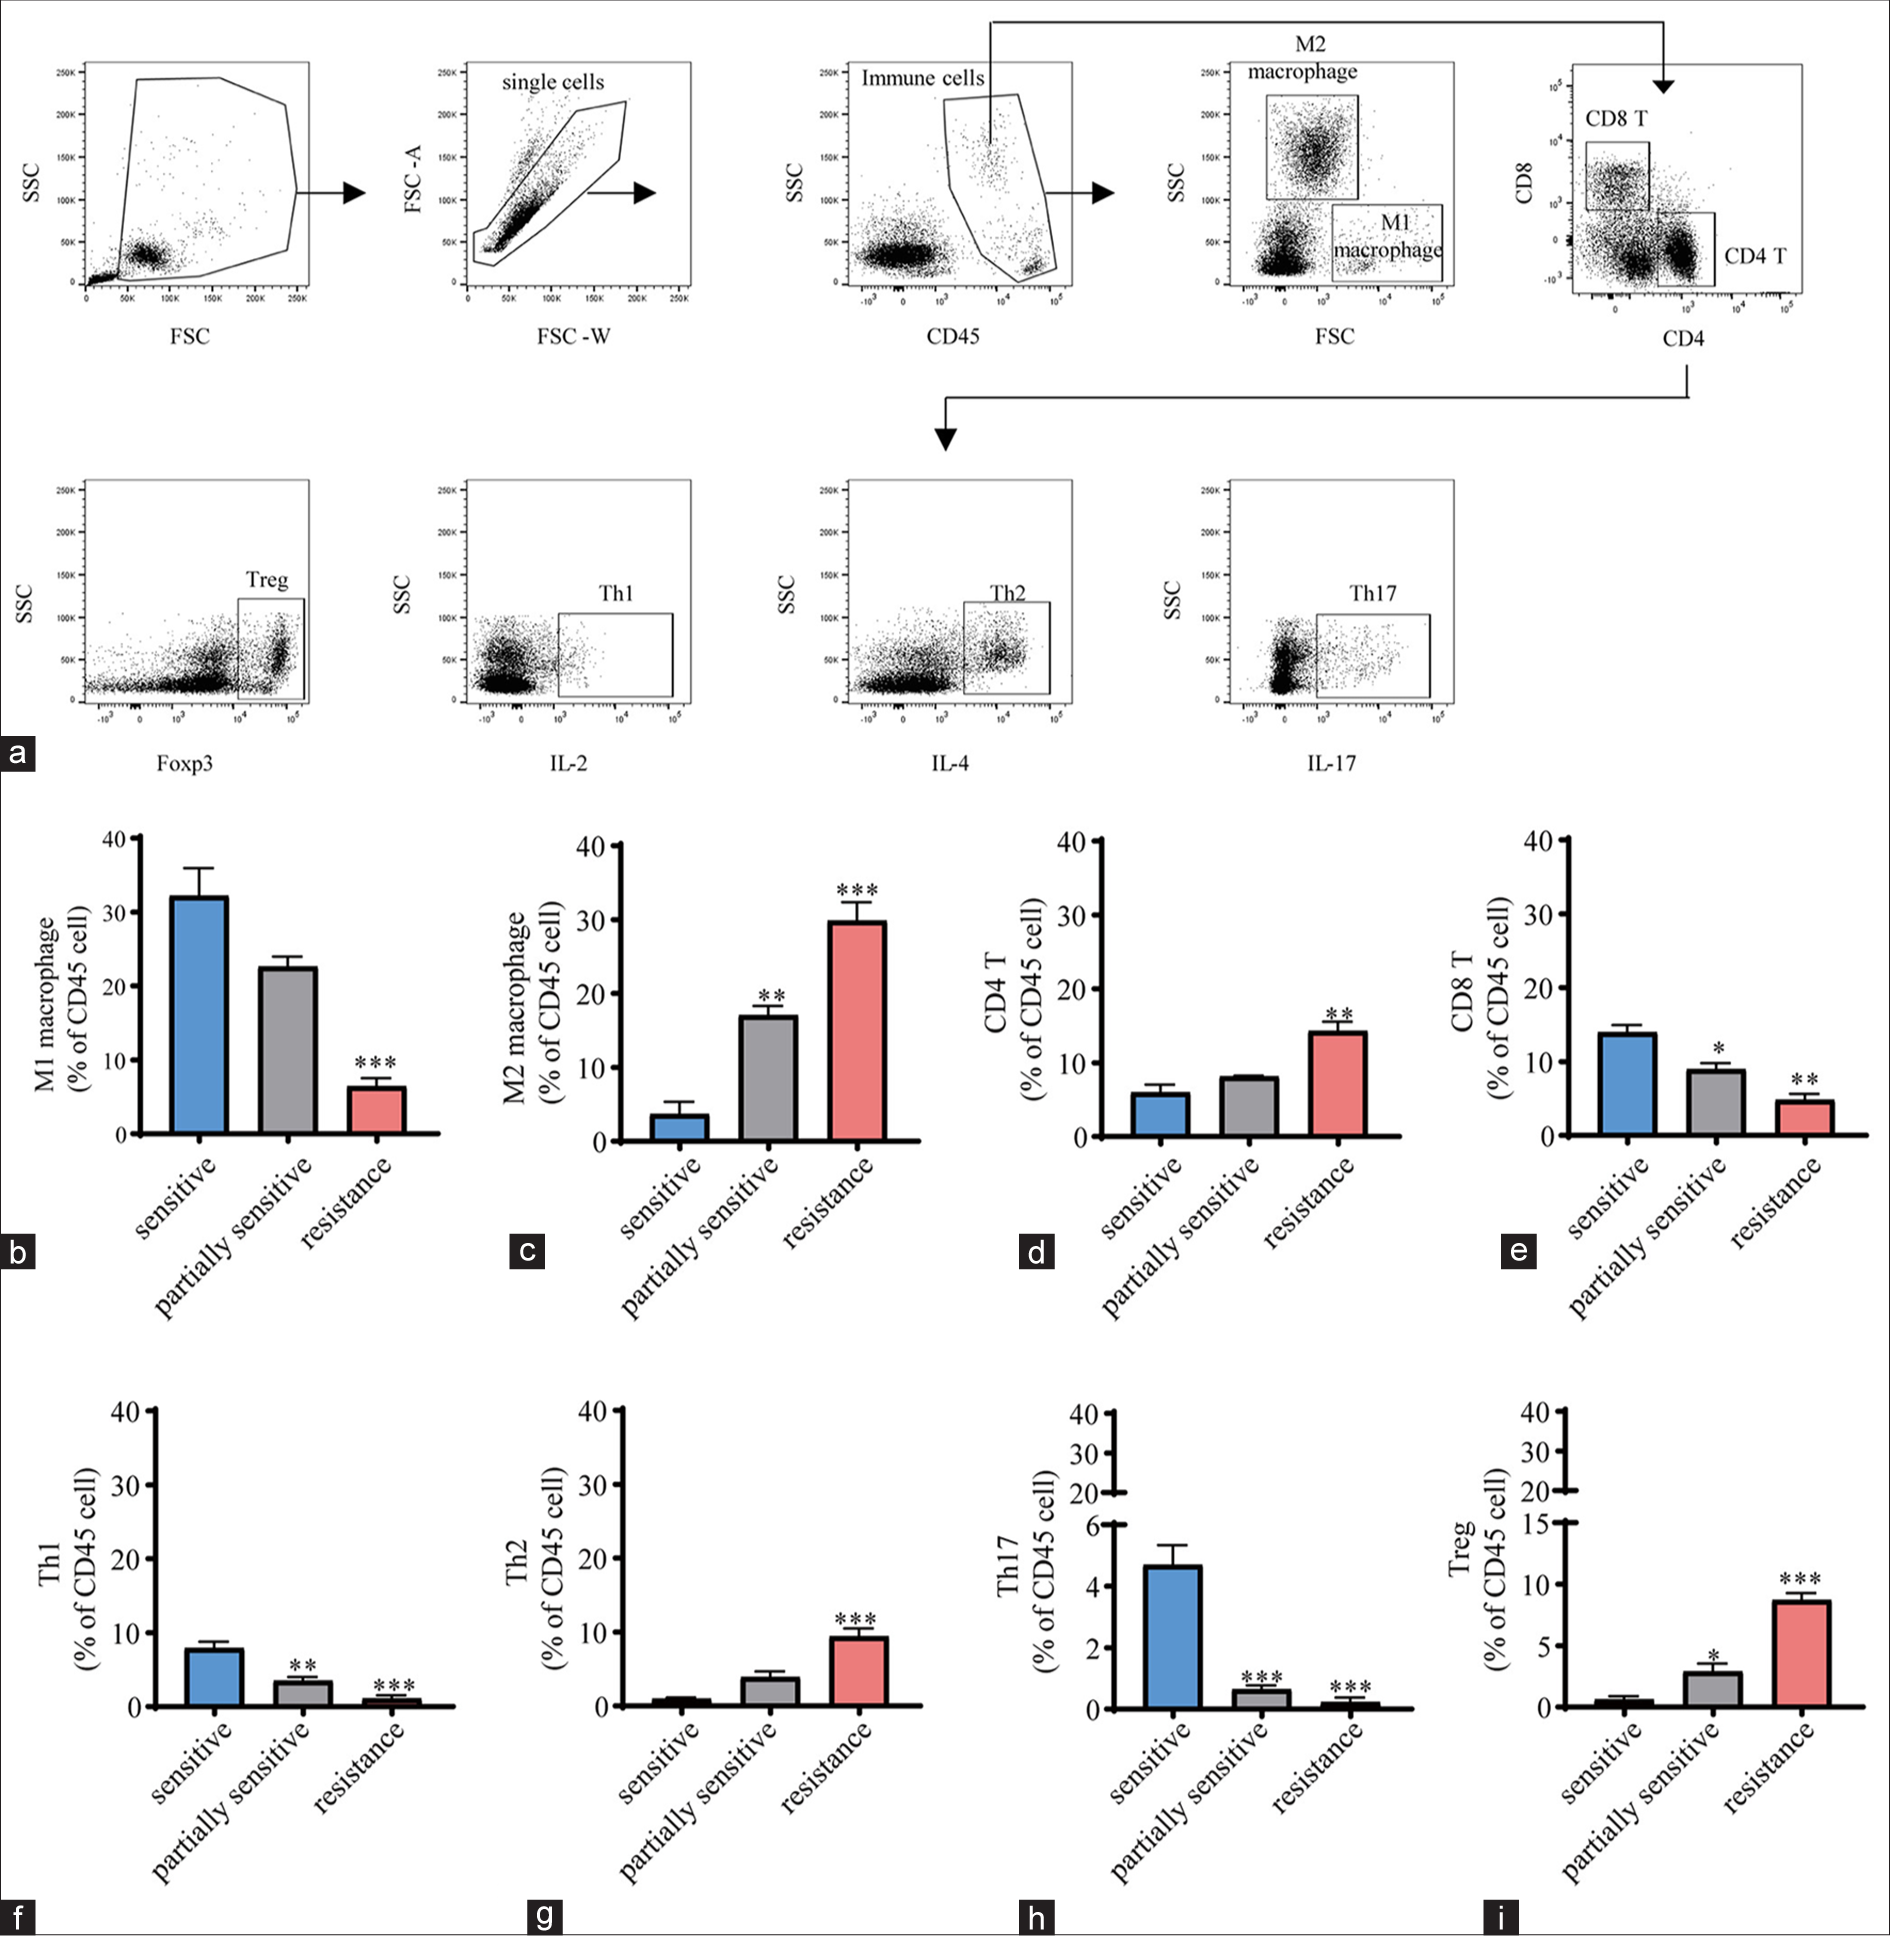
- Immune cell subpopulation analysis. (a) Flow chart of flow cytometry for characterizing the immune cell subpopulations in PBMCs. After panel performance was validated, gating strategies were devised to calculate cell frequencies. Double-stranded bodies were excluded from the total cell population using forward scatter width (FSC-W)versus forward scatter area (FSC-A) plots. After excluding debris, monocytes were gated using side scatter (SSC) with CD45 dot plots. Only single cells were captured, erythrocytes were removed, and live CD45-positive (CD45+) cells were captured. Dead cells and debris were excluded on the basis of FSC/SSC properties, bimodality and aggregation were eliminated using different FSC signals, and counting bead contamination was excluded if necessary. For the panel, lymphocytes were gated in accordance with size (FSC) and particle size (SSC), and this gate was used for subsequent cell frequency assessment. The cell surface markers CD4, CD8 Foxp3, IL-2, IL-4, and IL-17 were employed to identify major immune cell subpopulations. (b-i) Percentages of different immune cell subpopulations, including (b) M1 macrophages, (c) M2 macrophages, (d) CD4 T cells, (e) CD8 T cells, (f) Th1cells, (g) Th2 cells, (h) Th17 cells, and (i) regulatory T cells, in PBMCs from candidates who were sensitive, partially sensitive, and resistant to CCRT (n = 5 for each group). All data are presented as mean ± standard deviation. ✶P < 0.05; ✶✶P < 0.01; ✶✶✶P < 0.001. CD (45, 4, and 8): Cluster of differentiation (45, 4, and 8). IL (2, 4, and 17): Interleukin (2, 4, and 17), Th1: T helper 1 cells, Th2: T helper 2 cells, Th17: T helper 17 cells, Treg: Regulatory T cells, Foxp3: Forkhead box protein P3, PBMCs: Peripheral blood mononuclear cells.
Analysis of immune-mediator cell subpopulations
The expression levels of the mediators relevant to these subpopulations were quantified. In CCRT-resistant candidates, toll-like receptor (TLR) family members, including TLR3/7/9, reduced [Figure 5a-c], (P < 0.01), concurrent with the decrease in interferon gamma (IFNG) [Figure 5d], (P < 0.001), and the IL family members IL-6 and IL-17 [Figure 5e and f], (P < 0.05). Meanwhile, the other two IL family members IL-4 and IL-10 showed higher expression in CCRT-resistant candidates than in CCRT-sensitive candidates [Figure 5g and h], (P < 0.01). Lower mRNA expression of chemokine ligand 2 (CCL2) [Figure 5i], (P < 0.05) and cyclooxygenase-2 (COX2)–prostaglandin E2 (PGE2) was also observed in CCRT-resistant candidates [Figure 5j and k], (P < 0.01).
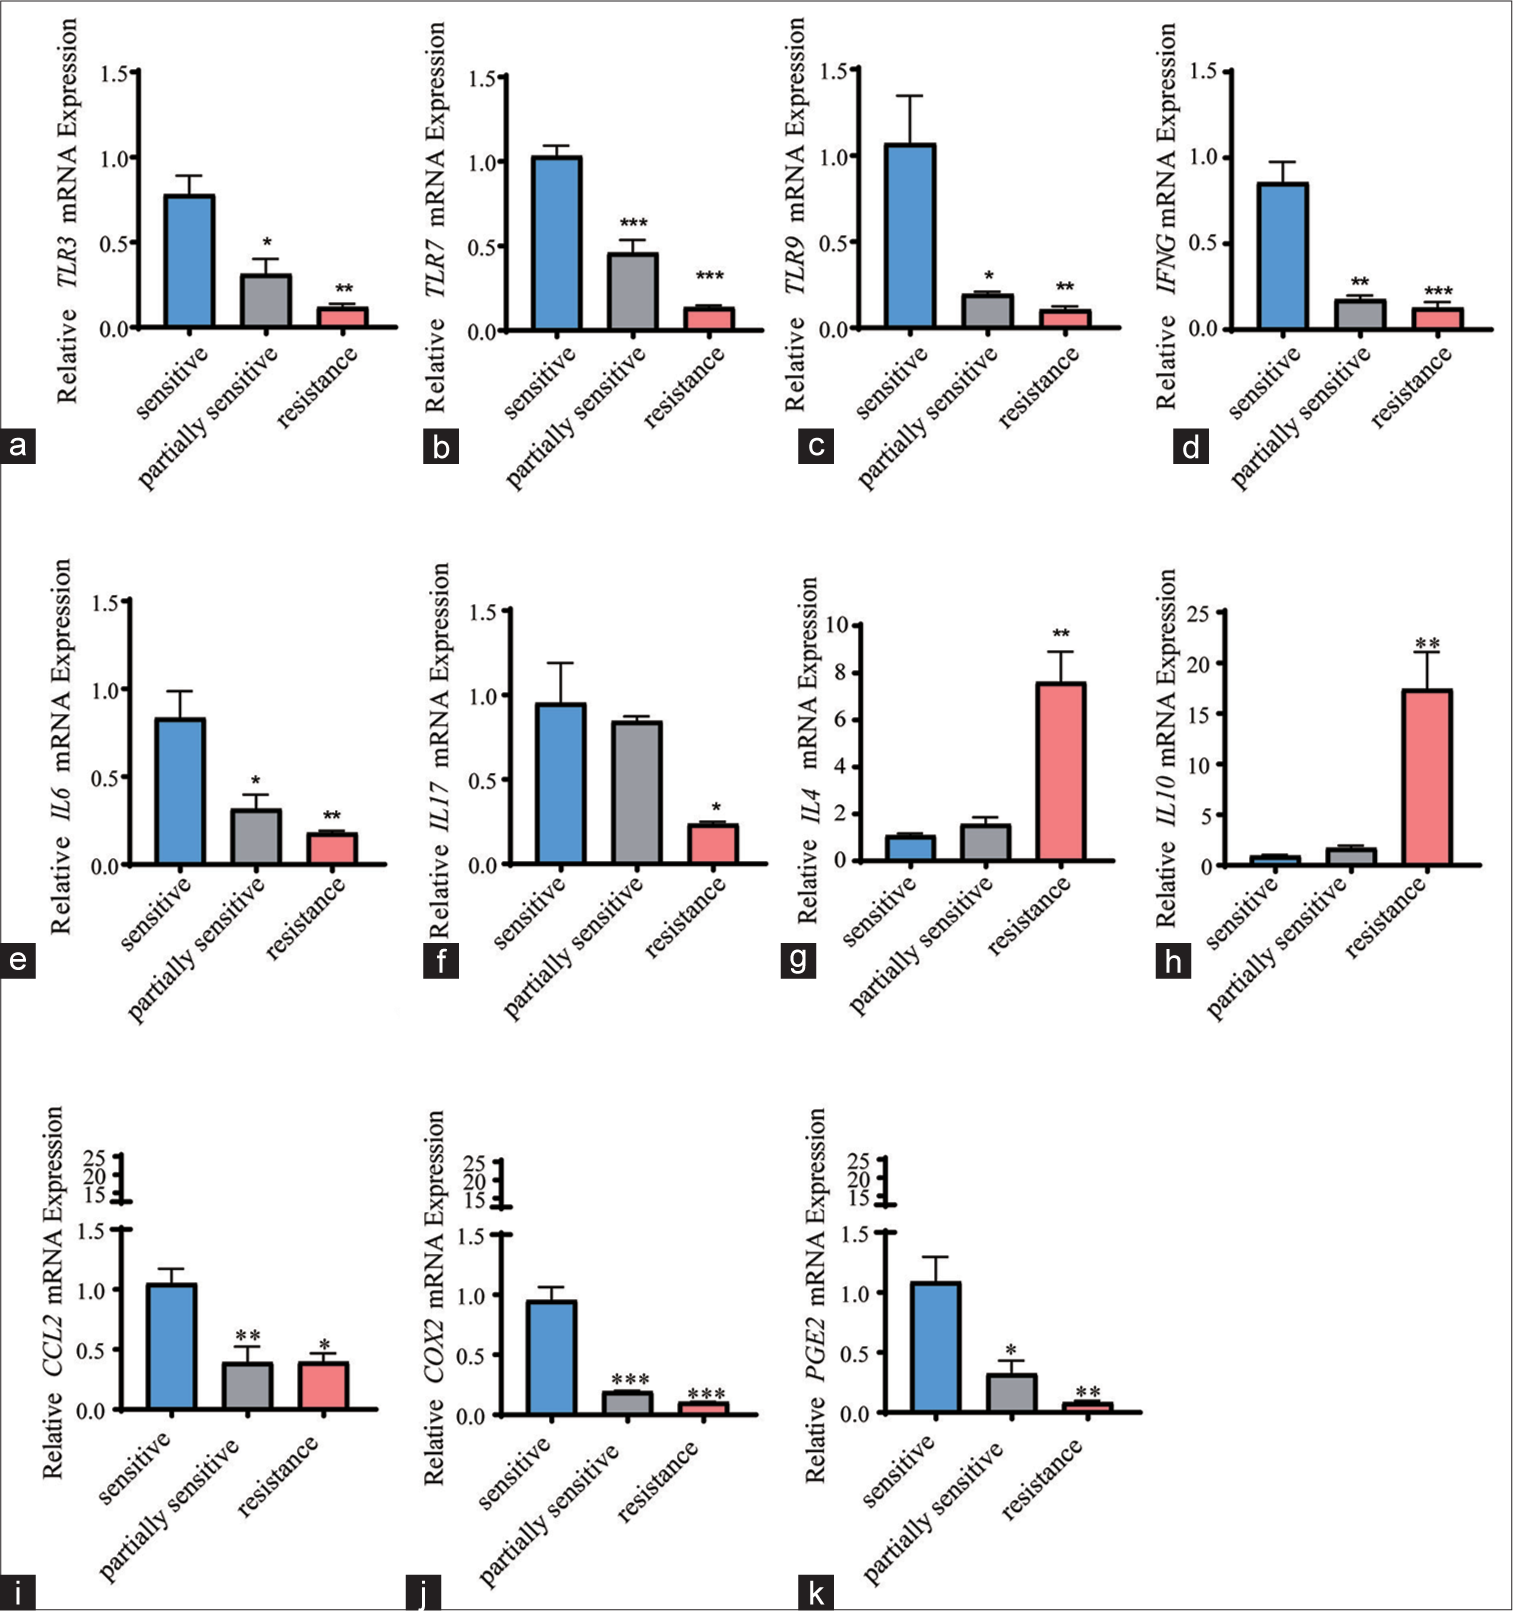
- Quantification of immune cell–specific mediators. (a-k) Quantified expression levels of immune cell–specific mediators, including (a) TLR3, (b) TLR7, (c) TLR9, (d) IFNG, (e) IL-6, (f) IL-17, (g) IL-4, (h) IL-10, (i) CCL2, (j) COX2, and (k) PGE2 in PBMCs from candidates who were sensitive, partially sensitive, and resistant to CCRT (n = 5 for each group). All data are presented as mean ± standard deviation. P < 0.05 was regarded as statistically significant for all tests. ✶P < 0.05; ✶✶P < 0.01; ✶✶✶P < 0.001. TLR (3, 7, and 9): Toll-like receptor (3, 7, and 9), IFNG: Interferon-gamma, IL (4, 6, 17, and 10): Interleukin (4, 6, 17, and 10), CCL2: Chemokine (CC-motif) ligand 2, PGE2: Prostaglandin E2, COX2: Cyclooxygenase-2, PBMCs: Peripheral blood mononuclear cells.
Exploration of the effects of M2 macrophages and cisplatin on the malignant phenotype of CC cells
The effects of cisplatin and M2 macrophages on the malignant phenotypes of CC cells were additionally explored through the Transwell migration/invasion assay [Figure 6a-d], flow cytometry [Figure 6e and f], and CCK-8 assays [Figure 6g] as needed. According to the relevant results of the Transwell migration/invasion assay, the number of migrated and invaded cells diminished under cisplatin intervention [Figure 6a-d], (P < 0.05) but increased in CC cells cocultured with M2 macrophages [Figure 6a-d], (P < 0.05). Flow cytometry for cell cycle analysis showed that cisplatin treatment led to cell cycle G1 arrest [Figure 6e and f], (P < 0.01). However, this effect was not observed when CC cells were cocultured with M2 macrophages [Figure 6e and f], (P < 0.05). Moreover, the CCK-8 assay results revealed that the viability of CC cells was evidently suppressed by cisplatin intervention [Figure 6g], (P < 0.01) but was promoted by M2 macrophage coculture [Figure 6g], (P < 0.01).

- Exploration of the effects of M2 macrophages and cisplatin on the malignant phenotype of CC cells. (a-d) Transwell migration/invasion assay showing the effects of cisplatin and M2 macrophages on the migration and invasion of CC cells (magnification, ×100; scale bar, 200 µm). (e and f) Flow cytometry evaluating the effects of cisplatin and M2 macrophages on the cell cycle of CC cells. (g) CCK-8 assay unveiling the effects of cisplatin and M2 macrophages on the survival of CC cells. Compared with the control group. T2 and T4 groups were compared. All data are presented as mean ± standard deviation. ✶ means P < 0.05; ✶✶ and ## means P < 0.01; ✶✶✶ means P < 0.001; ✶✶✶✶ mean s P < 0.0001. T1: Con, T2: Cisplatin, T3: M2, T4: Cisplatin+M2, CC: Cervical cancer.
Effects of M2 macrophages and cisplatin on specific mediators in CC cells
The expression levels of the aforementioned mediators in CC cells were additionally calculated following intervention with cisplatin or coculture with M2 macrophages. It was found that the levels of TLR family members, the IL family members IL-6 and IL-17, CCL2, and COX2–PGE2 were upregulated in cisplatin-treated CC cells [Figure 7a-k], (P < 0.01), whereas those of the IL family members IL-4 and IL-10 appeared to be downregulated without a statistically significant difference [Figure 7a-k]. Opposite trends, including the diminished expression levels of TLR family members, the IL family members IL-6 and IL-17, CCL2, and COX2–PGE2, as well as the enhanced expression levels of IL-4 and IL-10, were seen in CC cells cocultured with M2 macrophages [Figure 7a-k], (P < 0.05).

- Effects of M2 macrophages and cisplatin on specific mediators in CC cells. (a-k) Quantified expression levels of immune cell–specific mediators, including (a) TLR3, (b) TLR7, (c) TLR9, (d) IFNG, (e) IL-6, (f) IL-17, (g) IL-4, (h) IL-10, (i) CCL2, (j) COX2, and (k) PGE2 in CC cells treated with cisplatin or cocultured with M2 macrophages. Compared with the control group, ✶P < 0.05, #P < 0.05. Cisplatin and Cisplatin+M2 groups were compared. All data are presented as mean ± standard deviation. ✶ and # means P < 0.05; ✶✶ and ## means P < 0.01; ✶✶✶ and ### means P < 0.001; ✶✶✶✶ and #### means P < 0.0001. TLR (3, 7, and 9): Toll-like receptor (3, 7, and 9), IFNG: Interferon-gamma, IL (4, 6, 17, and 10): Interleukin (4, 6, 17, and 10), CCL2: Chemokine (CC-motif) ligand 2, PGE2: Prostaglandin E2, COX2: Cyclooxygenase-2, CC: Cervical cancer.
Effects of RGS2 on the PI3K/AKT/STAT6 axis in M2 macrophages
Finally, the effects of RGS2 on the PI3K/AKT/STAT6 axis in M2 macrophages were preliminarily explored. RGS2 overexpression (oe-RGS2) and RGS2 silencing (si-RGS2) plasmids were constructed to transfect cells. qPCR and immunoblotting revealed that the mRNA and protein levels of RGS2 were significantly altered after knockdown or overexpression [Figure 8a-c], (P < 0.05), suggesting that the efficiency of oe-RGS2 or knockdown was high. The results of immunoblotting revealed that si-RGS2 caused the visible increase in PI3K/AKT/STAT6 phosphorylation [Figure 8b and c], (P < 0.05), whereas oe-RGS2 could contribute to the reduced PI3K/AKT/STAT6 phosphorylation in M2 macrophages [Figure 8b and c], (P < 0.05).
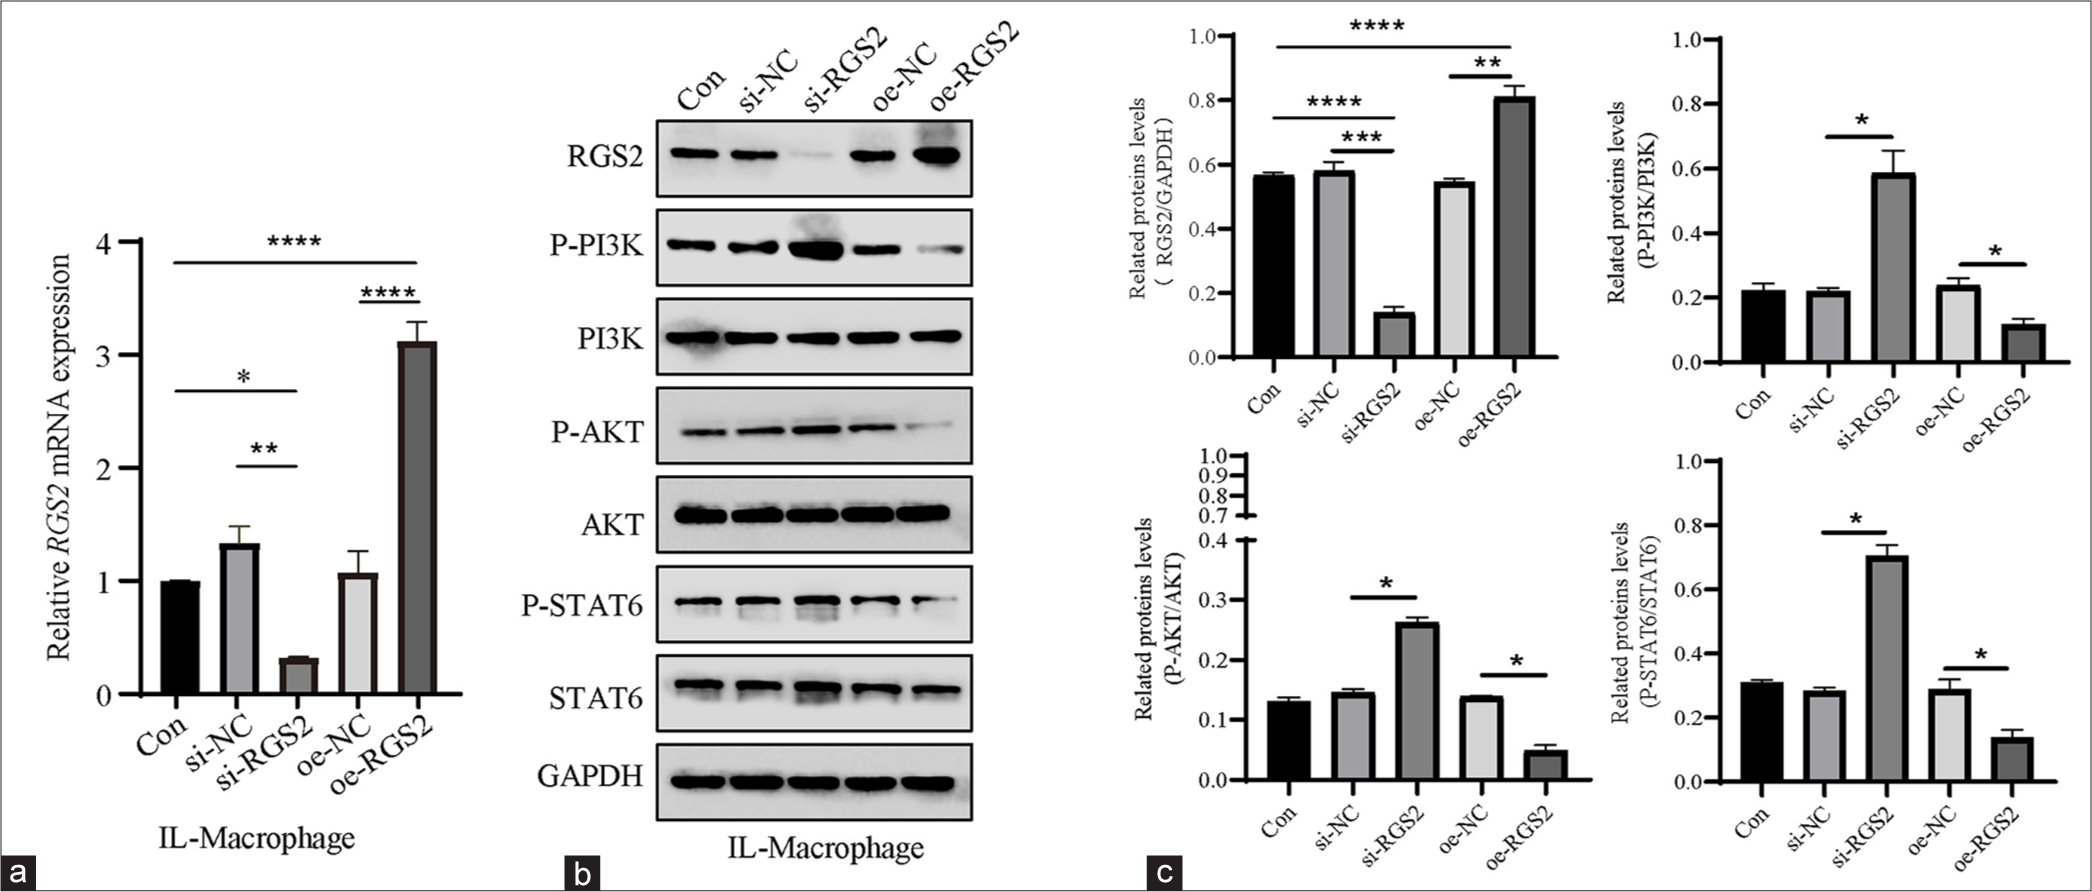
- Effects of RGS2 on the PI3K/AKT/STAT6 axis in M2 macrophages. (a) qPCR confirmed the efficiency of oe-RGS2 and si-RGS2. (b and c) Phosphorylation levels of PI3K, AKT, and STAT6 in M2 macrophages following the overexpression or silencing of RGS2. All data are presented as mean ± standard deviation. ✶P < 0.05; ✶✶P < 0.01; ✶✶✶P < 0.001; ✶✶✶✶P < 0.0001. RGS2: Regulator of G-protein signaling 2, PGE2: Prostaglandin E2, AKT: Protein kinase B, PI3K: Phosphatidylinositol-3 kinase, oe-RGS2: RGS2 overexpression, si-RGS2: RGS2 silencing, qPCR: Quantitative polymerase chain reaction, STAT6: Signal transducer and activator 6.
DISCUSSION
The current research preliminarily explored CCRT-related biomarkers and their potential involvement in CESC. Following the relevant bioinformatics analyses, RGS2 was revealed and identified as a potential CCRT-related candidate gene that is worthy of future examination and exploration.
RGS2 is a member of the protein family participating in the G protein cycle, which has been suggested to be involved in cancer pathology.[31,32] For example, RGS2 could coordinate with the inhibitor of the long non-coding RNA hypoxia inducible factor 1 subunit alpha at the translational level to repress the translation of programmed cell death ligand 1 (PD-L1).[33] Furthermore, RGS2-mediated translational control can mediate cancer cell dormancy and tumor relapse.[32] Notably, RGS2 has been uncovered to be prognostic in prostate cancer resistant to castration.[34] While examining the specific effects of RGS2 on cancer cells, it was noted that RGS2 could inhibit the growth of breast cancer cells in a manner dependent on monocyte chemotactic protein-induced protein 1 and suppress the growth of melanoma cells through targeting the MAPK and AKT pathways.[35,36] Another scRNA-seq analysis has revealed RGS2 as one of the upregulated genes in vitro ibrutinib-treated myeloid-derived suppressor cells from melanoma patients.[37] These evidences have thus laid great foundation on the involvement of RGS2 in cancer cells. Despite this, the specific involvement of RGS2 in CC (including CESC) remains largely unknown. Here in our present study, with the purpose of exploring the CCRT-relevant biomarkers in CESC, the datasets GSE56363 and GSE168009 were firstly applied and the relevant DEGs in both datasets were obtained to intersect the common DEGs. Functional enrichment analysis hinted at the enrichment of DEGs in some CC-relevant pathways, such as focal adhesion, the PI3K/AKT signaling pathway, amoebiasis, protein digestion, and absorption. LASSO regression, SVM-RFE, and random forest analyses were then applied to further narrow down the CCRT-relevant biomarkers in CESC. Eight biomarkers, including RGS2, were accordingly obtained, and the relevant analyses additionally proved the negative correlation between RGS2 and M2 macrophages. In addition, our scRNA-seq analysis has suggested that RGS2 was higher expressed in M2 macrophage compared to another subpopulation cDC1 yet lower expressed in M2 macrophage from CC patients in comparison with that from normal control. These pieces of evidence therefore prove the potential implication of RGS2 in M2 macrophages in CESC.
The multidrug resistance of tumor cells to treatment modalities remains a current challenge, and recent study revealed the crucial role of the tumor microenvironment (TME) in drug resistance. As a complicated and ever-changing “organ,” the TME consists of stroma and immune cells. It can utilize malignant cells to nurture an environment favoring tumor cell growth.[38] Current studies have already demonstrated that the TME is crucial in supporting tumor phenotypes through a complex intercellular communication system through classical paracrine signaling loops of cytokines or direct cell-cell contact.[39] While attempting to link the TME with scRNA-seq in the context of CC, Guo et al.[40] observed the gradual transition of immune cells exhibiting positive immune responses, dysregulation, and exhaustion, as well as an immune-suppressive microenvironment. Li et al. also revealed a subset of cancer stem cells that are associated with the developmental hierarchy of tumor progression in CC.[41] Moreover, naïve CD4+ T cells and M0 macrophages are two highly plastic cell populations identified in scRNAseq analysis and have been found to be related to prognosis and clinical phenotypes. In our current scRNA-seq analysis, nine main cell subpopulations were identified on the basis of the GSE208653 dataset, wherein macrophages, in particular, were shown to be present at a high percentage in CC tissues, hinting at their potential implication in the initiation and progression of CC. Similarly, in another study exploring the potential cellular pathogenesis mechanisms during cervical carcinogenesis, macrophages were recognized to be the tumor-promoting element.[42] The TME in cancer has been documented to actively reprogram macrophage metabolism and affect the macrophage polarization.[43,44] On the basis of our current analysis, macrophages were further divided into two subculsters, namely, M2 macrophages and cDC1. M2 macrophages have been long established as essential in facilitating the metastasis of tumors and augmenting the drug resistance of tumors.[45] Notably, M2 macrophages could upregulate PD-L1 levels in CC cells through the PI3K/AKT pathway.[46] In our present study, we additionally confirmed that CC cells cocultured with M2 macrophages manifested a pro-survival and pro-metastasis phenotypes in vitro, as well as the cell cycle G1 reentry. Relevant results from the qPCR have further suggested that M2 macrophage could promote the levels of IL-4 and IL-10 yet repress those of TLR family members such as TLR3/7/9, IL family members IL-6 and IL-17, and CCL2 as well as COX2-PGE2 in CC cells. Activation of the PI3K/Akt pathway is essential for limiting pro-inflammatory responses and promoting anti-inflammatory responses in TLR-stimulated macrophages.[47] PI3K activation has been reported to be a necessary step to achieve M2 activation in macrophages in response to surface-active protein A or IL-4.[48] In SHIP-deficient macrophages, IL-4-induced M2 macrophage activation requires cross-talk between STAT6 and PI3K.[48] M2 activation requires Akt activation because inhibition of Akt represses upregulation of the M2 gene.[49,50] Some signals, such as bone morphogenetic protein-7, transforming growth factor-β, and IL-10, enhance M2 polarization through PI3K/Akt signaling.[51,52] Moreover, the PI3K/AKT pathway has been suggested to mediate signals from receptors and converge inflammatory signals to modulate macrophage response and the subsequent activation phenotype, and STAT6 is a prerequisite for the M2 polarization of macrophages.[53] In accordance with the immunoblotting results of our study, si-RGS2 contributed to the increased phosphorylation of PI3K/AKT/STAT6 in macrophages, whereas oe-RGS2 did the opposite. These discoveries hence hint at the potential role of RGS2 in M2 macrophages. Nevertheless, additional relevant studies are encouraged to be performed to complete the specific effects of RGS2 in M2 macrophages in CC.
Several limitations in the present work should be pointed out. First, its results on the role of M2 macrophages in CCRT resistance are based on in vitro experiments only. The translation of these results to in vivo models or clinical settings was not addressed. This situation may limit the generalizability of our findings. Additional in vivo and in vitro experiments, as well as clinical studies, are required for validation. Second, the predictive value of RGS2 has not been verified in clinical trials. The correlation between RGS2 expression and CCRT efficacy was extrapolated from cell line studies and bioinformatics analyses, which may not accurately reflect the complexity of human disease. Future studies are needed to validate these findings in clinical patients with CESC. Moreover, our study relied on a small number of samples for flow cytometry and cell culture experiments. In addition, it lacked diversity in patient demographics, which may affect its external validity. Therefore, additional validation by multicenter randomized controlled trials with large sample sizes, adequate follow-up, and high quality is needed. However, we must address that the above limitations do not diminish the reliability of the present conclusions because our discoveries clearly show the potential role of RGS2 expression in M2 macrophages in CESC and its potential to be considered as a promising method for treating CESC.
SUMMARY
Our study demonstrated that RGS2 expression in CESC is an independent prognostic marker in patients with CCRT. RGS2 in M2 macrophages regulates CESC proliferation, migration, and invasion through the PI3K/AKT/STAT6 pathway, leading to poor clinical outcomes. si-RGS2 contributes to increased PI3K/AKT/STAT6 phosphorylation in macrophages, whereas oe-RGS2 does not. This finding suggests that RGS2 may be a potential therapeutic target for precision medicine. The present study may help reduce CCRT resistance in CESC and provide new therapeutic targets for this malignancy.
AVAILABILITY OF DATA AND MATERIALS
The datasets generated during and analyzed during the present study are available from the corresponding author on reasonable request.
ABBREVIATIONS
AKT: Protein kinase B
AUC: Area under the curve
CC: Cervical cancer
CCL2: Chemokine (CC-motif) ligand 2
CCRT: Concurrent chemotherapy and radiotherapy
CESC: Cervical squamous cell carcinoma
COX2: Cyclooxygenase-2
CR: Complete response to CCRT
DCB: Durable clinical benefit
DEGs: Differentially expressed genes
DMEM: Dulbecco’s modified Eagle’s medium
FC: Fold change
FDR: False discovery rate
GAPDH: Glyceraldehyde-3-phosphate dehydrogenase
HPV: Human papillomavirus
IFNG: Interferon-gamma
IL: Interleukin
KEGG: KYOTO Encyclopedia of Genes and Genomes
MCPIP1: Monocyte chemotactic protein-induced protein 1
MDR: Multidrug resistance
NCR: Non-complete response to CCRT
NDB: No durable benefit
p-AKT: Phospho-AKT
PBMCs: Peripheral blood mononuclear cells
PD-L1: Programmed cell death ligand 1
PFS: Progression-free survival
PGE2: Prostaglandin E2
PI3K: Phosphatidylinositol 3-kinase
p-PI3K: Phospho-PI3K
p-STAT6: Phospho-STAT6
qPCR: Quantitative PCR
RGS: Regulator of G-protein signaling
ROC: Receiver operating characteristics
scRNA-seq: Single-cell RNA sequencing
siRNA: Small interfering RNA
STAT6: Signal transducer and activator of transcription 6
SVM-RFE: Support vector machines recursive feature elimination
Th1: T helper 1 cells
Th17: T helper 17 cells
Th2: T helper 2 cells
TIME: Tumor immune microenvironment
TLR: Toll-like receptor
TME: Tumor microenvironment
Treg: Regulatory T cells
ACKNOWLEDGMENT
Not applicable.
AUTHOR CONTRIBUTIONS
YL and JX: Study conception and design and data collection; XF.Z: Analysis and interpretation of results; YL and LL: Draft manuscript. All authors reviewed the results and approved the final version of the manuscript. All authors meet ICMJE authorship requirements.
ETHICS APPROVAL AND CONSENT TO PARTICIPATE
The research approved by the Ethics committee of Affiliated Hospital of Zunyi Medical University(No.KLL-2024-455). All the patients who participated in this study signed an informed consent form. The study was conducted in accordance with the Declaration of Helsinki (as revised in 2024).
CONFLICS OF INTEREST
The authors declare no conflict of interest.
EDITORIAL/PEER REVIEW
To ensure the integrity and highest quality of CytoJournal publications, the review process of this manuscript was conducted under a double-blind model (authors are blinded for reviewers and vice versa) through an automatic online system.
FUNDING: This project was supported by the Doctoral Start-up Fund of the Affiliated Hospital of Zunyi Medical University (zc220220901).
References
- Hsa_Circ_0000021 sponges miR-3940-3p/KPNA2 expression to promote cervical cancer progression. Curr Mol Pharmacol. 2024;17:e170223213775.
- [CrossRef] [PubMed] [Google Scholar]
- Flashback foreword: Concurrent chemotherapy/radiotherapy for cervical cancer. J Clin Oncol. 2023;41:4603-4.
- [CrossRef] [PubMed] [Google Scholar]
- Phase II study of consolidation chemotherapy after adjuvant or primary concurrent chemoradiation using paclitaxel and carboplatin to treat high-risk early-stage or locally advanced cervical cancer. Cancer Res Treat. 2012;44:97-103.
- [CrossRef] [PubMed] [Google Scholar]
- Risk of recurrence, prognosis, and follow-up for Danish women with cervical cancer in 2005-2013: A national cohort study. Cancer. 2018;124:943-51.
- [CrossRef] [PubMed] [Google Scholar]
- Prognostic evaluation of postoperative adjuvant therapy for operable cervical cancer: 10 years' experience of National Cancer Center in China. Chin J Cancer Res. 2017;29:510-20.
- [CrossRef] [PubMed] [Google Scholar]
- A Network medical framework based on inflammatory genes to identify drug candidates for abdominal aortic aneurysms. Curr Mol Pharmacol. 2024;17:e170523216998.
- [CrossRef] [PubMed] [Google Scholar]
- Single-cell landscape highlights heterogenous microenvironment, novel immune reaction patterns, potential biomarkers and unique therapeutic strategies of cervical squamous carcinoma, human papillomavirus-associated (HPVA) and non-HPVA adenocarcinoma. Adv Sci (Weinh). 2023;10:e2204951.
- [CrossRef] [PubMed] [Google Scholar]
- Integrated immunological analysis of single-cell and bulky tissue transcriptomes reveals the role of interactions between M0 macrophages and naïve CD4(+) T cells in the immunosuppressive microenvironment of cervical cancer. Comput Biol Med. 2023;163:107151.
- [CrossRef] [PubMed] [Google Scholar]
- Lumican is a potential predictor on the efficacy of concurrent chemoradiotherapy in cervical squamous cell carcinoma. Heliyon. 2023;9:e18011.
- [CrossRef] [PubMed] [Google Scholar]
- Regulator of G-protein signaling (RGS) proteins as drug targets: Progress and future potentials. J Biol Chem. 2019;294:18571-85.
- [CrossRef] [PubMed] [Google Scholar]
- Regulator of G-protein signaling (RGS) proteins in cancer biology. Biochem Pharmacol. 2009;78:1289-97.
- [CrossRef] [PubMed] [Google Scholar]
- RGS proteins and their roles in cancer: Friend or foe? Cancer Cell Int. 2023;23:81.
- [CrossRef] [PubMed] [Google Scholar]
- New response evaluation criteria in solid tumours: Revised RECIST guideline (version 1.1) Eur J Cancer. 2009;45:228-47.
- [CrossRef] [PubMed] [Google Scholar]
- limma powers differential expression analyses for RNA-sequencing and microarray studies. Nucleic Acids Res. 2015;43:e47.
- [CrossRef] [PubMed] [Google Scholar]
- clusterProfiler: An R package for comparing biological themes among gene clusters. OMICS. 2012;16:284-7.
- [CrossRef] [PubMed] [Google Scholar]
- Integration of scRNA-Seq and TCGA RNA-Seq to analyze the heterogeneity of HPV+ and HPV-cervical cancer immune cells and establish molecular risk models. Front Oncol. 2022;12:860900.
- [CrossRef] [PubMed] [Google Scholar]
- Fast, sensitive and accurate integration of single-cell data with harmony. Nat Methods. 2019;16:1289-96.
- [CrossRef] [PubMed] [Google Scholar]
- CellMarker 2.0: An updated database of manually curated cell markers in human/mouse and web tools based on scRNA-seq data. Nucleic Acids Res. 2023;51:D870-6.
- [CrossRef] [PubMed] [Google Scholar]
- Assessment of alterations in histone modification function and guidance for death risk prediction in cervical cancer patients. Front Genet. 2022;13:1013571.
- [CrossRef] [PubMed] [Google Scholar]
- Construction of ceRNA prognostic model based on the CCR7/CCL19 chemokine axis as a biomarker in breast cancer. BMC Med Genomics. 2023;16:254.
- [CrossRef] [PubMed] [Google Scholar]
- Graph random forest: A graph embedded algorithm for identifying highly connected important features. Biomolecules. 2023;13:1153.
- [CrossRef] [PubMed] [Google Scholar]
- Muller M: pROC: an open-source package for R and S+ to analyze and compare ROC curves. BMC Bioinformatics. 2011;12:77.
- [CrossRef] [PubMed] [Google Scholar]
- Robust enumeration of cell subsets from tissue expression profiles. Nat Methods. 2015;12:453-7.
- [CrossRef] [PubMed] [Google Scholar]
- Gene set enrichment analysis: A knowledge-based approach for interpreting genome-wide expression profiles. Proc Natl Acad Sci U S A. 2005;102:15545-50.
- [CrossRef] [PubMed] [Google Scholar]
- World Medical Association declaration of Helsinki: Ethical principles for medical research involving human participants. JAMA. 2025;333:71-4.
- [CrossRef] [PubMed] [Google Scholar]
- Immune cell subsets and their gene expression profiles from human PBMC isolated by Vacutainer Cell Preparation Tube (CPT™) and standard density gradient. BMC Immunol. 2015;16:48.
- [CrossRef] [PubMed] [Google Scholar]
- Keeping it clean: The cell culture quality control experience at the National Center for Advancing Translational Sciences. SLAS Discov. 2020;25:491-7.
- [CrossRef] [PubMed] [Google Scholar]
- LncRNA MEG3 promotes cisplatin sensitivity of cervical cancer cells by regulating the miR-21/PTEN axis. BMC Cancer. 2022;22:1145.
- [CrossRef] [PubMed] [Google Scholar]
- Analysis of relative gene expression data using real-time quantitative PCR and the 2(-Delta Delta C(T)) method. Methods. 2001;25:402-8.
- [CrossRef] [PubMed] [Google Scholar]
- RGS2: A multifunctional signaling hub that balances brown adipose tissue function and differentiation. Mol Metab. 2019;30:173-83.
- [CrossRef] [PubMed] [Google Scholar]
- RGS2-mediated translational control mediates cancer cell dormancy and tumor relapse. J Clin Invest. 2021;131:136779.
- [CrossRef] [PubMed] [Google Scholar]
- Long noncoding RNA HITT coordinates with RGS2 to inhibit PD-L1 translation in T cell immunity. J Clin Invest. 2023;133:e162951.
- [CrossRef] [PubMed] [Google Scholar]
- RGS2 is prognostic for development of castration resistance and cancer-specific survival in castration-resistant prostate cancer. Prostate. 2020;80:799-810.
- [CrossRef] [PubMed] [Google Scholar]
- RGS2 suppresses breast cancer cell growth via a MCPIP1-dependent pathway. J Cell Biochem. 2015;116:260-7.
- [CrossRef] [PubMed] [Google Scholar]
- RGS2 Suppresses melanoma growth via inhibiting MAPK and AKT signaling pathways. Anticancer Res. 2021;41:6135-45.
- [CrossRef] [PubMed] [Google Scholar]
- Single-Cell RNA-Seq analysis of patient myeloid-derived suppressor cells and the response to inhibition of Bruton's tyrosine kinase. Mol Cancer Res. 2024;22:308-21.
- [CrossRef] [PubMed] [Google Scholar]
- Aspects of the tumor microenvironment involved in immune resistance and drug resistance. Front Immunol. 2021;12:656364.
- [CrossRef] [PubMed] [Google Scholar]
- Extracellular vesicles-mediated intercellular communication: Roles in the tumor microenvironment and anti-cancer drug resistance. Mol Cancer. 2019;18:55.
- [CrossRef] [PubMed] [Google Scholar]
- Spatiotemporally deciphering the mysterious mechanism of persistent HPV-induced malignant transition and immune remodelling from HPV-infected normal cervix, precancer to cervical cancer: Integrating single-cell RNA-sequencing and spatial transcriptome. Clin Transl Med. 2023;13:e1219.
- [CrossRef] [PubMed] [Google Scholar]
- Single-cell transcriptomics reveals the landscape of intra-tumoral heterogeneity and transcriptional activities of ECs in CC. Mol Ther Nucleic Acids. 2021;24:682-94.
- [CrossRef] [PubMed] [Google Scholar]
- The suppression of cervical cancer ferroptosis by macrophages: The attenuation of ALOX15 in cancer cells by macrophages-derived exosomes. Acta Pharm Sin B. 2023;13:2645-62.
- [CrossRef] [PubMed] [Google Scholar]
- Metabolic regulation of macrophage polarization in cancer. Trends Cancer. 2019;5:822-34.
- [CrossRef] [PubMed] [Google Scholar]
- Macrophage polarization states in the tumor microenvironment. Int J Mol Sci. 2021;22:6995.
- [CrossRef] [PubMed] [Google Scholar]
- Targeting GSDME-mediated macrophage polarization for enhanced antitumor immunity in hepatocellular carcinoma. Cell Mol Immunol. 2024;21:1505-21.
- [CrossRef] [PubMed] [Google Scholar]
- M2-type tumor-associated macrophages upregulated PD-L1 expression in cervical cancer via the PI3K/AKT pathway. Eur J Med Res. 2024;29:357.
- [CrossRef] [PubMed] [Google Scholar]
- Cot/tpl2 activity is required for TLR-induced activation of the Akt p70 S6k pathway in macrophages: Implications for NO synthase 2 expression. Eur J Immunol. 2011;41:1733-41.
- [CrossRef] [PubMed] [Google Scholar]
- Alternative activation of macrophages by IL-4 requires SHIP degradation. Eur J Immunol. 2011;41:1742-53.
- [CrossRef] [PubMed] [Google Scholar]
- The TSC-mTOR pathway regulates macrophage polarization. Nat Commun. 2013;4:2834.
- [CrossRef] [PubMed] [Google Scholar]
- Induction of IL-4Rα-dependent microRNAs identifies PI3K/Akt signaling as essential for IL-4-driven murine macrophage proliferation in vivo. Blood. 2012;120:2307-16.
- [CrossRef] [PubMed] [Google Scholar]
- IL-10 inhibits the starvation induced autophagy in macrophages via class I phosphatidylinositol 3-kinase (PI3K) pathway. Mol Immunol. 2011;48:720-7.
- [CrossRef] [PubMed] [Google Scholar]
- SMAD-PI3K-Akt-mTOR pathway mediates BMP-7 polarization of monocytes into M2 macrophages. PLoS One. 2013;8:e84009.
- [CrossRef] [PubMed] [Google Scholar]
- Analysis of IL-4/STAT6 signaling in macrophages. Methods Mol Biol. 2019;1966:211-24.
- [CrossRef] [PubMed] [Google Scholar]