Translate this page into:
Identification of transcription factors associated with the disease-free survival of triple-negative breast cancer through weighted gene co-expression network analysis

Jie Hu

Yixin Qi
*Corresponding authors: Jie Hu, School of Public Health, Hebei Medical University, Shijiazhuang, Hebei Province, China. Hujie@hebmu.edu.cn
Yixin Qi, Department of Breast Center, The Fourth Hospital of Hebei Medical University, Shijiazhuang, Hebei Province, China. qiyixin@hebmu.edu.cn
-
Received: ,
Accepted: ,
How to cite this article: Wang H, Hao R, Liu W, Zhang Y, Ma S, Lu Y, et al. Identification of transcription factors associated with the disease-free survival o f triple-negative breast cancer through weighted gene co-expression network analysis. CytoJournal. 2024;21:71 doi: 10.25259/Cytojournal_127_2024
Abstract
Objective:
Triple-negative breast cancer (TNBC) is a subtype of breast cancer that has a worse prognosis than the other subtypes of breast cancer because of its high recurrence and metastasis rates. The objective of this study is to identify the regulatory factors that are associated with the disease-free survival (DFS) of TNBC and potential biomarkers for TNBC treatment.
Material and Methods:
We obtained the GSE97342 dataset from the Gene Expression Omnibus website and conducted weighted gene co-expression network analysis (WGCNA) to identify modules associated with the DFS of TNBC. Subsequently, biological functions of the modules were elucidated through Gene Ontology (GO) and Kyoto Encyclopedia of Genes and Genomes (KEGG) pathway analyses. Cross-checking with the Human Transcription Factor Database facilitated the selection of hub transcription factors through univariate Cox regression analysis of overlapping transcription factors. Utilizing bioinformatics analysis, we assessed the prognostic significance of these hub transcription factors, investigated their target genes, and explored their associations with tumor immune cells in TNBC. Finally, the expression levels of the hub transcription factors were validated by immunohistochemical staining, quantitative reverse transcription polymerase chain reaction (qRT-PCR), and Western blotting.
Results:
Through WGCNA analysis, we identified three modules correlated with DFS in TNBC. GO and KEGG analyses elucidated the biological functions of genes within these modules. Survival analysis pinpointed three hub transcription factors: Forkhead box D1 (FOXD1), aryl hydrocarbon receptor nuclear translocator 2 (ARNT2), and zinc finger protein 132 (ZNF132). The expression level of FOXD1 was negatively associated with the prognoses of patients with TNBC, whereas the other two genes were positively associated with the prognoses of patients with TNBC. Immunohistochemical staining, qRT-PCR, and Western blotting validated the expression levels of the hub transcription factors.
Conclusion:
We discovered three hub transcription factors (FOXD1, ARNT2, and ZNF132) that were correlated with the DFS of TNBC. These correlations suggested their potential as prognostic predictors for patients with TNBC.
Keywords
Transcription factor
Disease-free survival
Triple-negative breast cancer
Prognosis
INTRODUCTION
Breast cancer, which is a prevalent malignant tumor affecting women globally, exhibits considerable heterogeneity in biological characteristics and clinical outcomes.[1,2] Recent cancer epidemiological data indicate a rising trend in the cases of breast cancer, which has surpassed lung cancer as the most diagnosed cancer worldwide and is the leading cause of cancer-related deaths in women.[3] Consequently, breast cancer has emerged as a public health concern on a global scale. Triple-negative breast cancer (TNBC) is a molecular subtype of breast cancer,[4,5] constituting 10–20% of all breast cancer cases and lacking the expression of estrogen receptor, progesterone receptor, and human epidermal growth factor receptor 2.[6] TNBC is highly aggressive and prone to distant metastasis, and patients with TNBC have an average survival time of approximately 1 year after metastasis or postoperative recurrence.[7,8] Traditional surgical and cytotoxic chemotherapy interventions have shown limited efficacy in improving patient prognosis. As biologically targeted therapies have demonstrated success in treating other cancers, identifying potential therapeutic targets for TNBC has been emphasized in recent years.[9-12]
Considerable research has focused on discovering and exploring transcription factors related to cancer treatment and diagnosis. Transcription factors are a class of proteins that bind to DNA and interfere with the transcription process through specific structural sequences. Many transcription factors, particularly when overactivated, are integral to the development of tumor cells.[13] Some transcription factors can serve as markers for tumor diagnosis, treatment, and prognosis. Tong et al.,[14] proposed that the level of Krüppel-like factor 5 is considerably higher in breast cancer tissues than in adjacent normal tissues, associating it with early recurrence and early death and thus confirming its major role in the growth of breast tumor cells. Wang et al.,[15] confirmed the substantially high expression of paired-like homeodomain transcription factor 1 (PITX1) in breast cancer tissues. PITX1 shows a significant negative correlation with prognosis. Davis et al.,[16] reported that the expression level of forkhead box A1 (FOXA1) in patients with TNBC was significantly lower than in patients without TNBC, suggesting that FOXA1 is a diagnostic indicator for TNBC and may even be an important target for TNBC treatment.
Weighted gene co-expression network analysis (WGCNA) is a biological method that analyzes vast amounts of gene expression data, identifies gene clusters with highly correlated expression levels, and associates them with phenotypic traits.[17] In our study, modules related to disease-free survival (DFS) in patients with TNBC were first identified using WGCNA. The biological functions of genes within each module were determined through Gene Ontology (GO) and Kyoto Encyclopedia of Genes and Genomes (KEGG) analyses. The modules were then intersected separately with the Human Transcription Factor Database (HumanTFDB), and overlapping genes in each module were considered potential transcription factors. Through survival analysis, three potential transcription factors were identified as hub transcription factors. Bioinformatic analysis, immunohistochemical staining, quantitative reverse transcription polymerase chain reaction (qRT-PCR), and Western blotting confirmed the reliability of the identified hub transcription factors.
MATERIAL AND METHODS
Data sources, selection, and preprocessing
We downloaded data from the Gene Expression Omnibus (GEO) website (http://www.ncbi.nlm.nih.gov/geo/ ). The dataset met the following criteria: (1) samples comprising patients with TNBC, (2) number of samples exceeding 15, and (3) clinical features included prognostic information.[18] On the basis of these criteria, we selected GSE97342 as our dataset for analysis. The matrix file for GSE97342 and its associated clinical information were downloaded. The matrix file was converted to a matrix format. The columns represented genes, and the rows represented the samples. Genes with small standard deviations were filtered out, abnormal or outlier samples were excluded, and clinical characterization data were correlated with gene expression. The flowchart of this study is shown in Figure 1. We utilize the online flowcharting software ProcessOn for flowcharting.
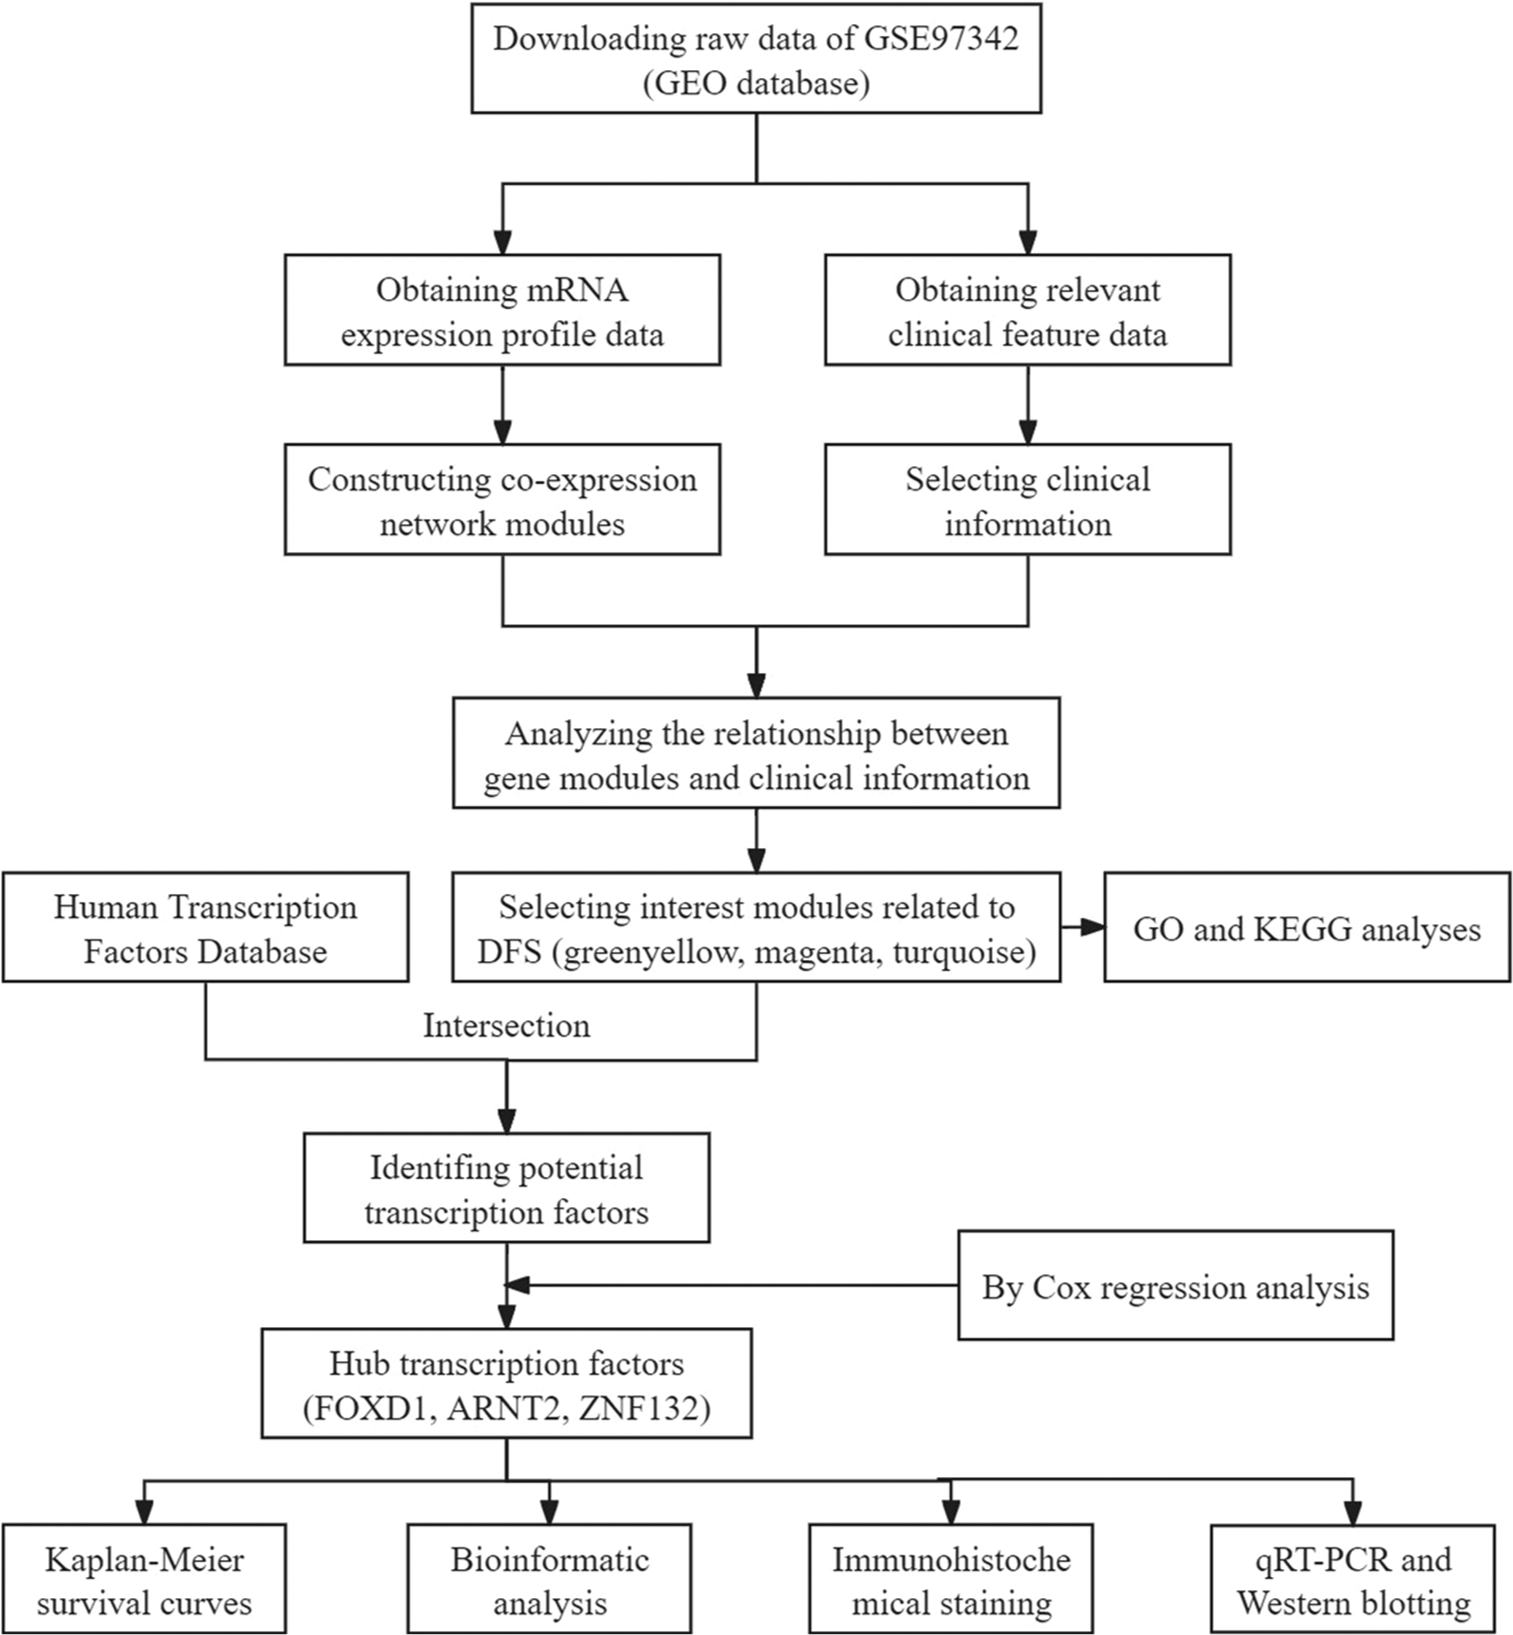
- Workflow for screening modules and transcription factors. (GEO: Gene expression omnibus, DFS: Disease-free survival, GO: Gene ontology, KEGG: Kyoto encyclopedia of genes and genomes, qRT-PCR: Quantitative real-time polymerase chain reaction.)
Network construction and module selection
We used the WGCNA package in R (Ross Ihaka and Robert Gentleman, Auckland, New Zealand) to construct a co-expression network with a one-step method. First, based on the criterion of approximate scale-free topology, we used the pickSoftThreshold function to determine the soft-threshold power β, which enhanced the network’s connectivity. We then constructed co-expression networks using the blockwiseModules function, dividing genes into different modules by setting minModuleSize at 30. Modules were identified through hierarchical clustering and dynamic tree cut, and similar modules were merged (MEDissThres = 0.25). The module eigengene represented the gene expression profile of the entire module. We correlated these eigengenes with clinical variables to find the most relevant modules. Gene significance (GS) referred to the correlation between gene expression and clinical variables, and high GS values indicated strong correlation. Ultimately, we identified modules relevant to the clinical variable DFS, and genes in these modules were extracted for further analysis.
Functional enrichment analysis
We used the online tool Bioinformatics (https://www.bioinformatics.com.cn/ ) for GO and KEGG pathway analyses. GO analysis provided the biological functions of each module, and KEGG analysis identified the signaling pathways associated with each module.
Identification of potential transcription factors by intersection with HumanTFDB
To identify candidate transcription factors, we intersected the obtained modules with HumanTFDB (http://bioinfo.life.hust.edu.cn/AnimalTFDB/#!/ ).[19] The Draw Venn Diagram tool (http://bioinformatics.psb.ugent.be/webtools/Venn/ ) identified overlapped genes, which were considered potential transcription factors.
Survival analysis of potential transcription factors and identification of hub transcription factors
Potential transcription factors within the modules significantly associated with DFS were included in Cox regression models for univariate analysis. Transcription factors with P < 0.05 were identified as hub transcription factors. The hazard ratios (HRs) for these hub transcription factors determined whether they were protective or risk factors for the DFS of patients with TNBC. The Gene Expression Profiling Interactive Analysis 2 (GEPIA2) online tool (http://gepia2.cancer-pku.cn/#index ) was used in drawing Kaplan–Meier survival curves of hub transcription factors.
Bioinformatic analysis
We used university of california santa cruz xena (UCSC XENA) (https://xenabrowser.net/datapages/ )[20] and The Cancer Genome Atlas (TCGA) database (https://cancergenome.nih.gov ) to explore the expression levels of hub transcription factors in breast cancer and other cancers and to analyze receiver operating characteristic (ROC) curves in breast cancer. Four online databases, namely harmonizome (https://maayanlab.cloud/Harmonizome/), Gene Regulatory Network database (GRNdb) (http://grndb.com/ ), ChIP-Atlas (http://chip-atlas.org/ ), and Cistrome Data Browser (http://cistrome.org/db/#/ ), were used in predicting the downstream target genes of hub transcription factors. Expression levels, ROCs, oncogenic effects, and correlations with hub transcription factors were verified. Kaplan–Meier plotter (http://kmplot.com/analysis/ )[21] was used in plotting survival curves, and Tumor Immune Estimation Resource (TIMER) (https://cistrome.shinyapps.io/timer/ ) was used in analyzing immune cell infiltration in tumor tissues.[22,23]
Acquisition of TNBC samples
We retrospectively collected samples from 57 women with TNBC who underwent breast surgery from 2015 to 2017. The patients were followed up regularly after the operation, with 30 patients relapsing and 27 not. Formalin-fixed paraffin-embedded (FFPE) tissues from these patients were sliced into 4–6 μm-thick sections. In addition, we collected 20 fresh pairs of TNBC tissues and matched para-carcinoma tissues. The collection of specimens required the consent of the patients and approval from the Fourth Hospital of Hebei Medical University’s ethics committee. In addition, this study adhered to the principles of the Helsinki Declaration.
Immunohistochemical staining
Immunohistochemical staining was performed to validate the expression levels of the hub transcription factors. FFPE tissue slides were sequentially deparaffinized with xylene (1330-20-7, Sigma-Aldrich, Chengdu, China), hydrated with gradient ethanol (64-17-5, Yongda, Tianjin, China), and placed in citric acid antigen repair solution (YMMY812J, Beyotime, Beijing, China) at a high temperature and pressure. The repaired slides were added with an endogenous peroxidase blocker (ZY1028, Zeye, Shanghai, China) and incubated for 25 min, followed by the addition of the primary antibody (goat anti-forkhead box D1 [FOXD1] polyclonal antibody 1:200, Abcam Company, ab129324, Shanghai, China; rabbit anti-aryl hydrocarbon receptor nuclear translocator 2 [ARNT2] polyclonal antibody 1:100, Absin Company, abs118296, Shanghai, China; rabbit anti-zinc finger protein 132 [ZNF132] polyclonal antibody 1:100, ThermoFisher Company, AB-2649961, Waltham, USA) was added, and incubation was continued at 4°C for at least 12 h. A reaction enhancer (MYZH922, DAKO, Copenhagen, Denmark) was added, the slides were incubated for 20 min at room temperature before the secondary antibody (A-11034, ThermoFisher, Waltham, USA) was added, and incubation was continued for 30 min. Evenly applied the prepared DAB coloration solution (DA1016, Solarbio, Beijing, China) onto the spun-dry slides, observed the color development in real-time under the microscope, and adjusted the color development time based on the intensity of staining. The final step involved using hematoxylin (BBP03941, Biobiopha, Yunnan, China) for staining and scoring the slides.
The scores of the slides were determined by the manual quantitative analysis of 10 randomly selected ×40 high-magnification fields. The scoring method was as follows: (1) percentage of positive cells: 1 for ≤25%, 2 for 26–50%, 3 for 51– 75%, and 4 for >75%; (2) staining intensity: 0 for no staining, 1 for light yellow, 2 for brown-yellow, and 3 for tan; (3) total score was the product of the positive cell rate score and staining intensity score: 0 for negative, 1–4 for weak positive, and 4–12 for strong positive. A score below 6 was considered low expression, whereas a score of 6 or above was considered high expression.[24] Each slide was independently evaluated by two experienced pathologists who had no information about the patients.
RNA extraction and qRT-PCR analysis
Total RNA was extracted from TNBC and paired para-carcinoma tissues with an RNA extraction solution (15596018, TRIzol Reagent, ThermoFisher, Waltham, USA). TransScript One-Step gDNA removal and cDNA synthesis SuperMix reverse transcription kit (PC7002, Fermentas, Beijing, China) was used in synthesizing cDNA. qRT-PCR was performed using a SYBR Green polymerase chain reaction (PCR) kit (RR420A, TaKaRa, Dalian, China) according to the manufacturer’s instructions. Glyceraldehyde-3-phosphate dehydrogenase served as an internal reference, and the 2−ΔΔCt method was used in calculating the relative expression of the transcription factors. Table S1 shows the primer sequences for qRT-PCR.
Extraction of breast tissue protein and western blotting
Six pairs of TNBC and adjacent normal tissues were selected. Approximately 50 mg of tissue was cut and placed in a 1.5 mL eppendorf (EP) tube with 500 μL of RadioImmunoprecipitationAssay (RIPA) lysate (HC1235, Solarbio, Beijing, China) and protease inhibitor (ab146286, Solarbio, Beijing, China). The tissues were homogenized using a tissue grinder (Sangon Biotech, Shanghai, China) on ice. The homogenate was centrifuged, and the supernatant was collected. Protein concentration was determined using a bicinchoninic acid (BCA) protein assay kit (23225, Solarbio, Beijing, China), and the proteins were denatured at 100°C for 5 min and then used for Western blotting. 30 μg of tissue protein was separated by 10% sodium dodecyl sulfate polyacrylamide gel electropheresis (SDS-PAGE) and transferred to a polyvinylidene fluoride (PVDF) membrane (LC2002, ThermoFisher, Waltham, USA). The membrane was blocked with 5% skim milk at room temperature for 1 h, followed by overnight incubation at 4°C with antibodies against FOXD1, ARNT2, and ZNF132 (1:1000, Abcam Company, Shanghai, China). After another round of incubation with the secondary antibodies, the membrane was infiltrated in a 1:1 ratio of developer solutions A and B (IN0005, ZETA life, USA) on a Bio-Rad ChemiDoc™ XRS+ System (BIO-RAD, California, USA) and imaged through automated exposure with the chemiluminescence instrument.
Statistical analysis
Categorical and continuous variables were analyzed using a Chi-square test. Comparisons of data between two groups were made using the Student’s t-test, and comparisons of data between multiple groups were made using analysis of variance. Hazard Ratios for candidate transcription factors were calculated by univariate Cox regression analysis. Kaplan–Meier survival curves were plotted by the “survival” and “survminer” packages in R software. Performed Western blotting band grayscale analysis using Image J software (National Institutes of Health, MD, USA) and then created a bar chart in GraphPad Prism 9.0 (GraphPad Software, CA, USA) software, and P < 0.05 was considered statistically significant.
RESULTS
Data download and preprocessing
GSE97342 dataset was downloaded from the GEO website. First, raw gene expression data were normalized in R using the Fragments per kilobase of exon model per Million mapped fragments (FPKM) approach. Duplicate genes were removed, and the top 5000 genes with the highest standard deviation were selected for the construction of co-expression networks. The 28 TNBC samples in GSE97342 were clustered for the identification of outliers. A hierarchical clustering tree was constructed with a height cutoff value set at 200, and no abnormal specimens were found [Figure 2a]. Finally, 11 clinical features were correlated with gene expression [Figure 2b].
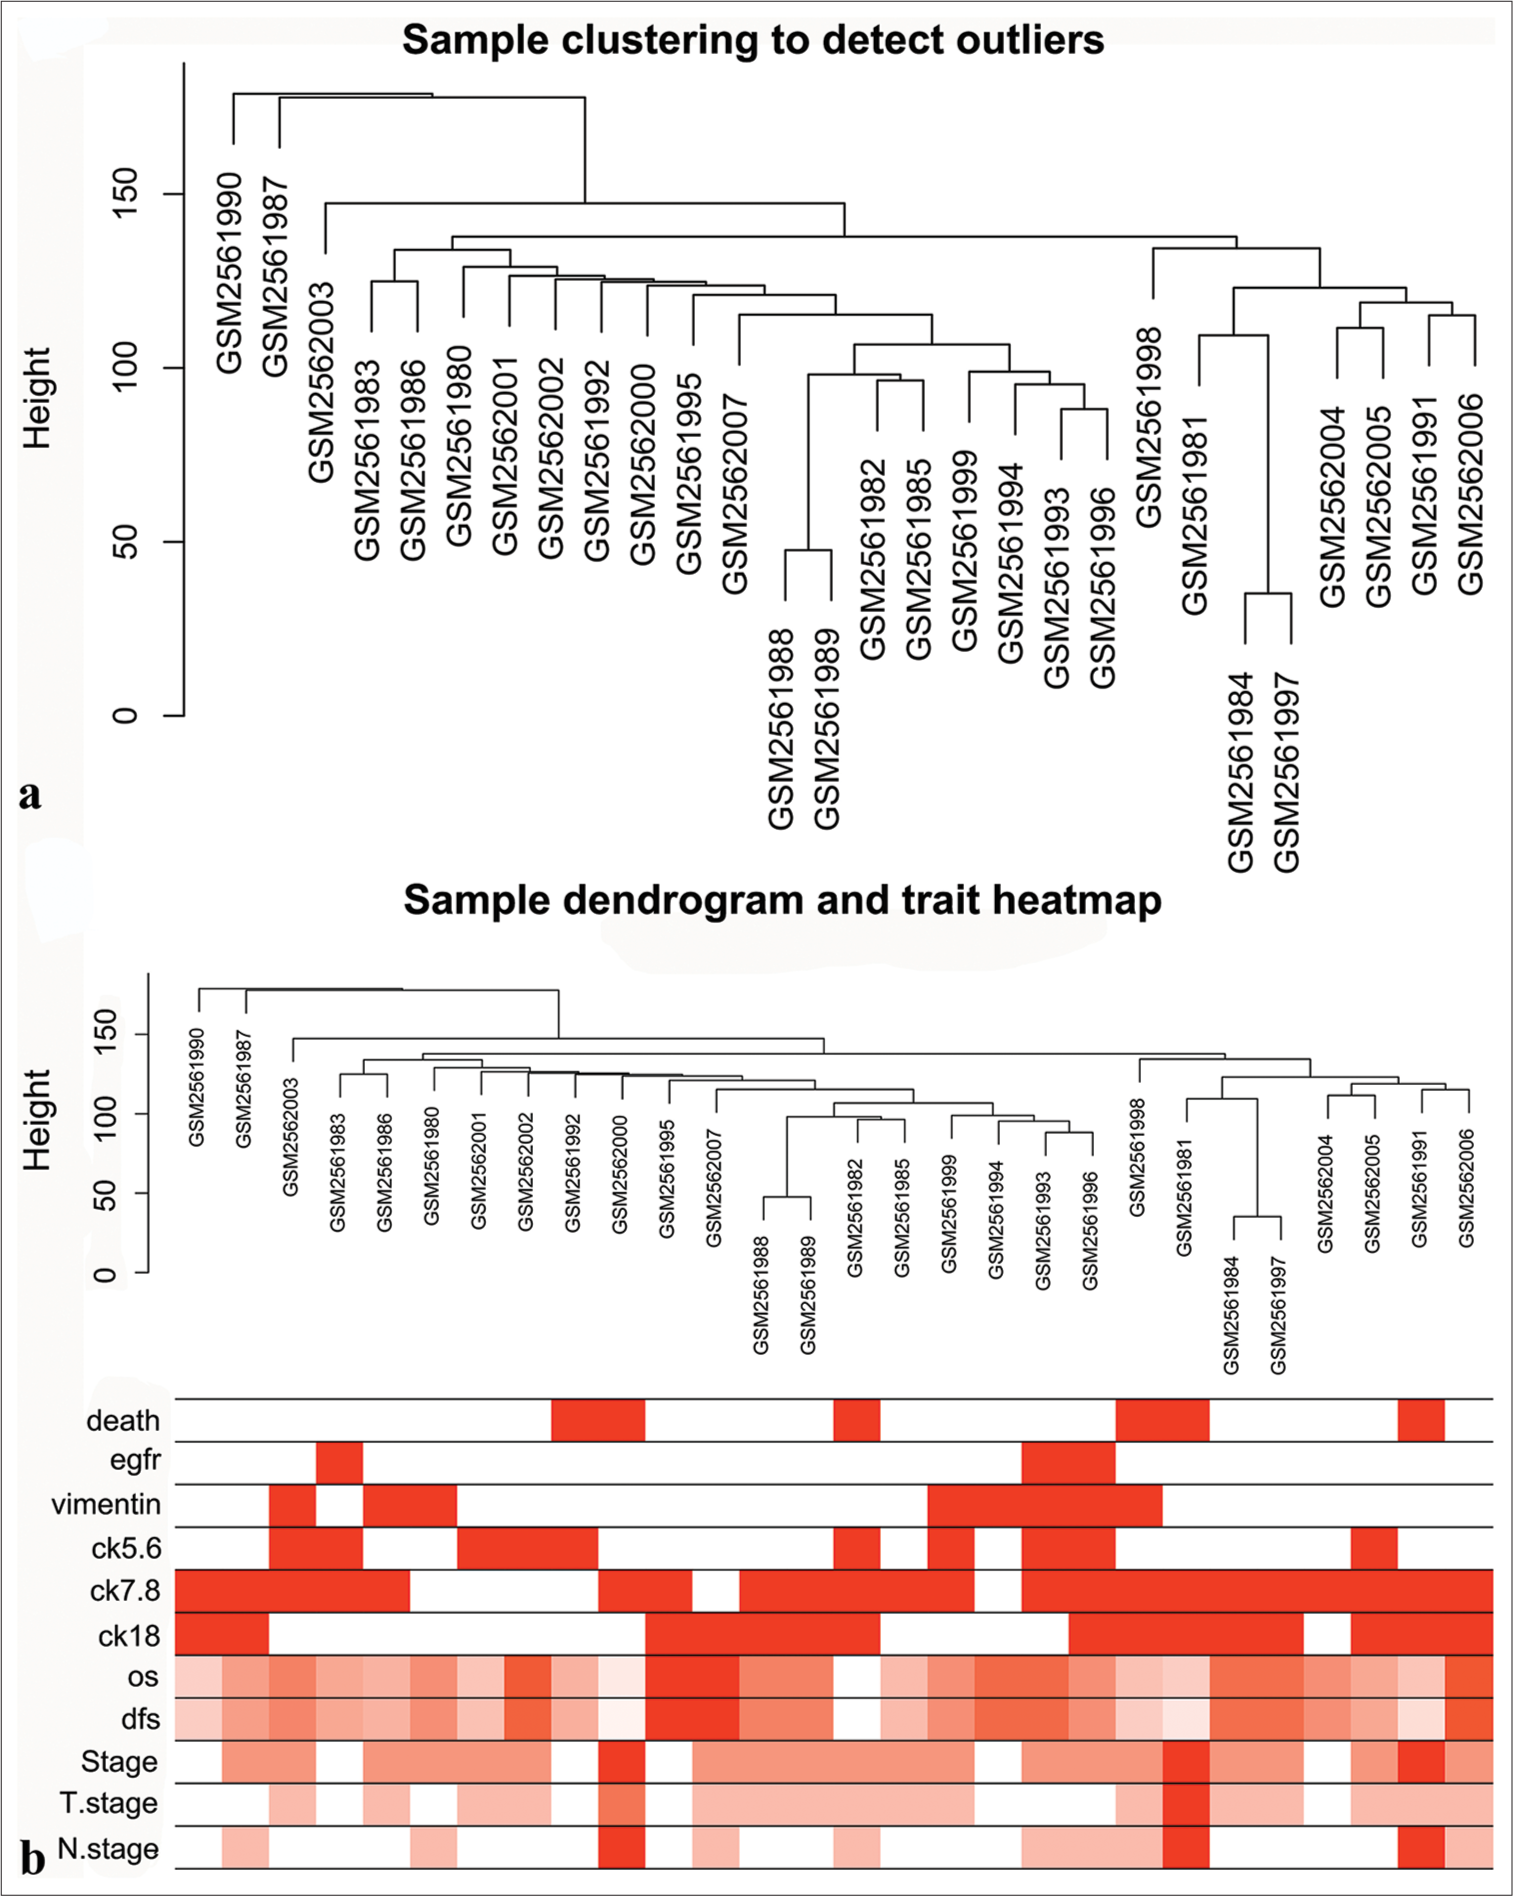
- Data download and preprocessing. (a) Confirmation of samples. (b) Heatmap of samples and clinical features.
Network construction and module identification
We first determined the soft threshold power β to be 6 (scale-free R2 = 0.84) using pickSoftThreshold function, which improved network connectivity [Figure 3a-d]. Using the one-step method, we obtained a total of 15 co-expression modules by setting the module size at 30 and the deepSplit parameter at 2, indicating medium sensitivity. The modules included black, blue, pink, brown, cyan, red, gray, green, purple, yellow, tan, salmon, green-yellow, turquoise, and magenta [Figure 3e and f]. The genes within each module are listed in Table S2.
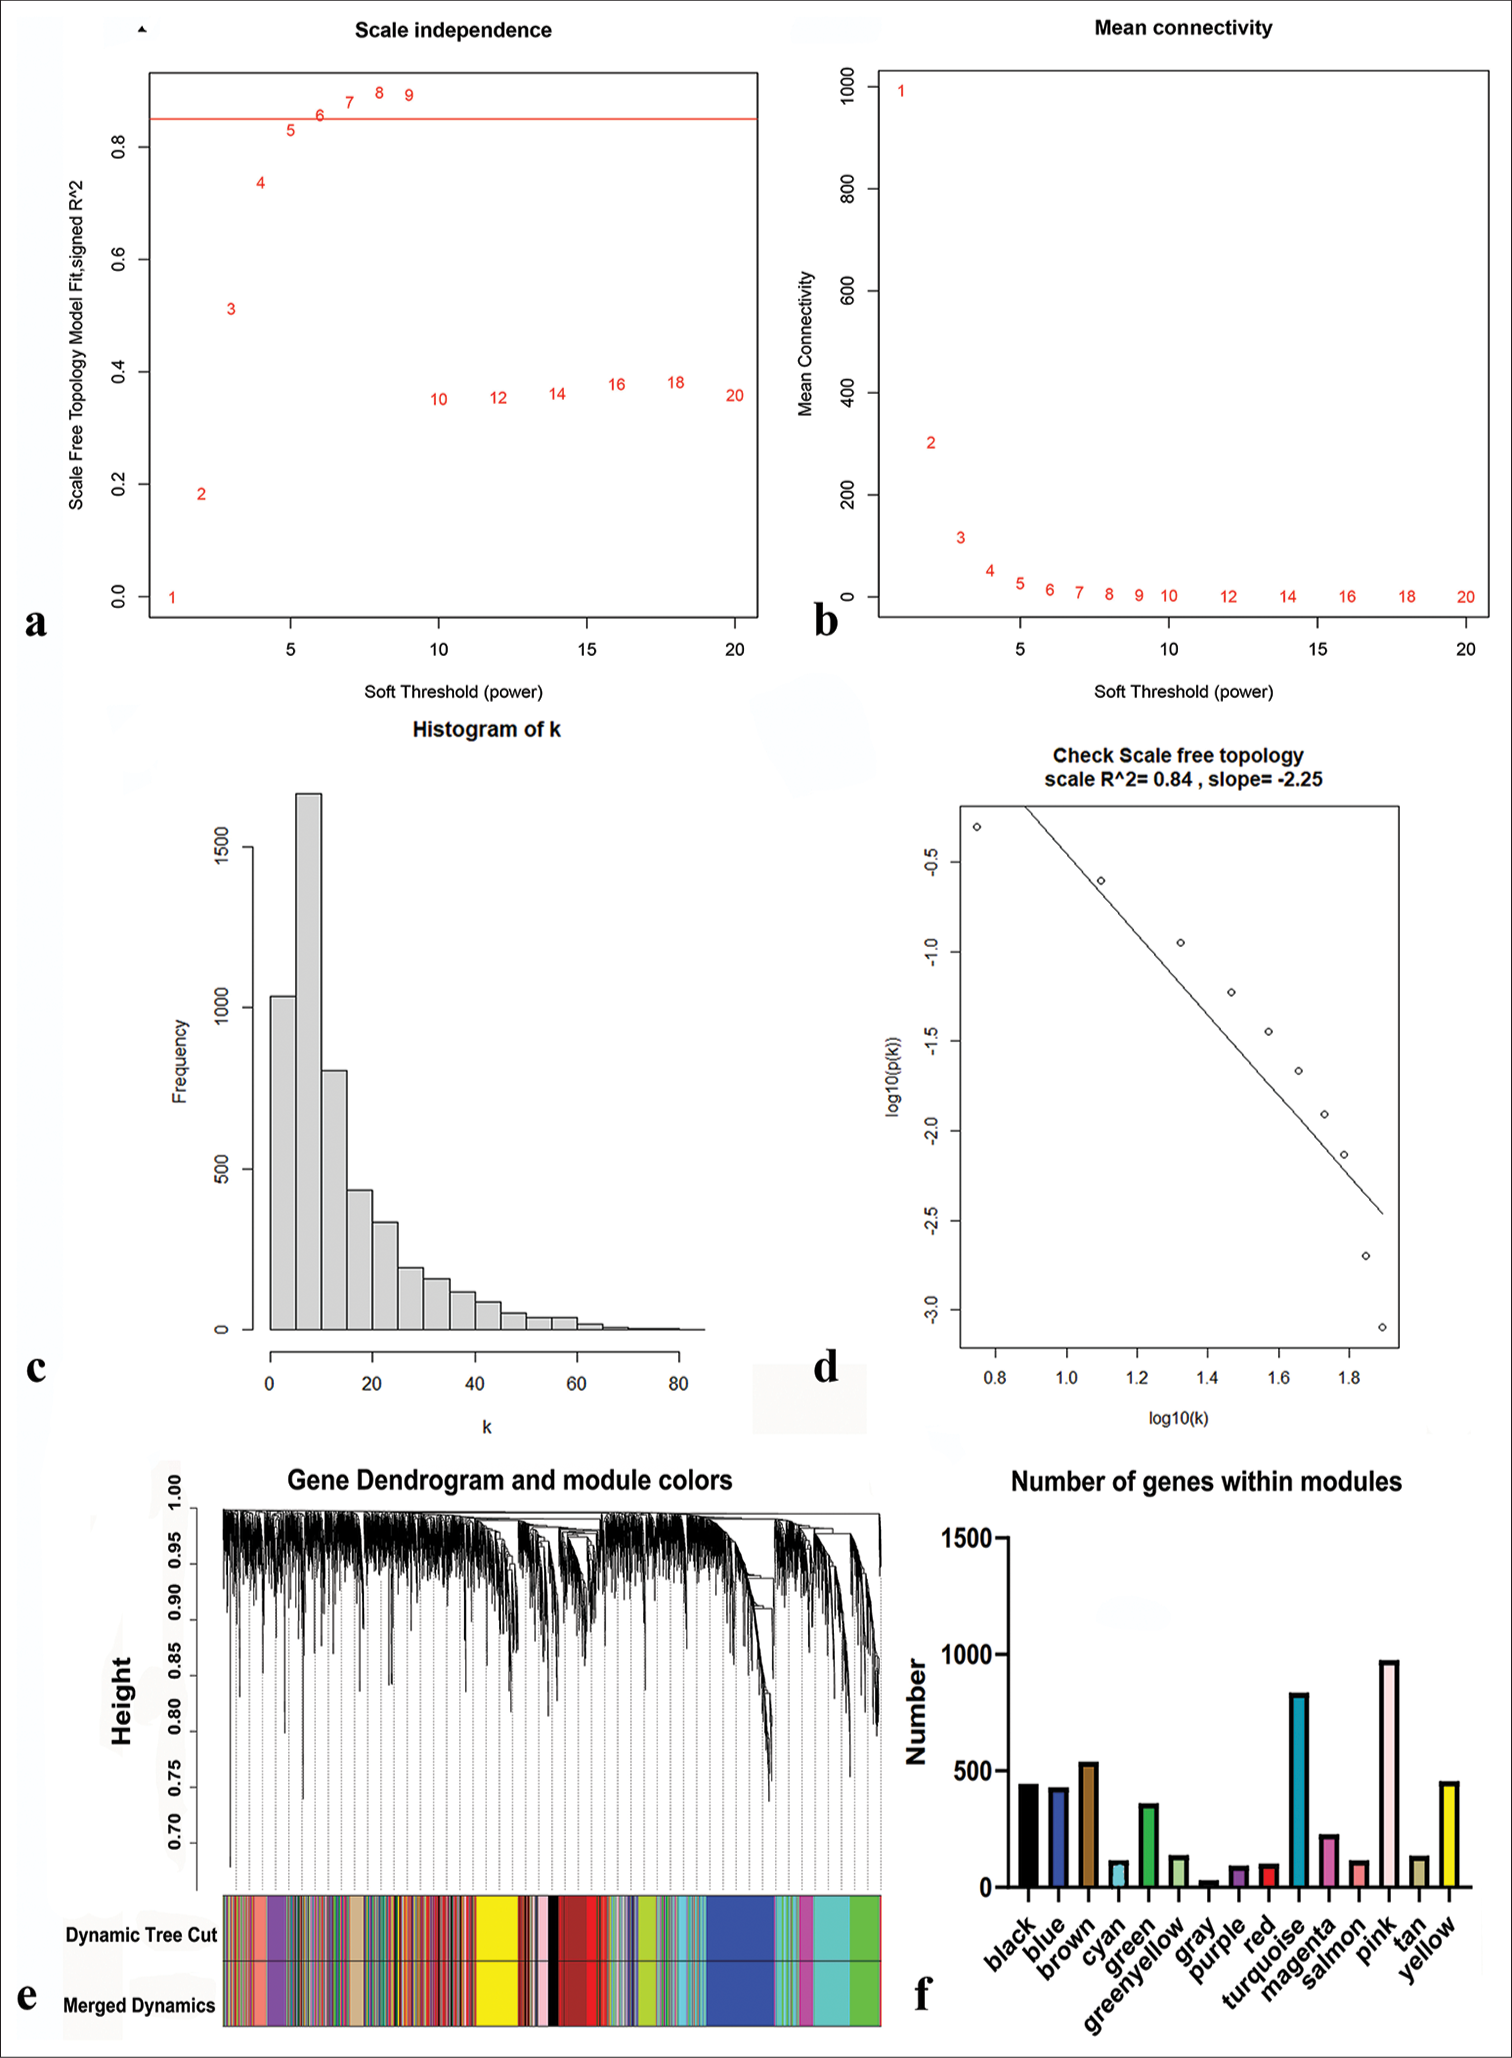
- Network construction and modules identification. (a) Determination of the soft-threshold powers (β). (b) The mean connectivity for various soft-threshold powers. (c and d) Verification of scale-free topology when β = 6. (e) Dynamic tree cut and merged dynamic color plot. (f) Number of genes in each module.
Selection of DFS-related modules
The trait-heat map illustrated the correlation between each module and the variables under consideration. From this analysis, three modules stood out as strongly associated with the variable disease-free survival: Green-yellow, magenta, and turquoise modules. Notably, the green-yellow module (correlation = −0.44, P = 0.02) and magenta module (correlation = −0.38, P = 0.05) exhibited negative correlations with DFS, while the turquoise module (correlation = 0.29, P = 0.1) showed a positive correlation [Figure 4]. In addition, these three modules demonstrated high GS for DFS in comparison with the others [Figure 5a]. Subsequently, we constructed a weighted network of genes within each module, visualizing it through a heatmap [Figure 5b] and conducted hierarchical clustering of the modules [Figure 6].
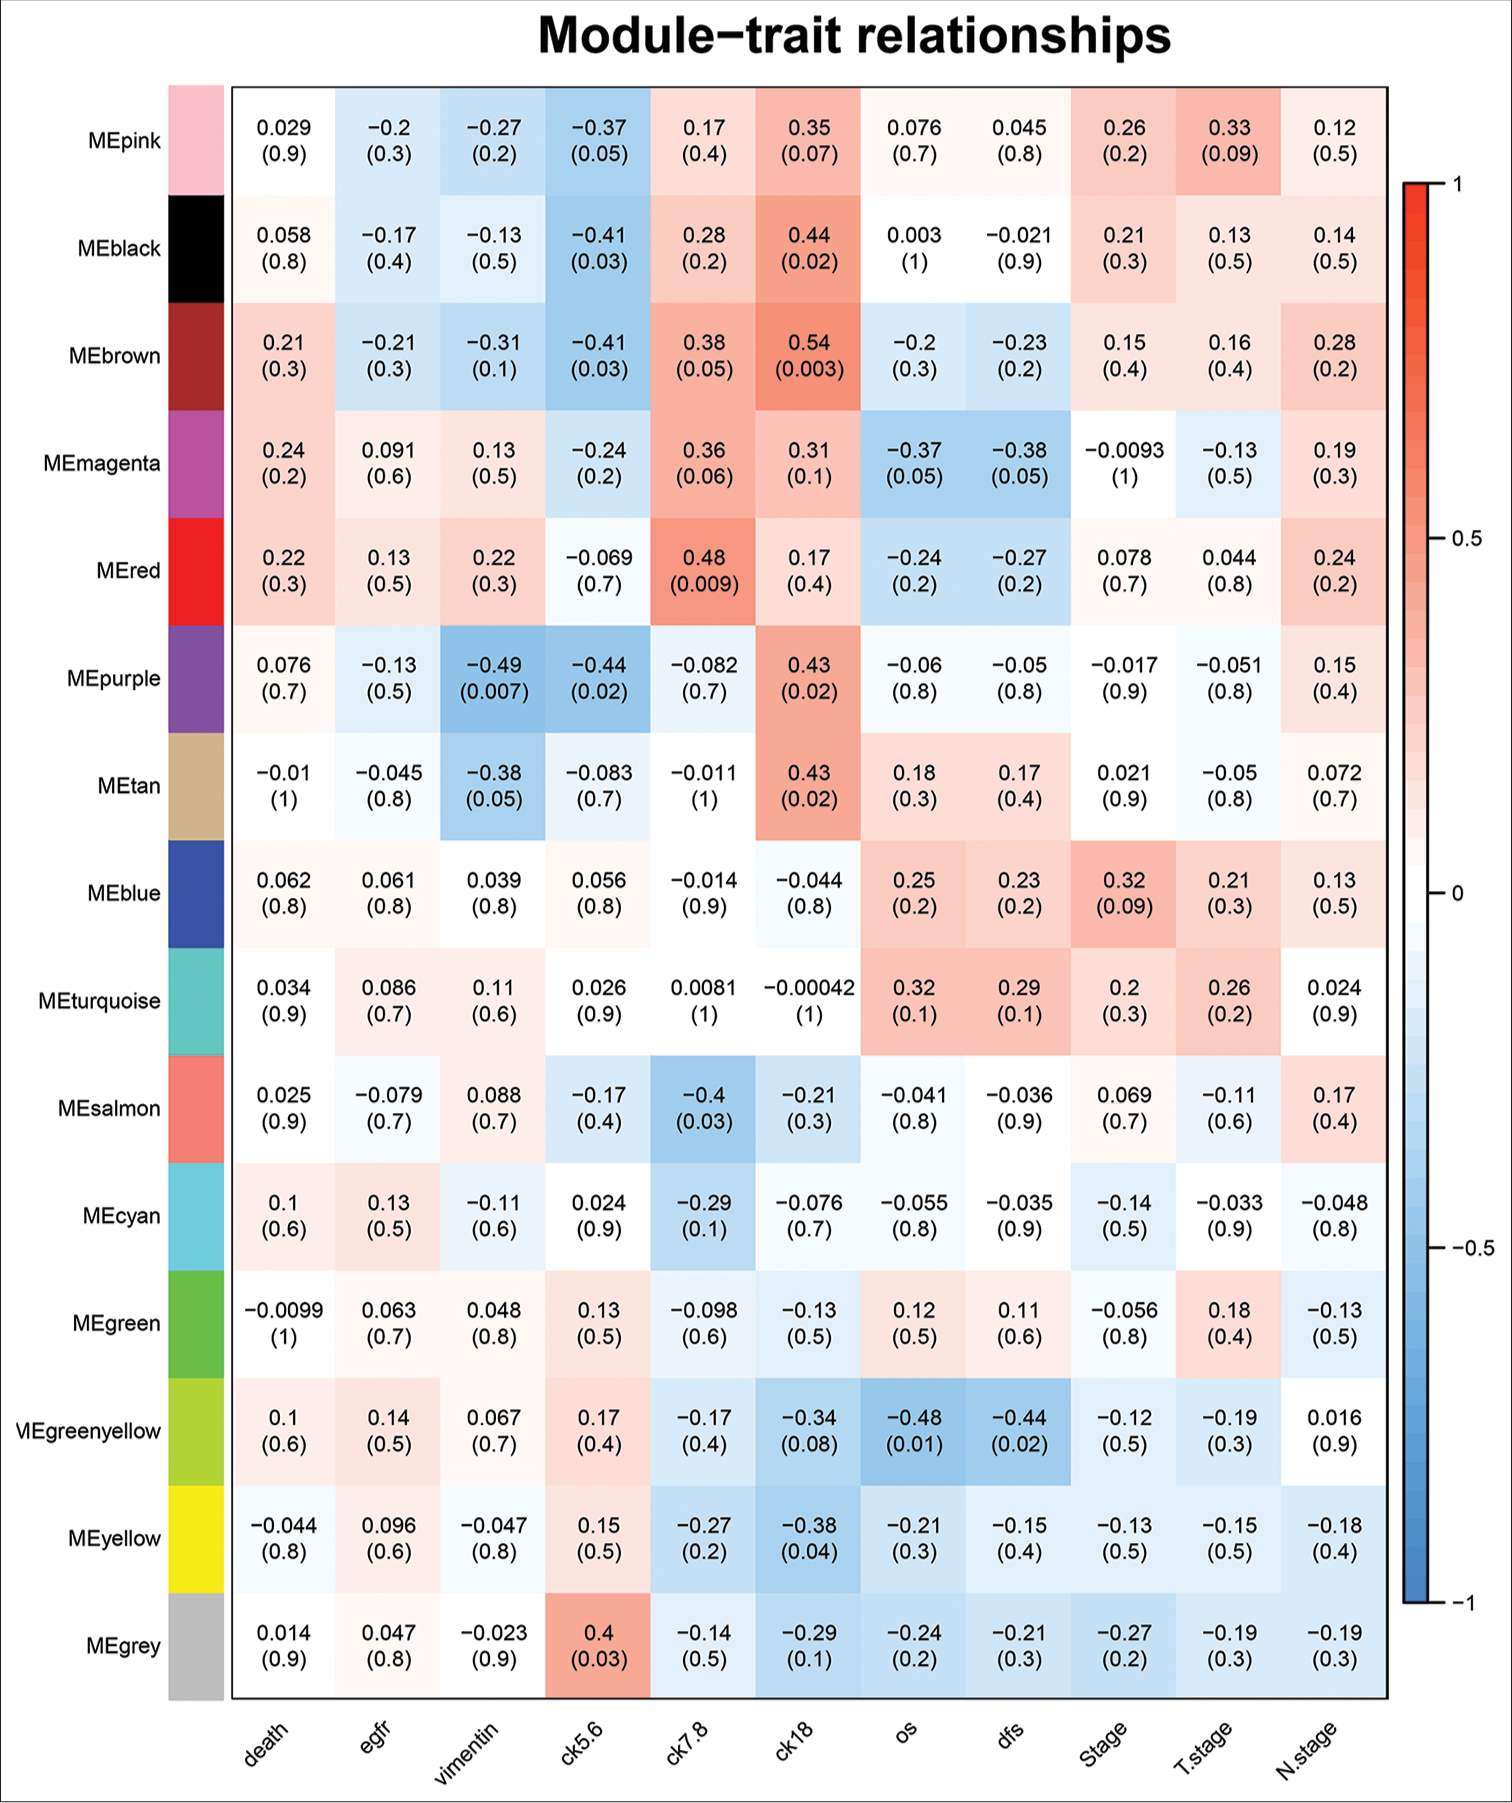
- Determination of modules associated with clinical traits of triple-negative breast cancer.
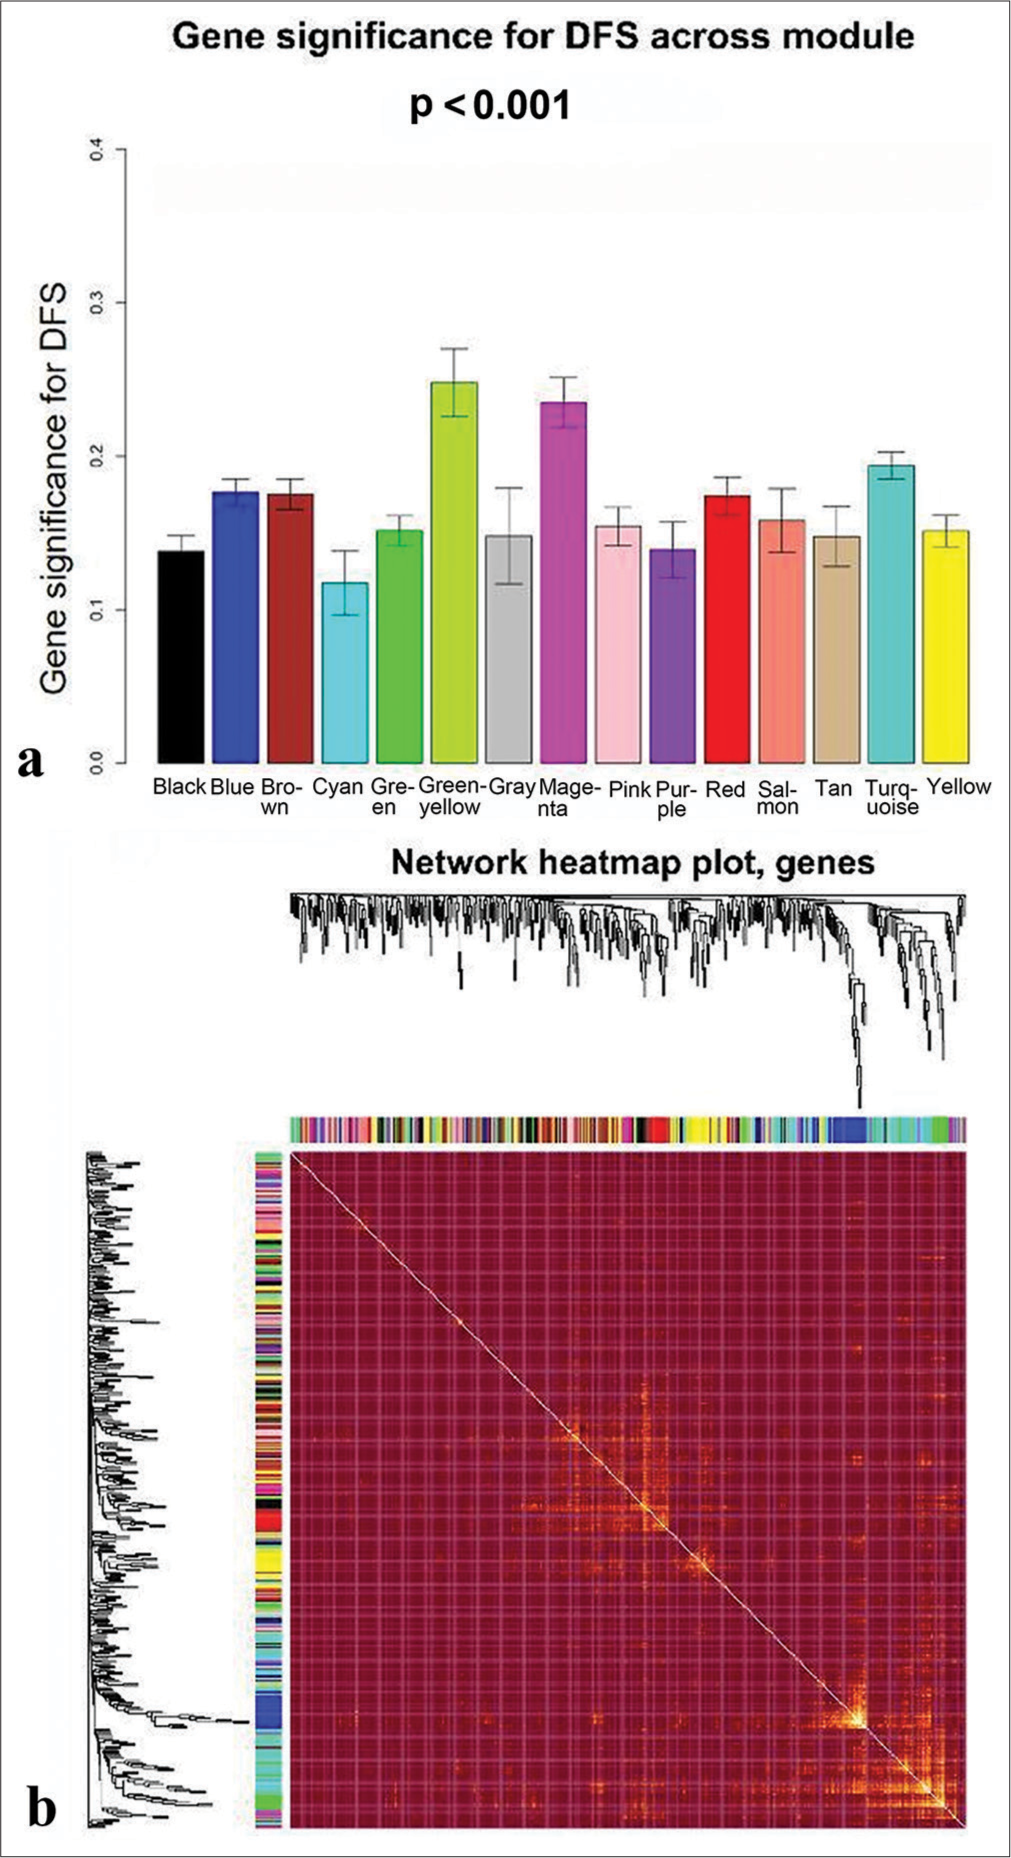
- Determination of modules associated with the clinical traits of triple-negative breast cancer. (a) Gene significance for disease-free survival across all modules. (b) Topological overlapping matrix depicting the relationships between genes within all modules.
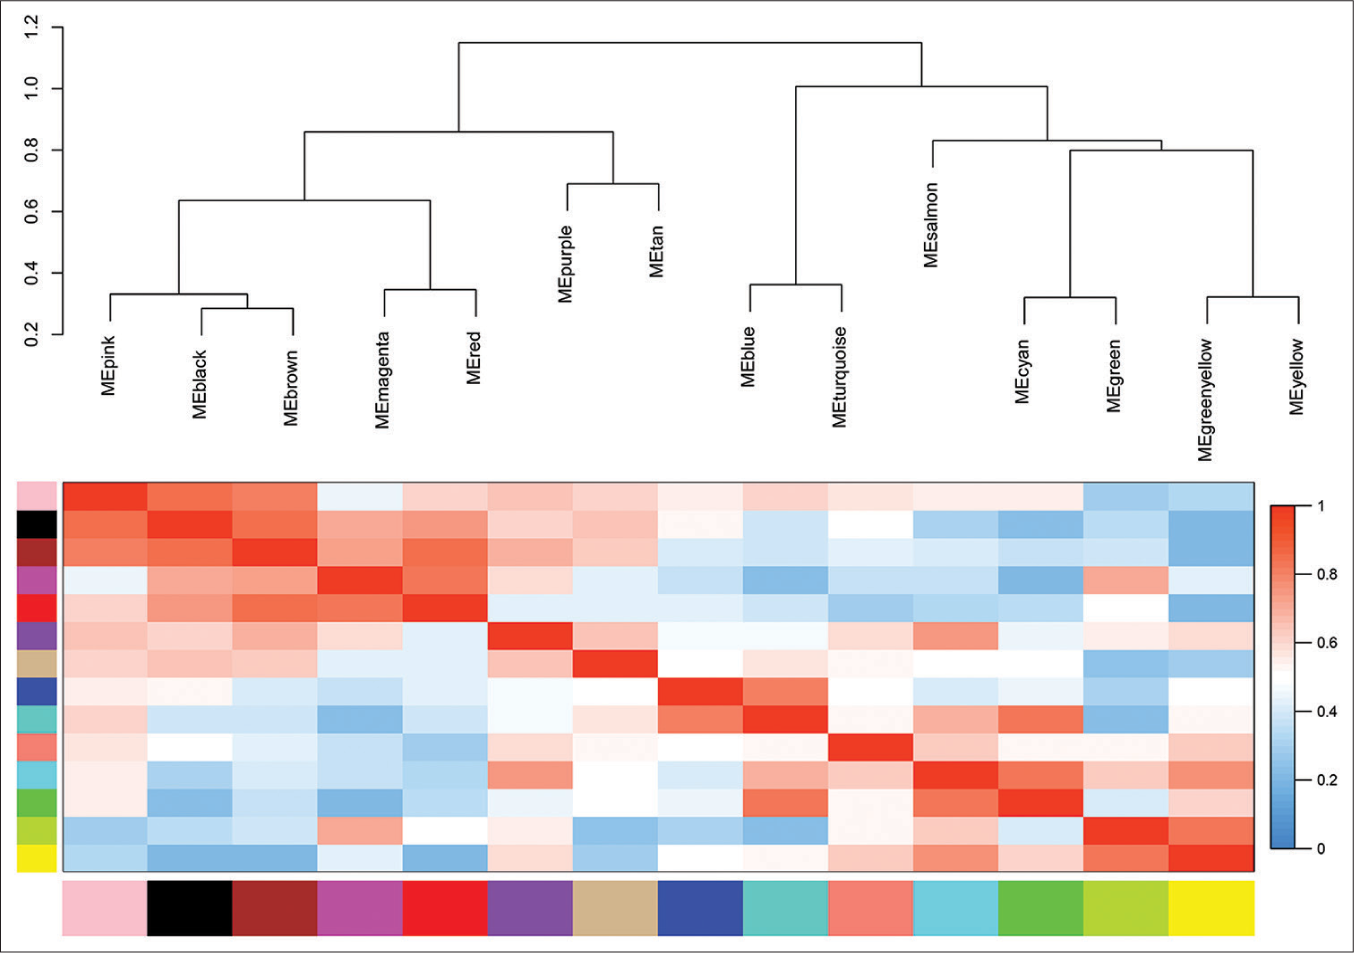
- Eigengene dendrogram and eigengene adjacency plot. ME: Module eigengene.
GO and KEGG functional analyses
GO analysis revealed that genes in the green-yellow module were primarily implicated in B-cell proliferation [Figure 7a], located on the external side of the plasma membrane [Figure 7b], and exhibited receptor ligand activity and signaling receptor activator activity [Figure 7c]. KEGG pathway analysis further highlighted the significant enrichment of the green-yellow module in the B-cell receptor signaling pathway [Figure 7d]. Conversely, genes in the magenta module were predominantly associated with dicarboxylic acid transport [Figure 8a], localized to the cytoplasmic side of the plasma membrane [Figure 8b], and exhibited metallopeptidase activity [Figure 8c] and were involved in the calcium signaling pathway [Figure 8d]. The genes within the turquoise module were linked to chemical synaptic transmission and regulation of trans-synaptic signaling [Figure 9a], were located in early endosomes [Figure 9b], had phospholipid binding activity [Figure 9c], and were involved in apoptosis [Figure 9d].
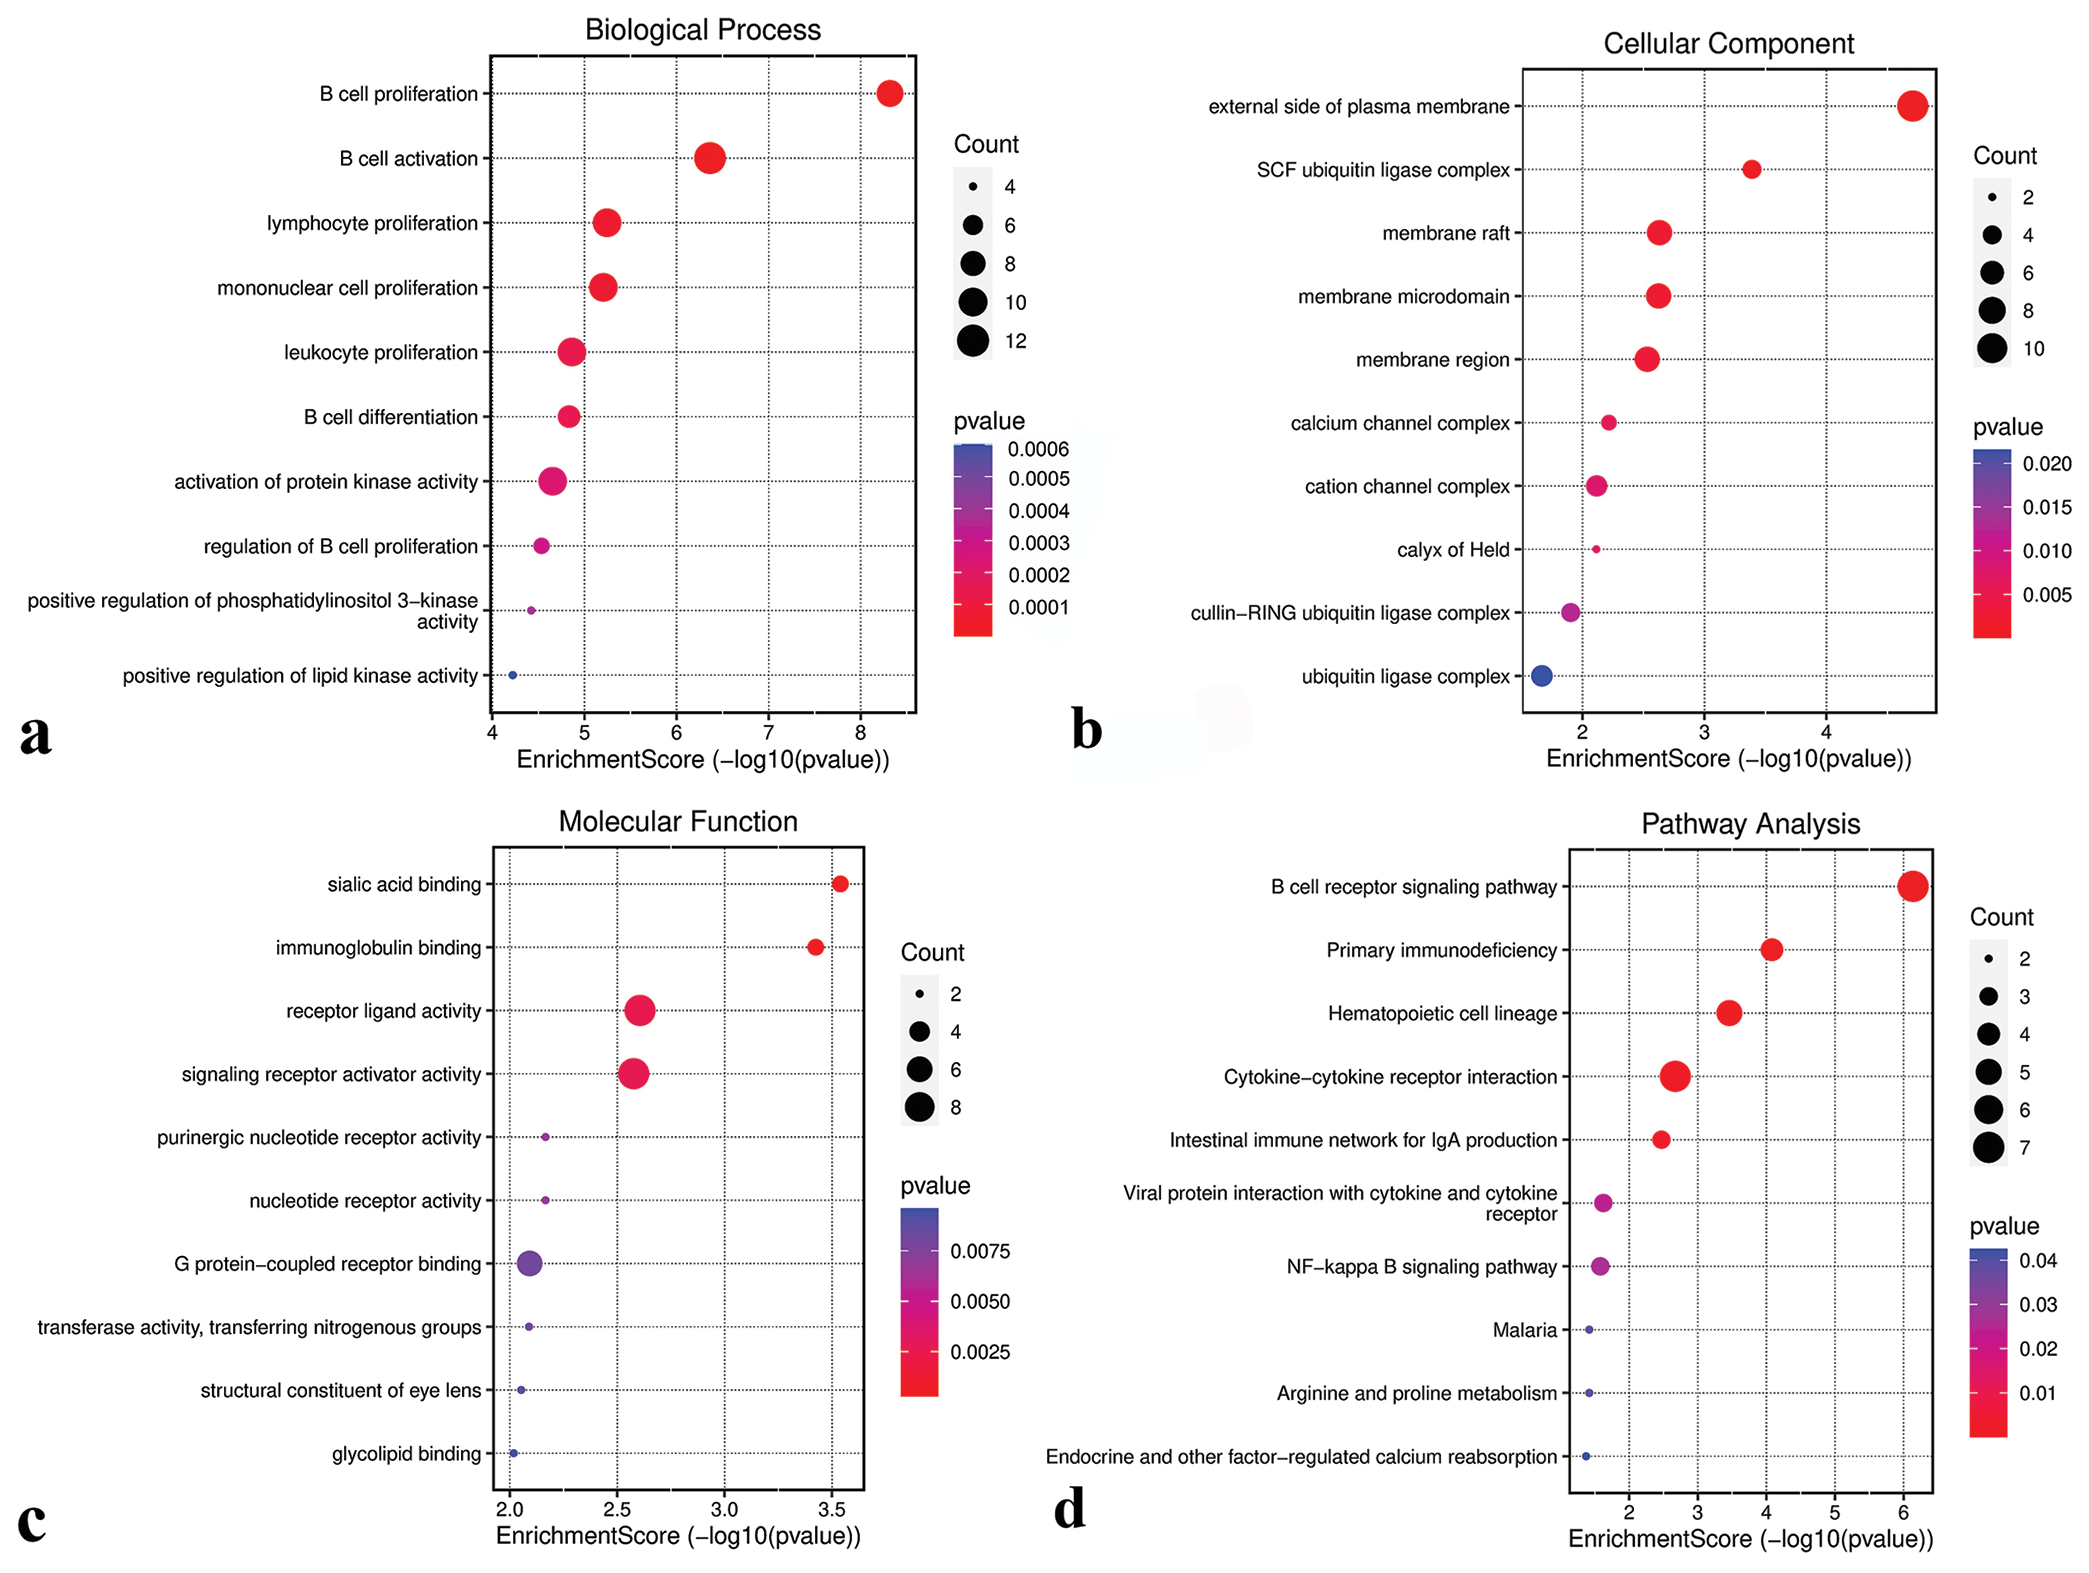
- Functional analysis of the green-yellow module. (a) Biological processes. (b) Cellular components. (c) Molecular functions. (d) Kyoto encyclopedia of genes and genomes pathways. SCF: Skp1-cullin 1-F-box, NF: Nuclear factor.
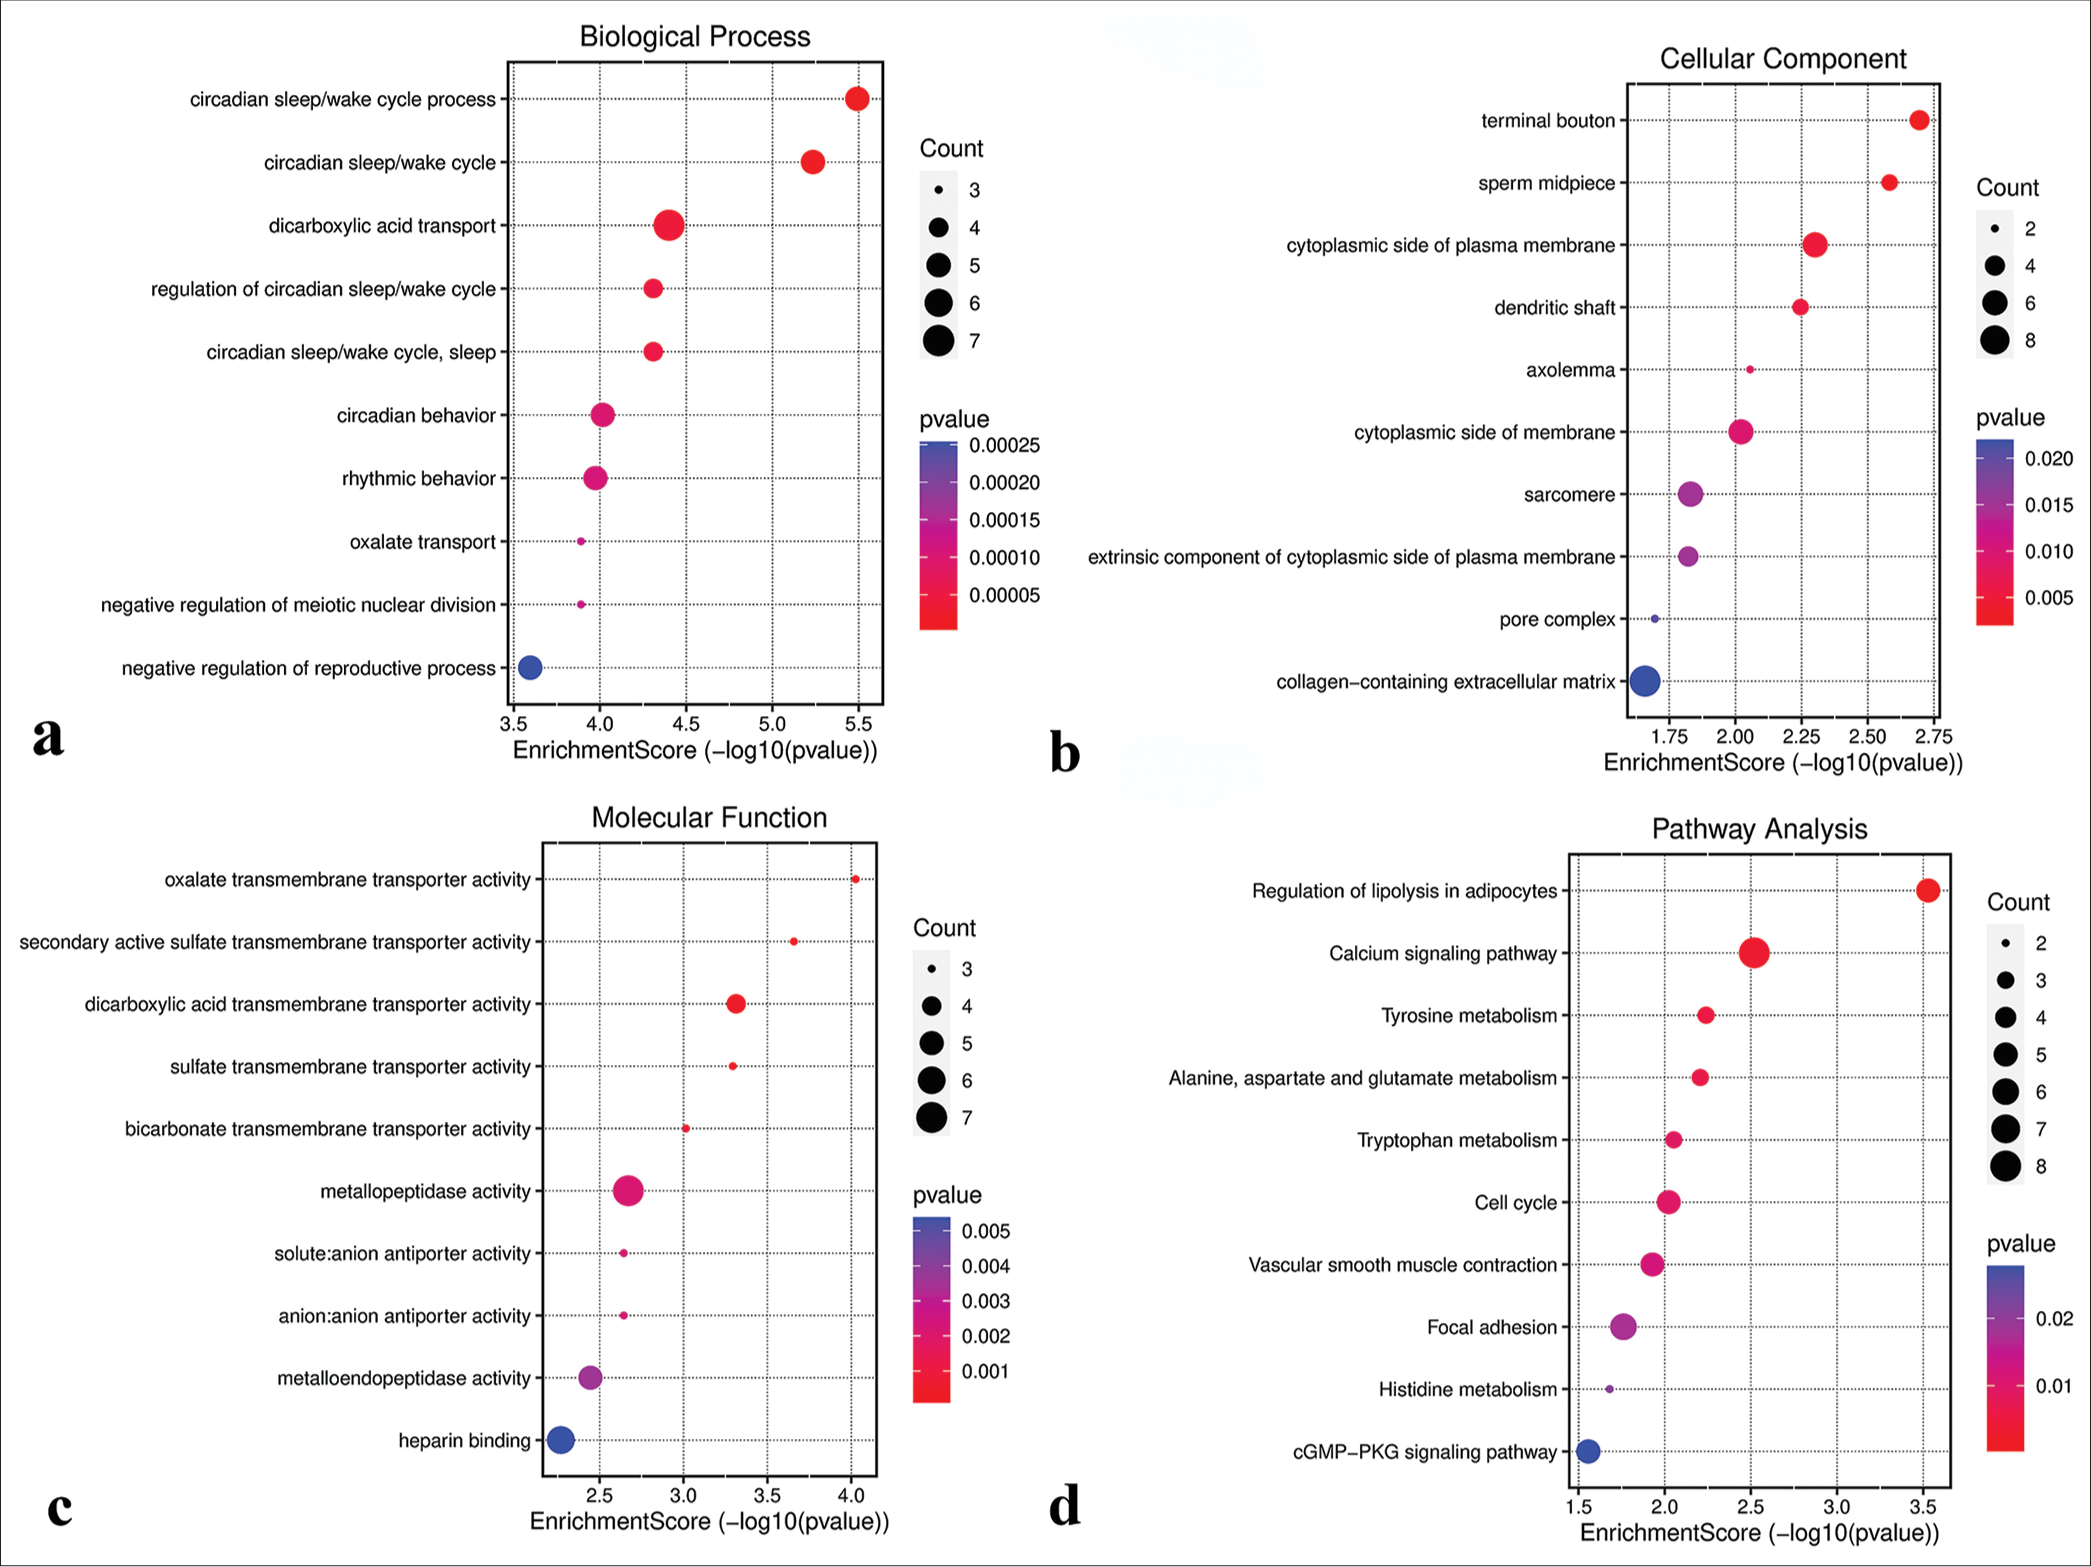
- Functional analysis of the magenta module. (a) Biological processes. (b) Cellular components. (c) Molecular functions. (d) Kyoto encyclopedia of genes and genomes pathways. GMP: Guanosine monophosphate, PKG: Protein kinase G.
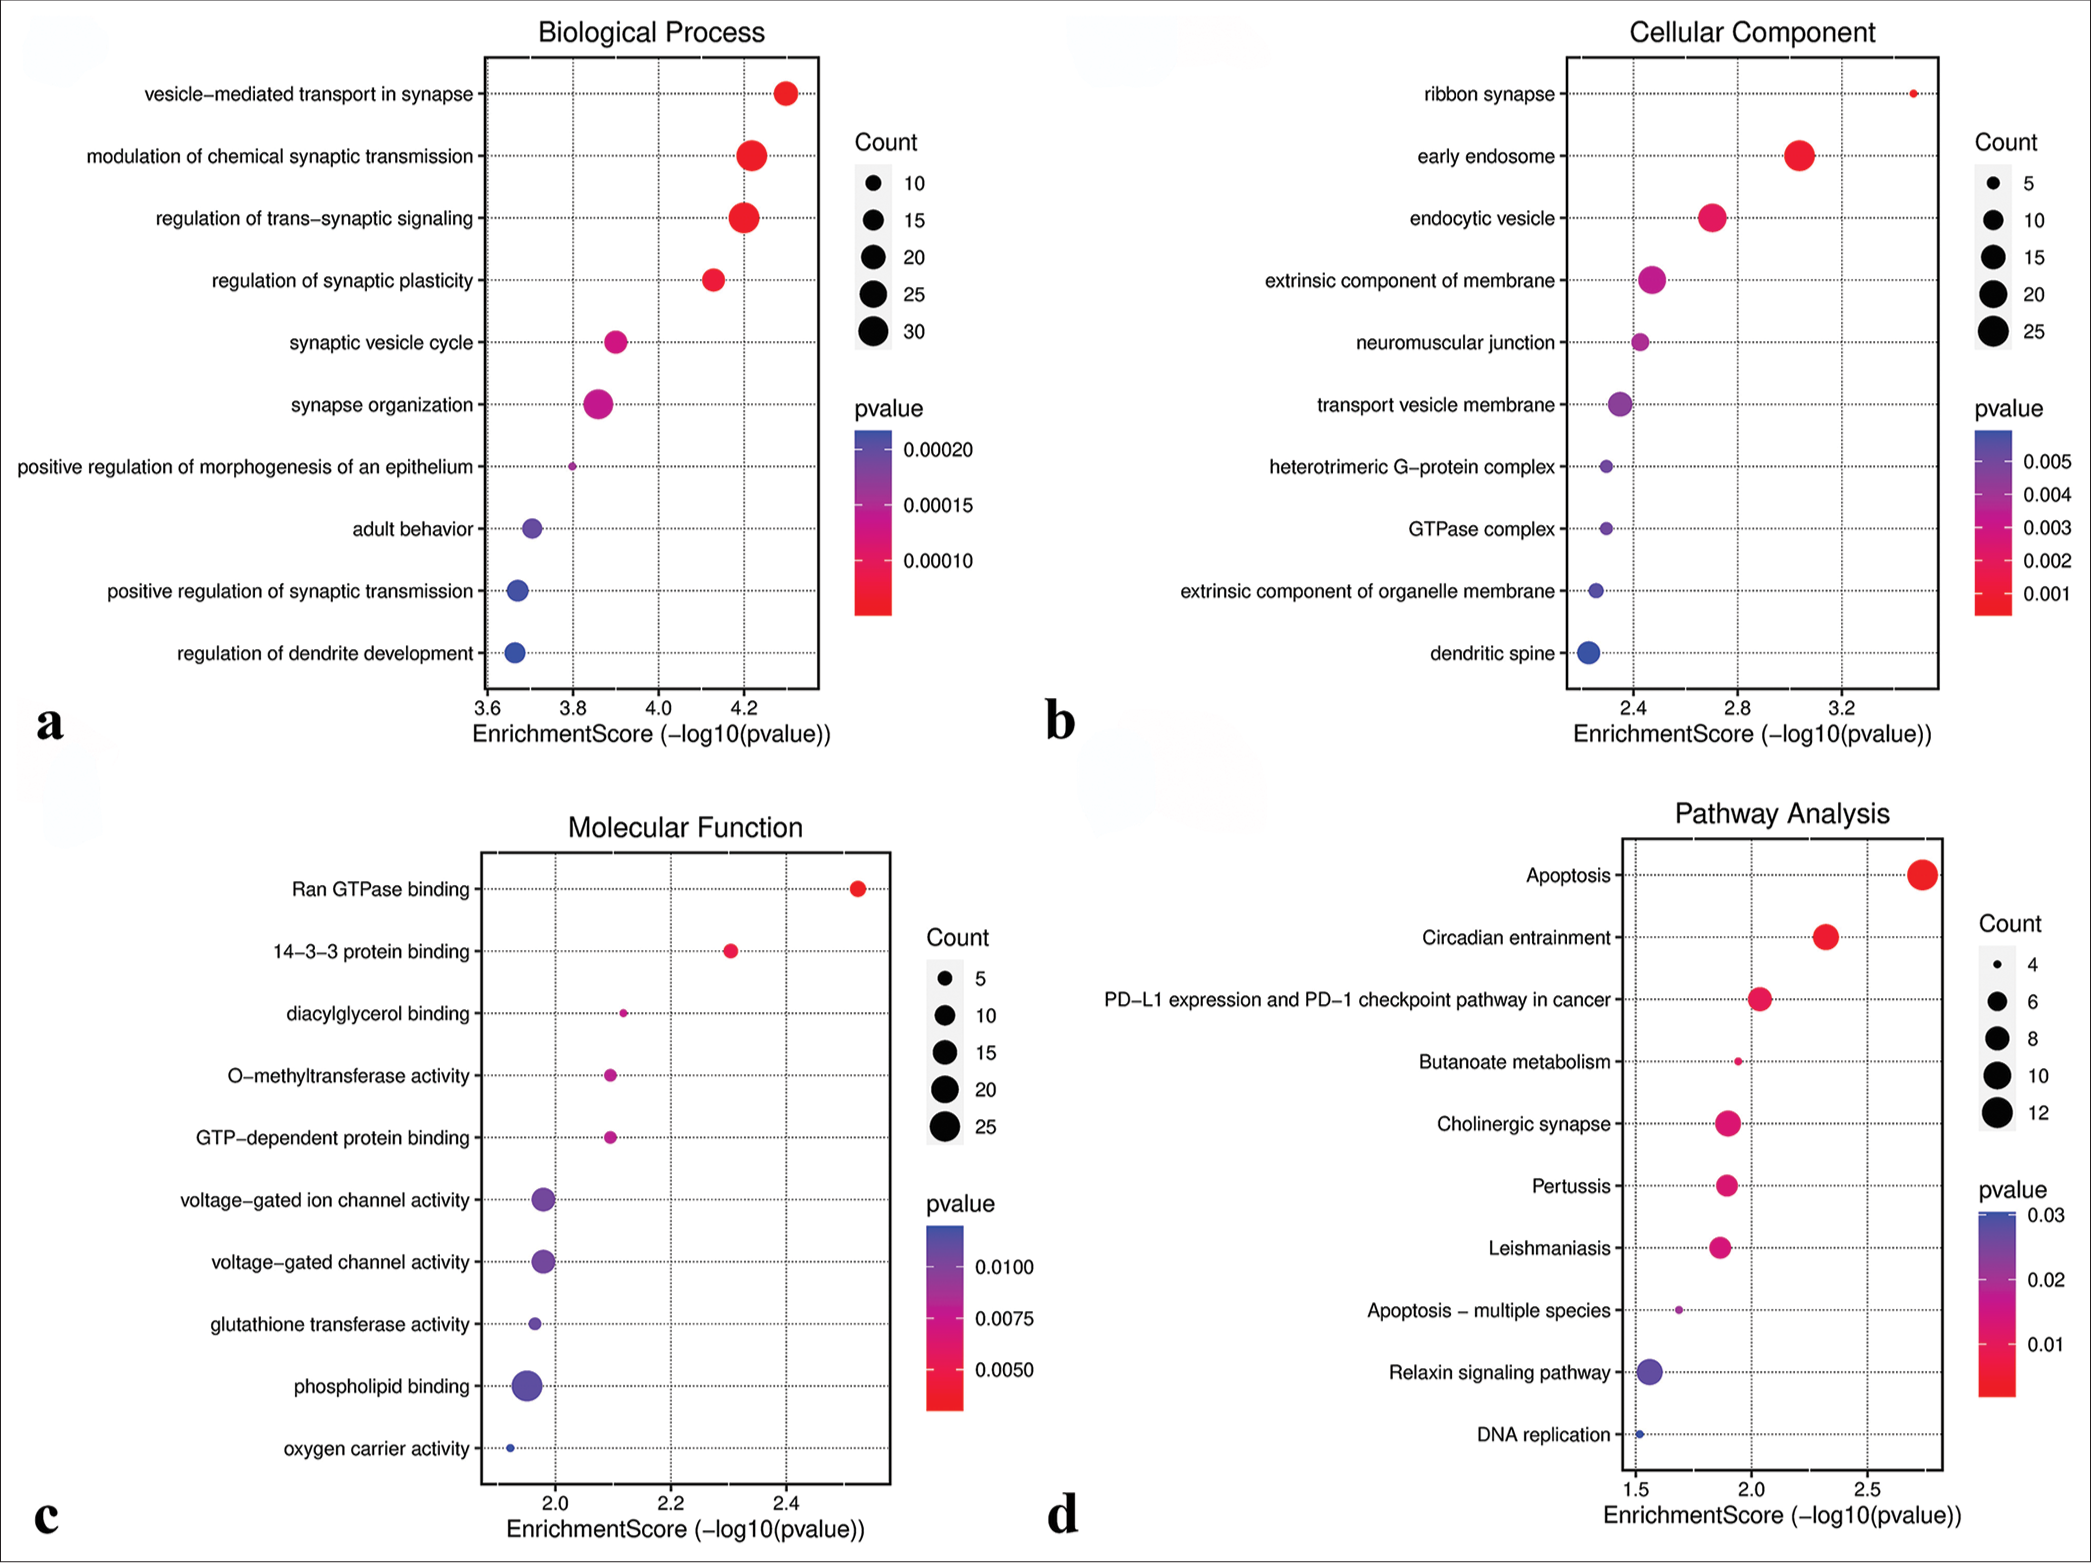
- Functional analysis of the turquoise module. (a) Biological processes. (b) Cellular components. (c) Molecular functions. (d) Kyoto encyclopedia of genes and genomes pathways. GTP: Guanosine triphosphate, PD-L1: Programmed Cell Death-Ligand 1.
Identification of potential transcription factors
To identify potential transcription factors within the three modules, each module was intersected with the Human Transcription Factor Database. The green-yellow module yielded 14 overlapping genes [Figure 10a], the magenta module had 15 overlapping genes [Figure 10b], and the turquoise module exhibited 69 overlapping genes [Figure 10c]. These overlapping genes, identified as potential transcription factors, are listed in Table S3.
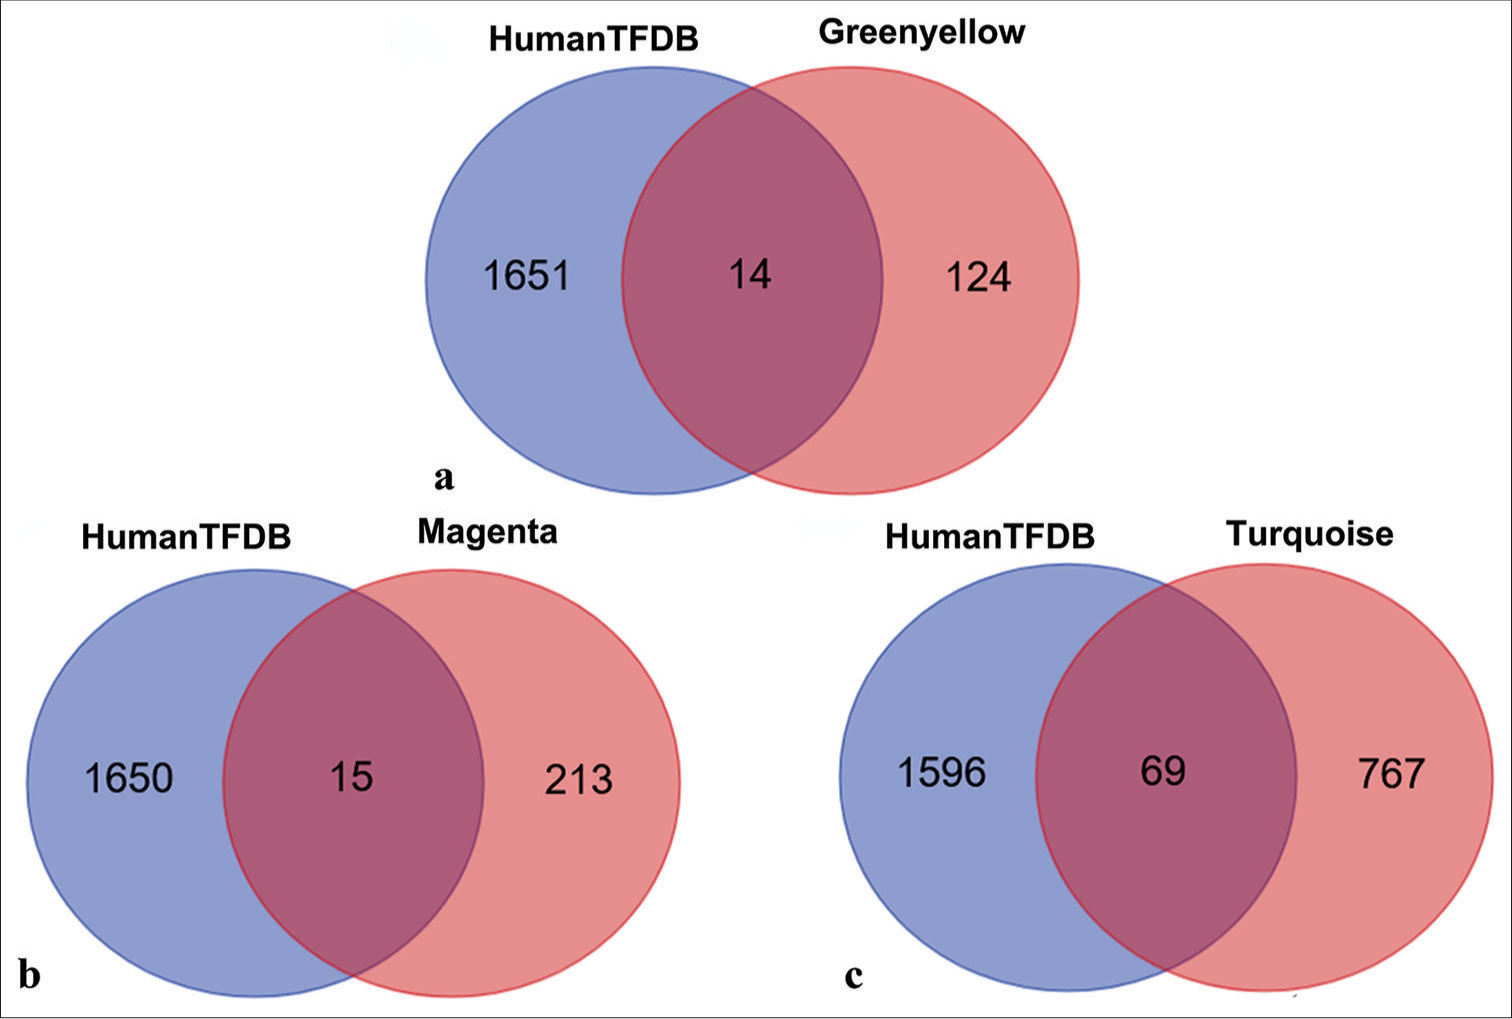
- Venn diagram of overlapping transcription factors between three modules and human transcription factor database (HumanTFDB). (a) Overlapping transcription factors shared between HumanTFDB and the green-yellow module. (b) Overlapping transcription factors shared between HumanTFDB and the magenta module. (c) Overlapping transcription factors shared between HumanTFDB and the turquoise module.
Survival analysis of potential transcription factors
Potential transcription factors were subjected to univariate Cox regression analyses for the identification of hub transcription factors. The results revealed that FOXD1 (HR = 3.1606, 95% Confidence interval [CI] 1.1202–8.09179; P = 0.0297; [Figure 11a]), ARNT2 (HR = 0.3416, 95% CI 0.1208–0.9661; P = 0.0429; [Figure 11b]), and ZNF132 (HR = 0.3103, 95% CI 0.1105–0.8715; P = 0.0264; [Figure 11c]) emerged as hub transcription factors. Subsequently, Kaplan–Meier survival analysis results demonstrated the correlation between the expression levels of these hub transcription factors and DFS. Notably, prognosis was better when FOXD1 had low expression than when it had high expression, suggesting that FOXD1 is an activating oncogene [Figure 11d]. Similarly, prognosis was better when the expression levels of ARNT2 and ZNF132 were high than when the expression levels were low, indicating that these genes act as tumor suppressor genes [Figure 11e and f].
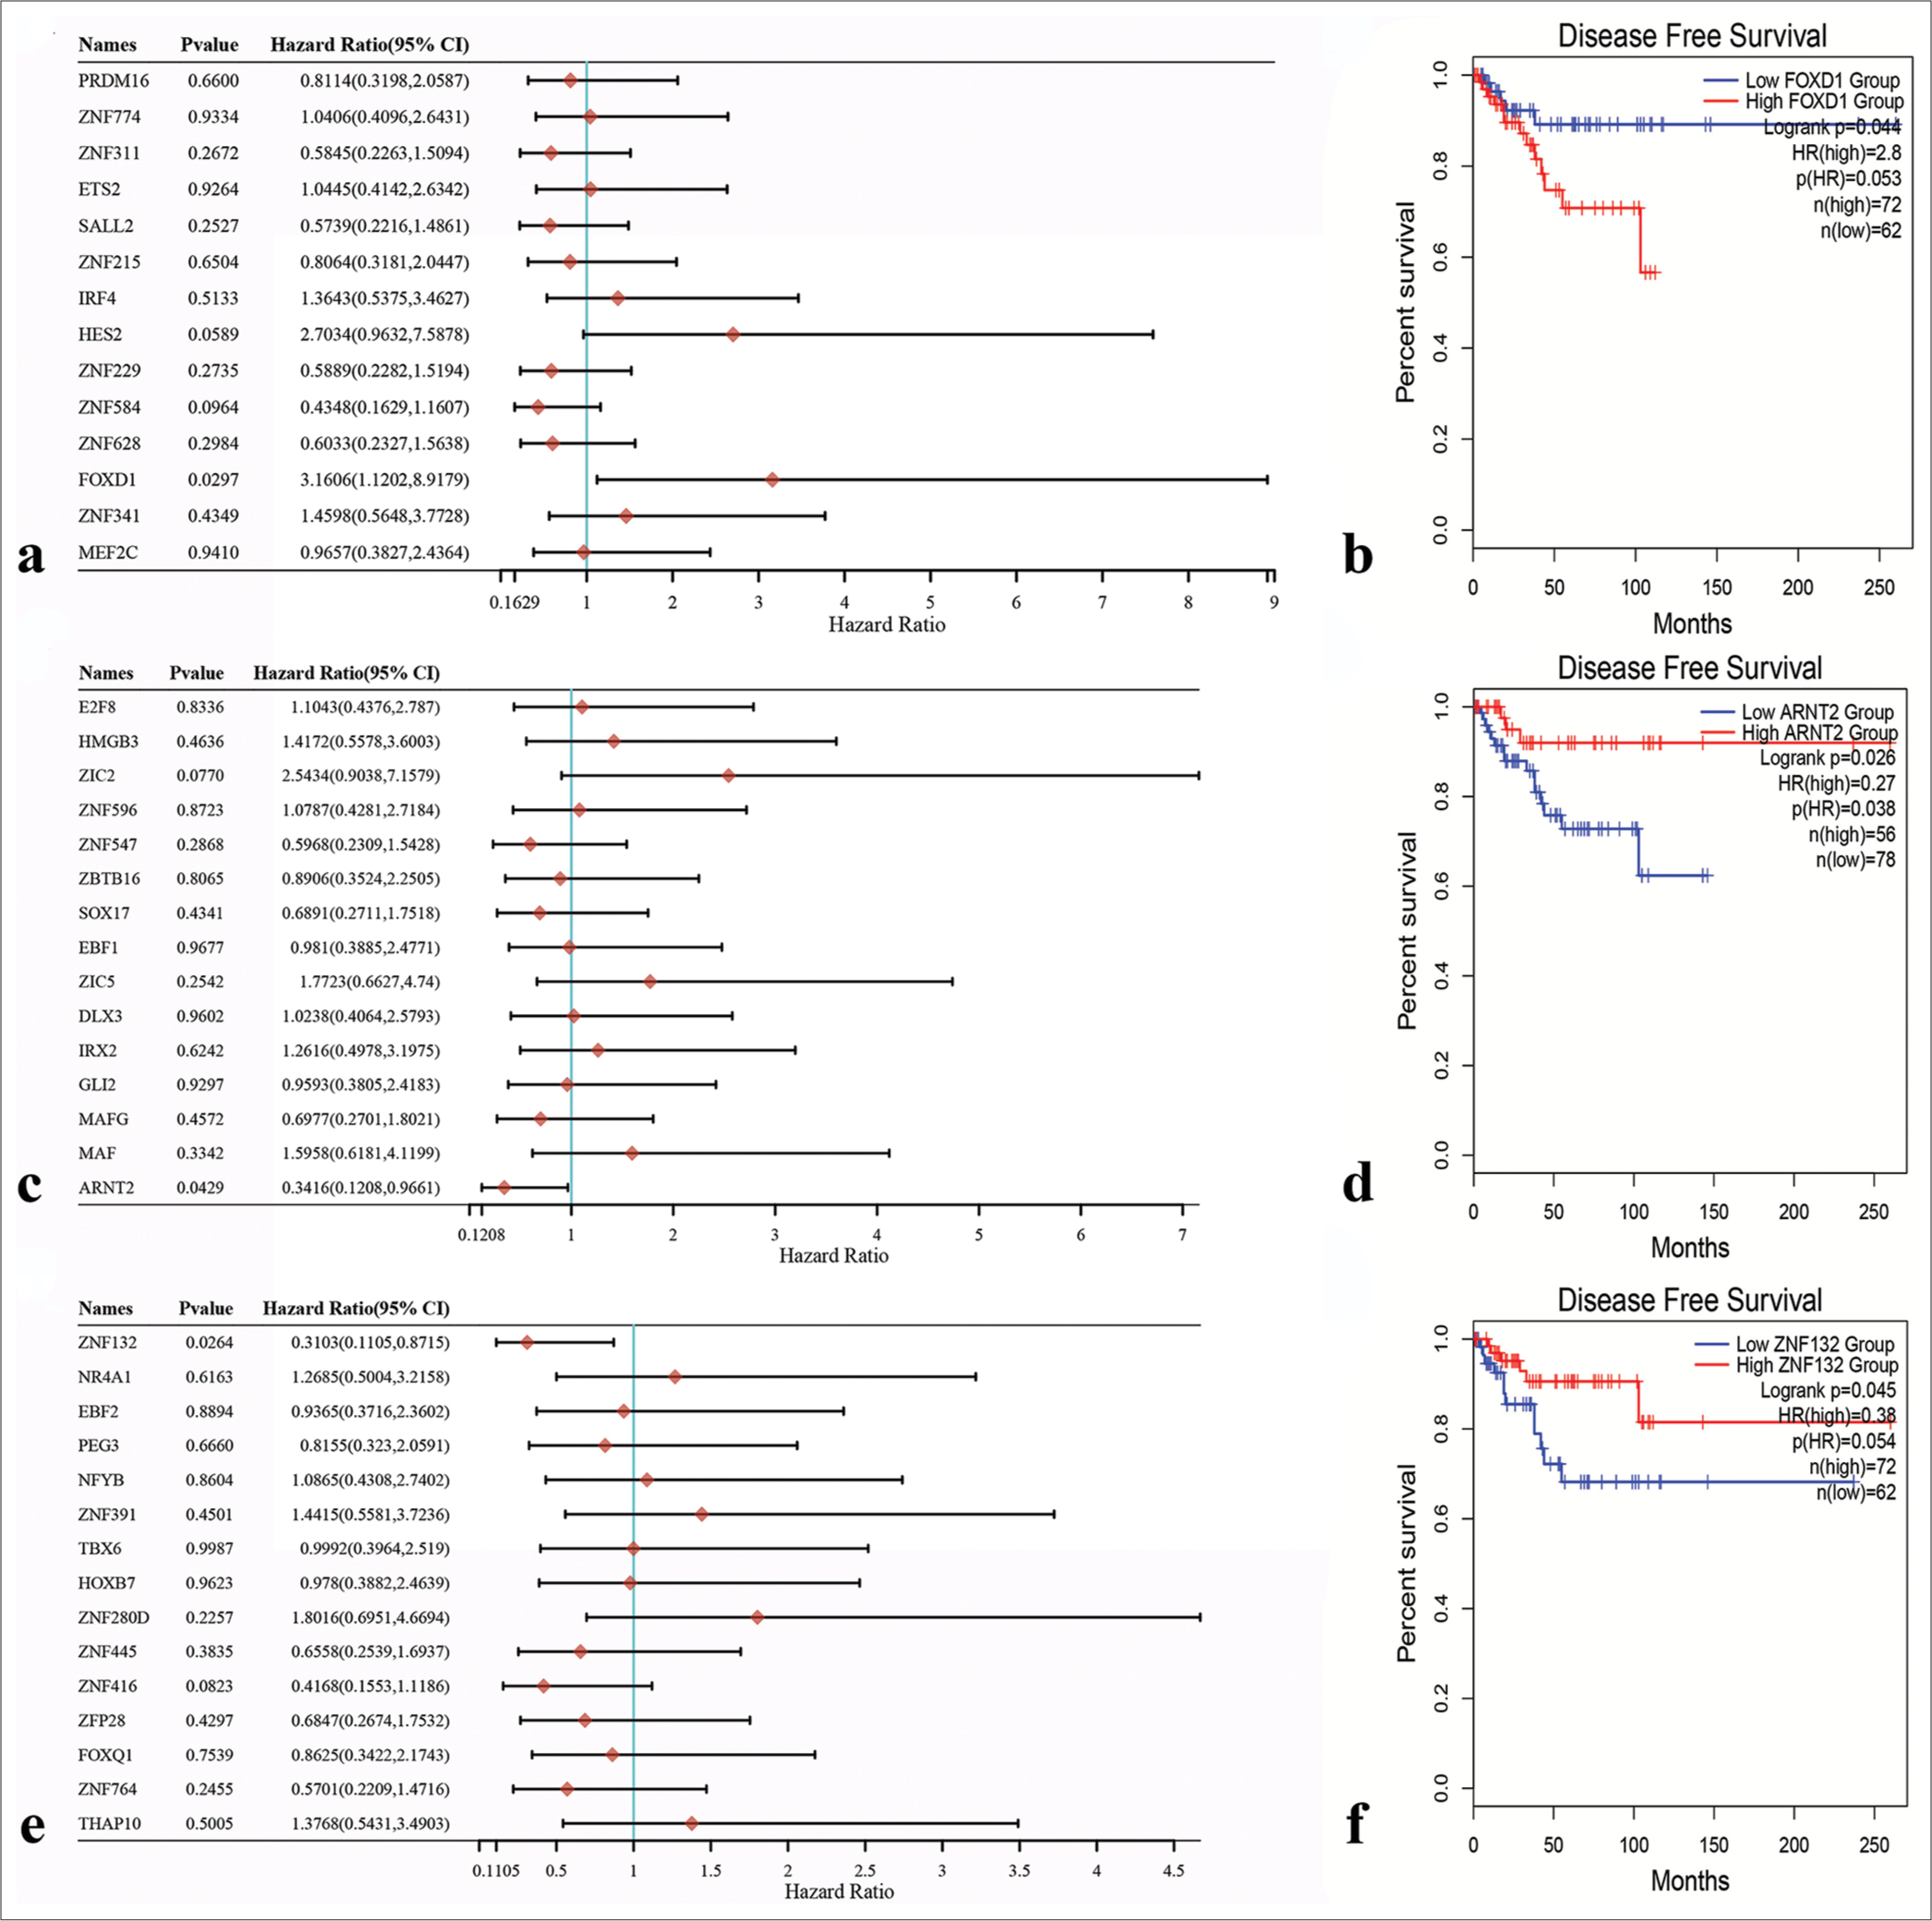
- Univariate Cox regression analysis of potential transcription factors and survival analysis of three Hub transcription factors through Kaplan–Meier survival curves. (a) Forkhead box D1 (FOXD1) was identified as the hub transcription factor in the green-yellow module. (b) Aryl hydrocarbon receptor nuclear translocator 2 (ARNT2) was identified as the hub transcription factor in the magenta module. (c) Zinc finger protein 132 (ZNF132) was identified as the hub transcription factor in the turquoise module. (d) Correlation between FOXD1 expression level and prognosis. (e) Correlation between ARNT2 expression level and prognosis. (f) Correlation between ZNF132 expression level and prognosis.
Hub transcription factors: expression level, clinical significance, downstream target genes, and correlation with tumor-infiltrating immune cells
We initiated an analysis of FOXD1 expression across various cancers using the TCGA database. The results showed that its expression level was significantly elevated in Bladder urothelial carcinoma (BLCA), Breast invasive carcinoma (BRCA), Colon adenocarcinoma (COAD), Esophageal carcinoma (ESCA), Head and Neck squamous cell carcinoma (HNSC), Liver hepatocellular carcinoma (LIHC), Lung squamous cell carcinoma (LUSC), Prostate adenocarcinoma (PRAD), Rectum adenocarcinoma (READ), and Stomach adenocarcinoma (STAD), but was low in Kidney renal clear cell carcinoma (KIRC), Kidney renal papillary cell carcinoma (KIRP), and Thyroid carcinoma (THCA). FOXD1 expression remained unchanged in Cervical squamous cell carcinoma and endocervical adenocarcinoma (CESC), Cholangiocarcinoma (CHOL), Kidney Chromophobe (KICH), Lung adenocarcinoma (LUAD), Pancreatic adenocarcinoma (PAAD), Pheochromocytoma and Paraganglioma (PCPG), or Uterine Corpus Endometrial Carcinoma (UCEC) [Figure 12a]. In the TCGA-BRCA data, FOXD1 was markedly upregulated in breast cancer samples[23] [Figure 12b and c]. It expression was significantly higher in breast cancer tissues within the TCGA paired sample dataset [Figure 12d]. Moreover, FOXD1 expression was particularly elevated in the basal subtype of breast cancer [Figure 12e], and its expression level served as a moderately accurate predictor of prognosis in patients with Figure 12f. The predicted downstream target genes of FOXD1 included dishevelled associated activator of morphogenesis 2 (DAAM2) and Putative PIP5K1A and PSMD4-like protein (PIPSL) [Figure 12g], and significant correlation was observed between FOXD1 and DAAM2 expression levels [Figure 12h and i]. In addition, DAAM2 expression was higher in the TNBC samples than in other subtypes and was a highly accurate prognostic indicator [Figure 12j-l]. The copy number variation (CNV) of FOXD1 correlated significantly with the infiltration levels of various immune cells in TNBC, as revealed by the Tumor Immune Estimation Resource (TIMER) database [Figure 12m].
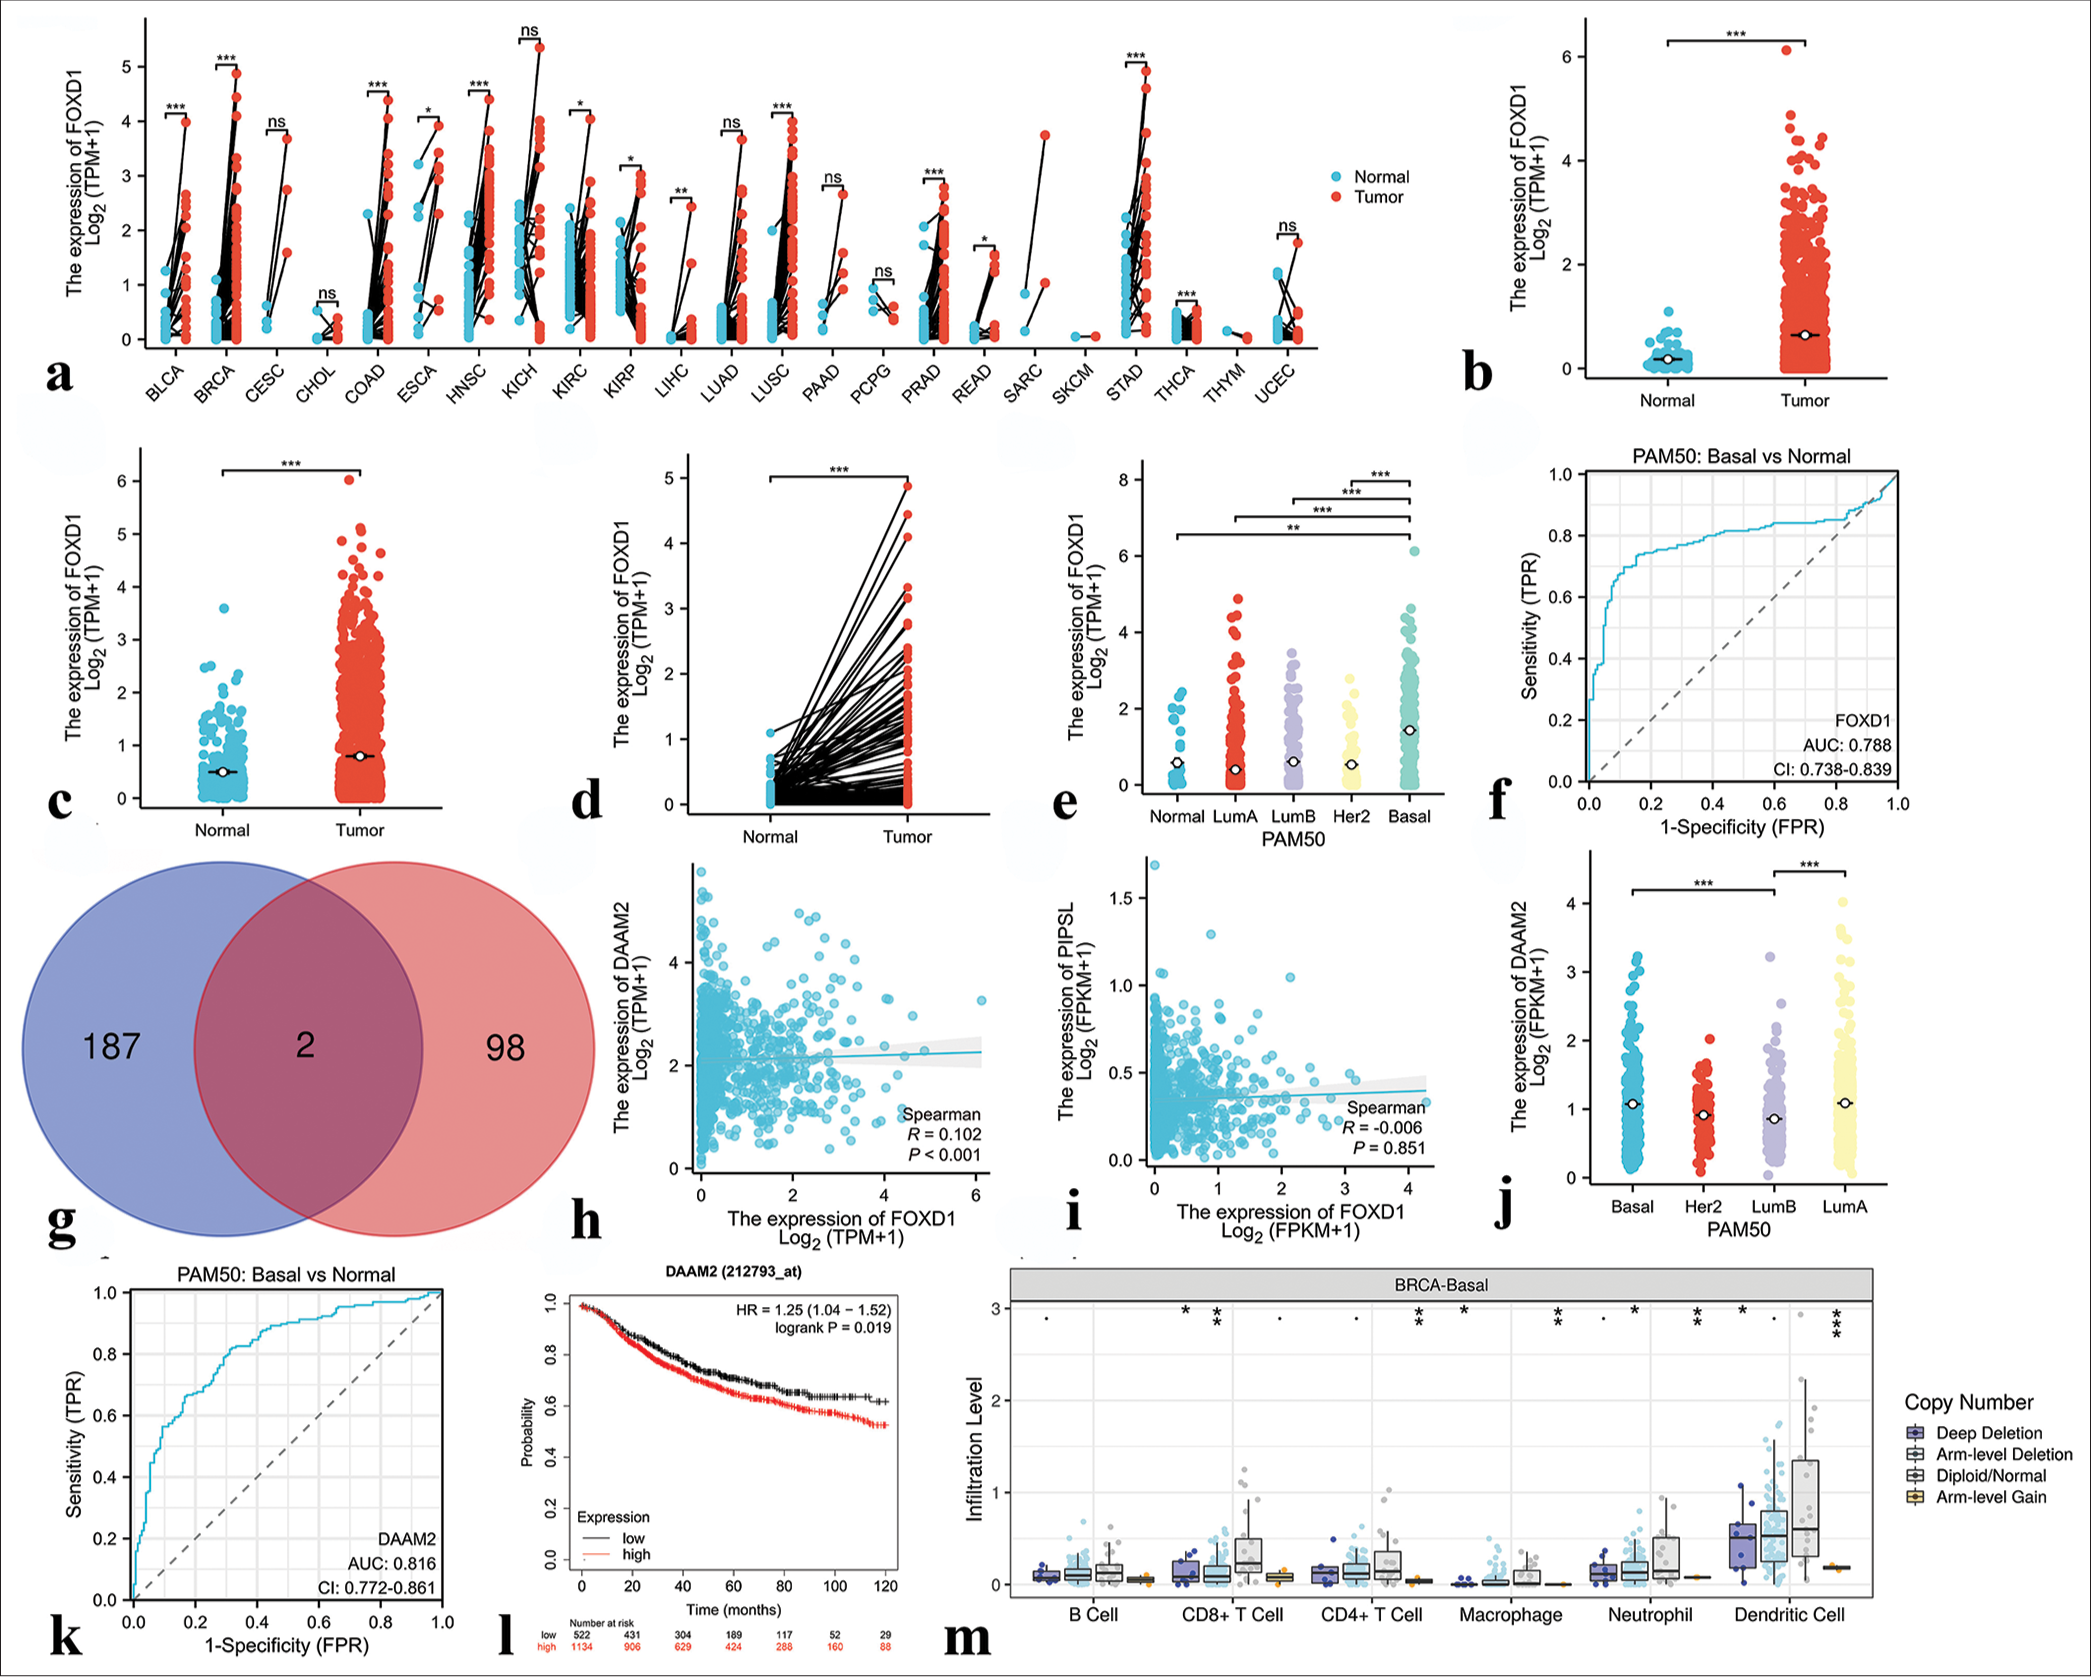
- Results of bioinformatics analysis of Forkhead box D1 (FOXD1). (a) Expression of FOXD1 in 23 human tumors. (b and c) The cancer genome atlas (TCGA) and Genotype-Tissue Expression (GTEx) databases demonstrated the expression levels of FOXD1 in BC and normal tissues. (d) FOXD1 expression in breast cancer (n = 113) and paired normal samples (n = 113) collected from the TCGA database. (e) FOXD1 expression in Prediction Analysis of Microarray 50 (PAM50) subtypes. (f) Receiver operating characteristic (ROC) curve based on FOXD1 expression level. (g) Venn diagram of the downstream target genes of FOXD1 shared between the Harmonizome and GRNdb databases (intersection) and those unique to each database. Blue indicates downstream target genes in Harmonizome, pink indicates downstream target genes in GRNdb, and dark red indicates common downstream target genes shared by both databases. (h) Correlation analysis between FOXD1 and the downstream target gene DAAM2. (i) Correlation analysis between FOXD1 and the downstream target gene PIPSL. (j) DAAM2 expression in the PAM50 subtypes. (k) ROC curve based on DAAM2 expression level. (l) Correlation between DAAM2 expression level and prognosis. (m) Correlation analysis of FOXD1 with immune cells in triple-negative breast cancer. ✶P < 0.05, ✶✶P < 0.01, ✶✶✶P < 0.001. FOXD1: Forkhead box D1, AUC: Area under curve, CI: Confidence interval, FPR: False positive rate, PAM50: Prediction analysis of microarray 50, FPKM: Fragments per kilobase of exon per million mapped fragments, TPM: Transcripts per million reads, HR: Hazard ratio, DAAM2: Dishevelled associated activator of morphogenesis 2.
Similarly, ARNT2 and ZNF132 expression and clinical significance were analyzed across cancers. ARNT2 exhibited higher expression in BRCA and CHOL but lower expression in COAD, KIRC, KIRP, LUAD, and LUSC than in normal tissues [Figure 13a]. ZNF132 displayed higher expression in CHOL and LIHC but lower expression in several cancers than in normal tissues [Figure 14a]. In the TCGA-BRCA data, ARNT2 expression was significantly higher in breast cancer samples than in normal tissues [Figure 13b-d], whereas ZNF132 expression was higher in the normal tissues [Figure 14b-d]. ARNT2 and ZNF132 expression levels showed subtype-specific patterns in breast cancer, and ARNT2 had low expression in basal subtypes [Figure 13e] and ZNF132 had low expression in basal and other subtypes [Figure 14e]. The expression levels of ARNT2 and ZNF132 served as moderately accurate and highly accurate prognostic indicators, respectively, for TNBC [Figures 13f and 14f]. The predicted downstream target genes of ARNT2 included Autophagy-related 3 (ATG3), V-type Proton ATPase Subunit D (ATP6V1D), dynactin-4 (DCTN4), and Biogenesis of Lysosome-related Organelles Complex-1, Subunit 1 (BLOC1S1) [Figure 13g], whereas Glucose Brain Sphingolipidase Gene (GBA) was identified as a downstream target gene of ZNF132 [Figure 14g]. The expression levels of DCTN4 and GBA were significantly correlated with ARNT2 and ZNF132 expression levels, respectively [Figures 13h-k and 14h]. In addition, DCTN4 expression was lower in the TNBC samples than in the other subtypes but was highly accurate in predicting prognosis [Figure 13m-o]. GBA expression was downregulated in the TNBC samples and correlated with favorable prognosis [Figure 14i-k]. Furthermore, the CNV of ARNT2 and ZNF132 influenced immune cell infiltration in TNBC, as observed in the TIMER database [Figures 13p and 14l].
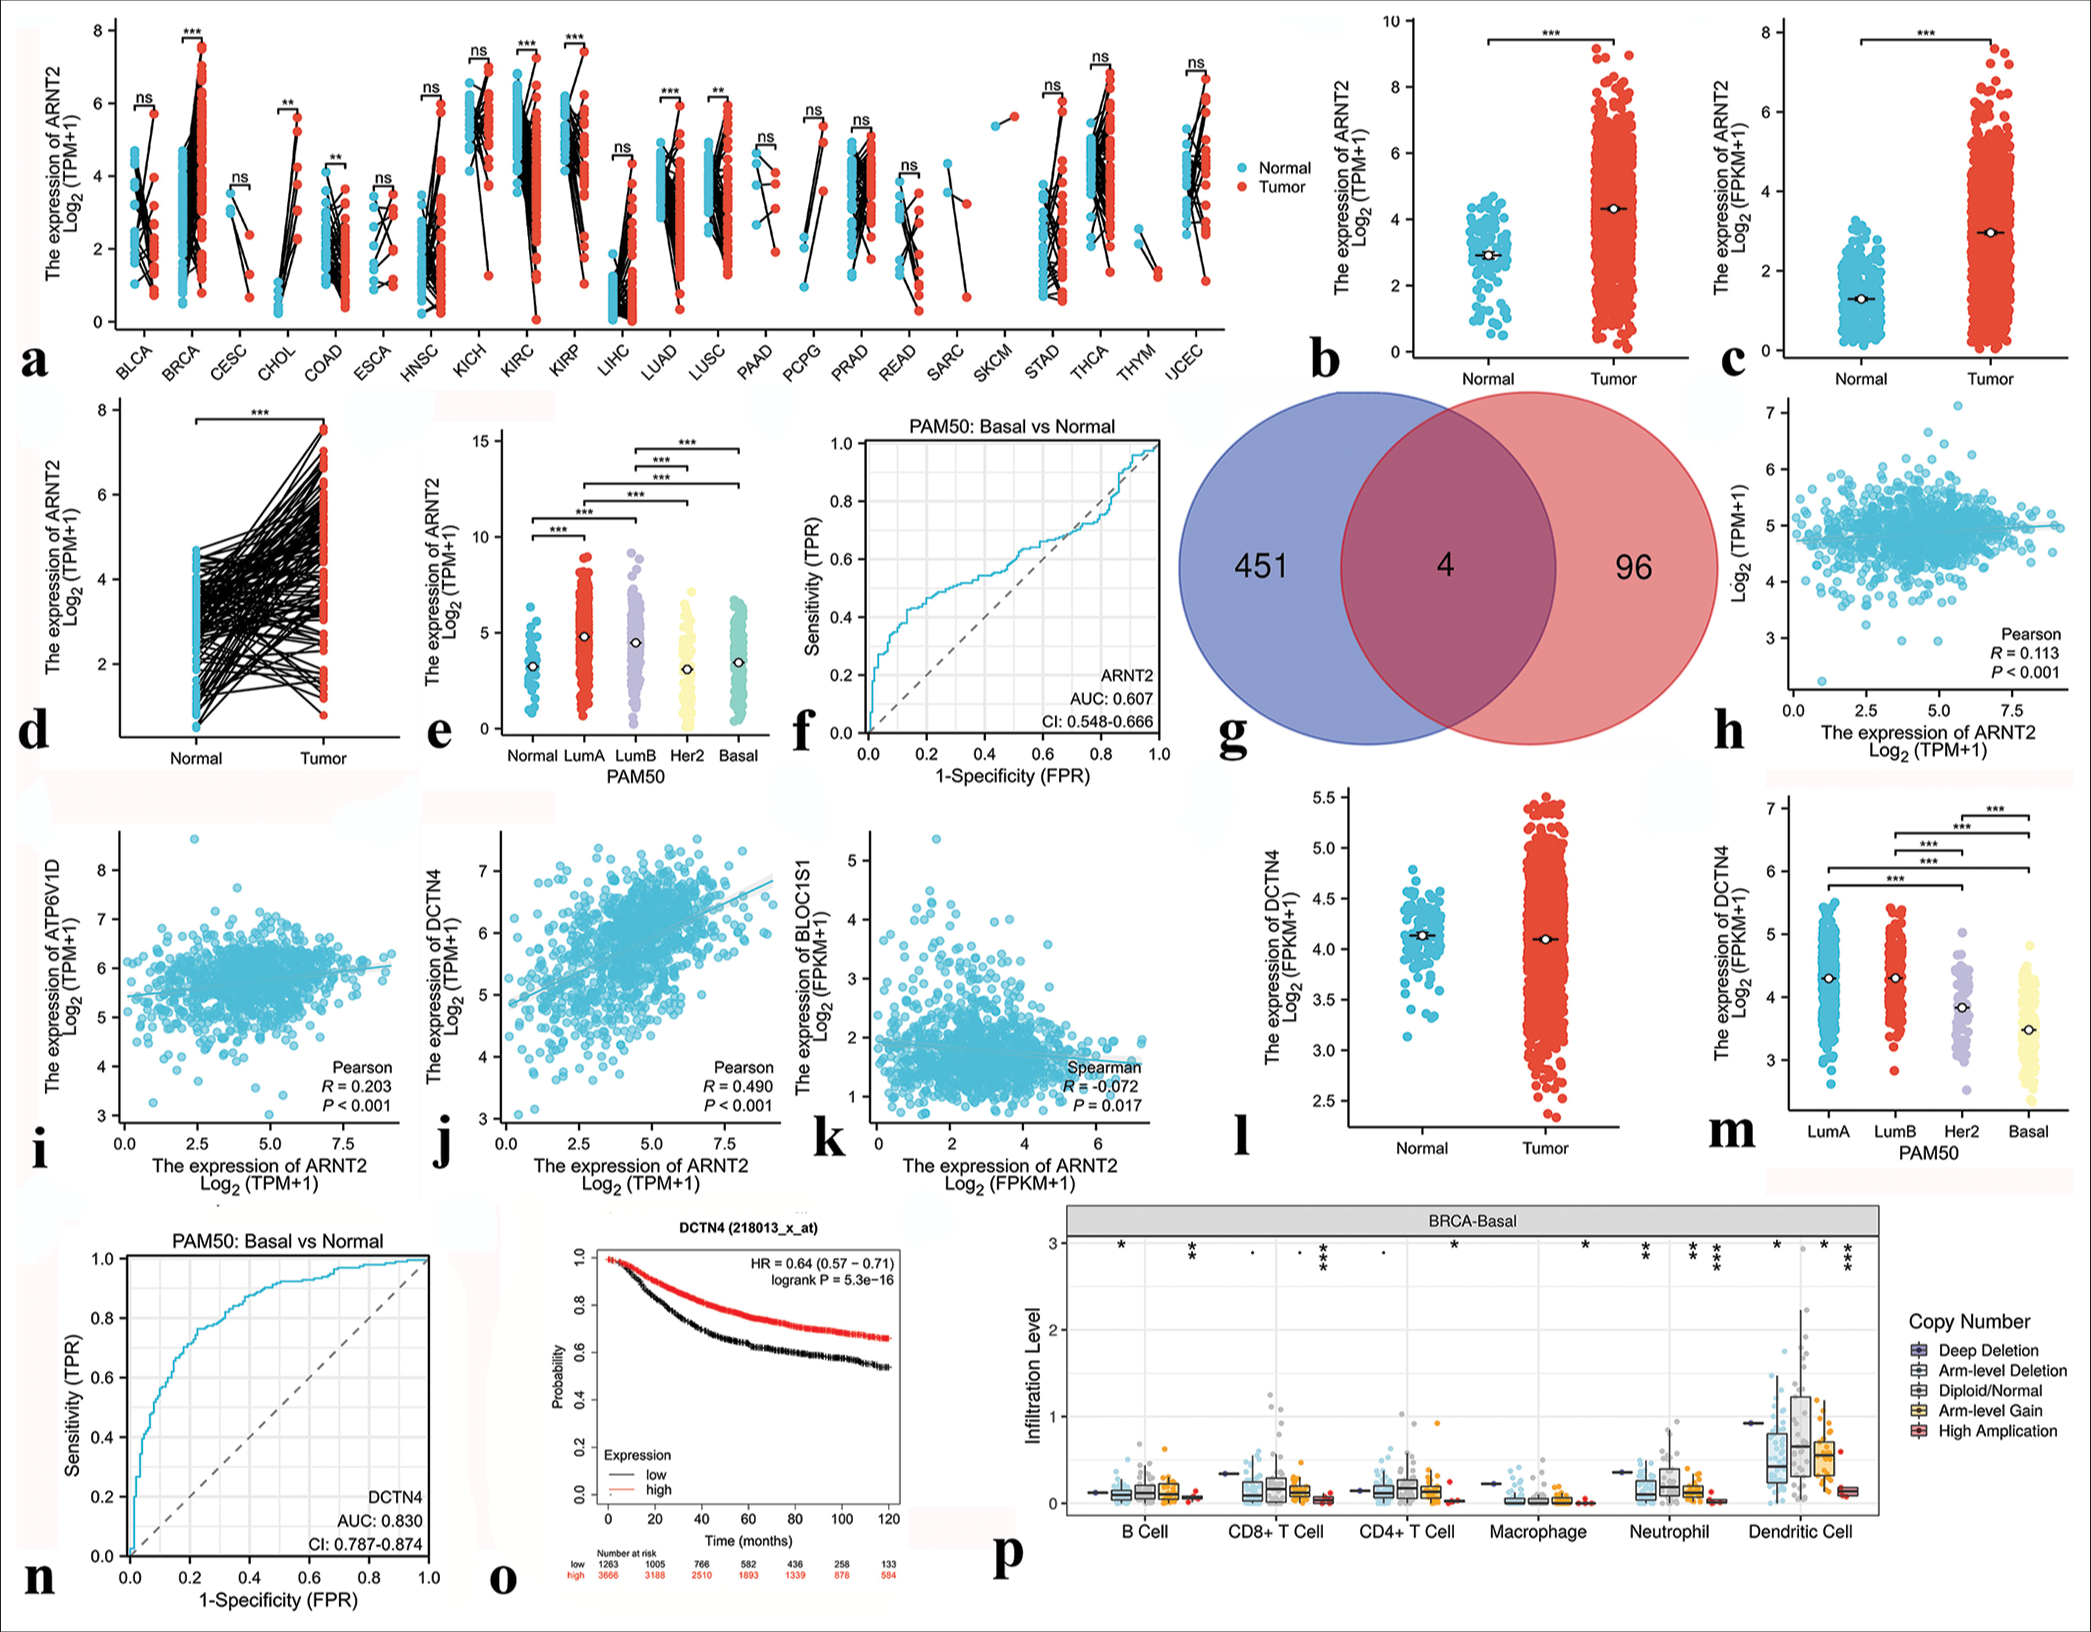
- Results of bioinformatics analysis of Aryl hydrocarbon receptor nuclear translocator 2 (ARNT2). (a) Expression of ARNT2 in 23 human tumors. (b and c) The cancer genome atlas (TCGA) and GTEx databases demonstrated the expression levels of ARNT2 in BC and normal tissues. (d) ARNT2 expression in BC (n = 113) and paired normal samples (n = 113) collected by the TCGA database. (e) ARNT2 expression in PAM50 subtypes. (f) Receiver operating characteristic (ROC) curve based on ARNT2 expression level. (g) Venn diagram of the downstream target genes of ARNT2 shared between ChIP-Atlas database and GRNdb database (intersection) and those unique to each database. Blue indicates the downstream target genes in the ChIP-Atlas database, pink indicates the downstream target genes in the GRNdb database, and dark red indicates the common downstream target genes shared by both databases. (h) Correlation analysis between ARNT2 and downstream target gene ATG3. (i) Correlation analysis between ARNT2 and the downstream target gene ATP6V1D. (j) Correlation analysis between ARNT2 and the downstream target gene DCTN4. (k) Correlation analysis between ARNT2 and the downstream target gene BLOC1S1. (l) DCTN4 expression in breast cancer (n = 1113) and normal samples (n = 113) collected from the TCGA database. (m) DCTN4 expression in the PAM50 subtypes. (n) ROC curve based on DCTN4 expression level. (o) Correlation between DCTN4 expression level and prognosis. (p) Correlation analysis of ARNT2 with immune cells in triple-negative breast cancer. ✶P < 0.05, ✶✶P < 0.01, ✶✶✶P < 0.001. FPR: False positive rate, PAM50: Prediction analysis of microarray 50, FPKM: Fragments per kilobase of exon per million mapped fragments, TPM: Transcripts per million reads, HR: Hazard ratio.
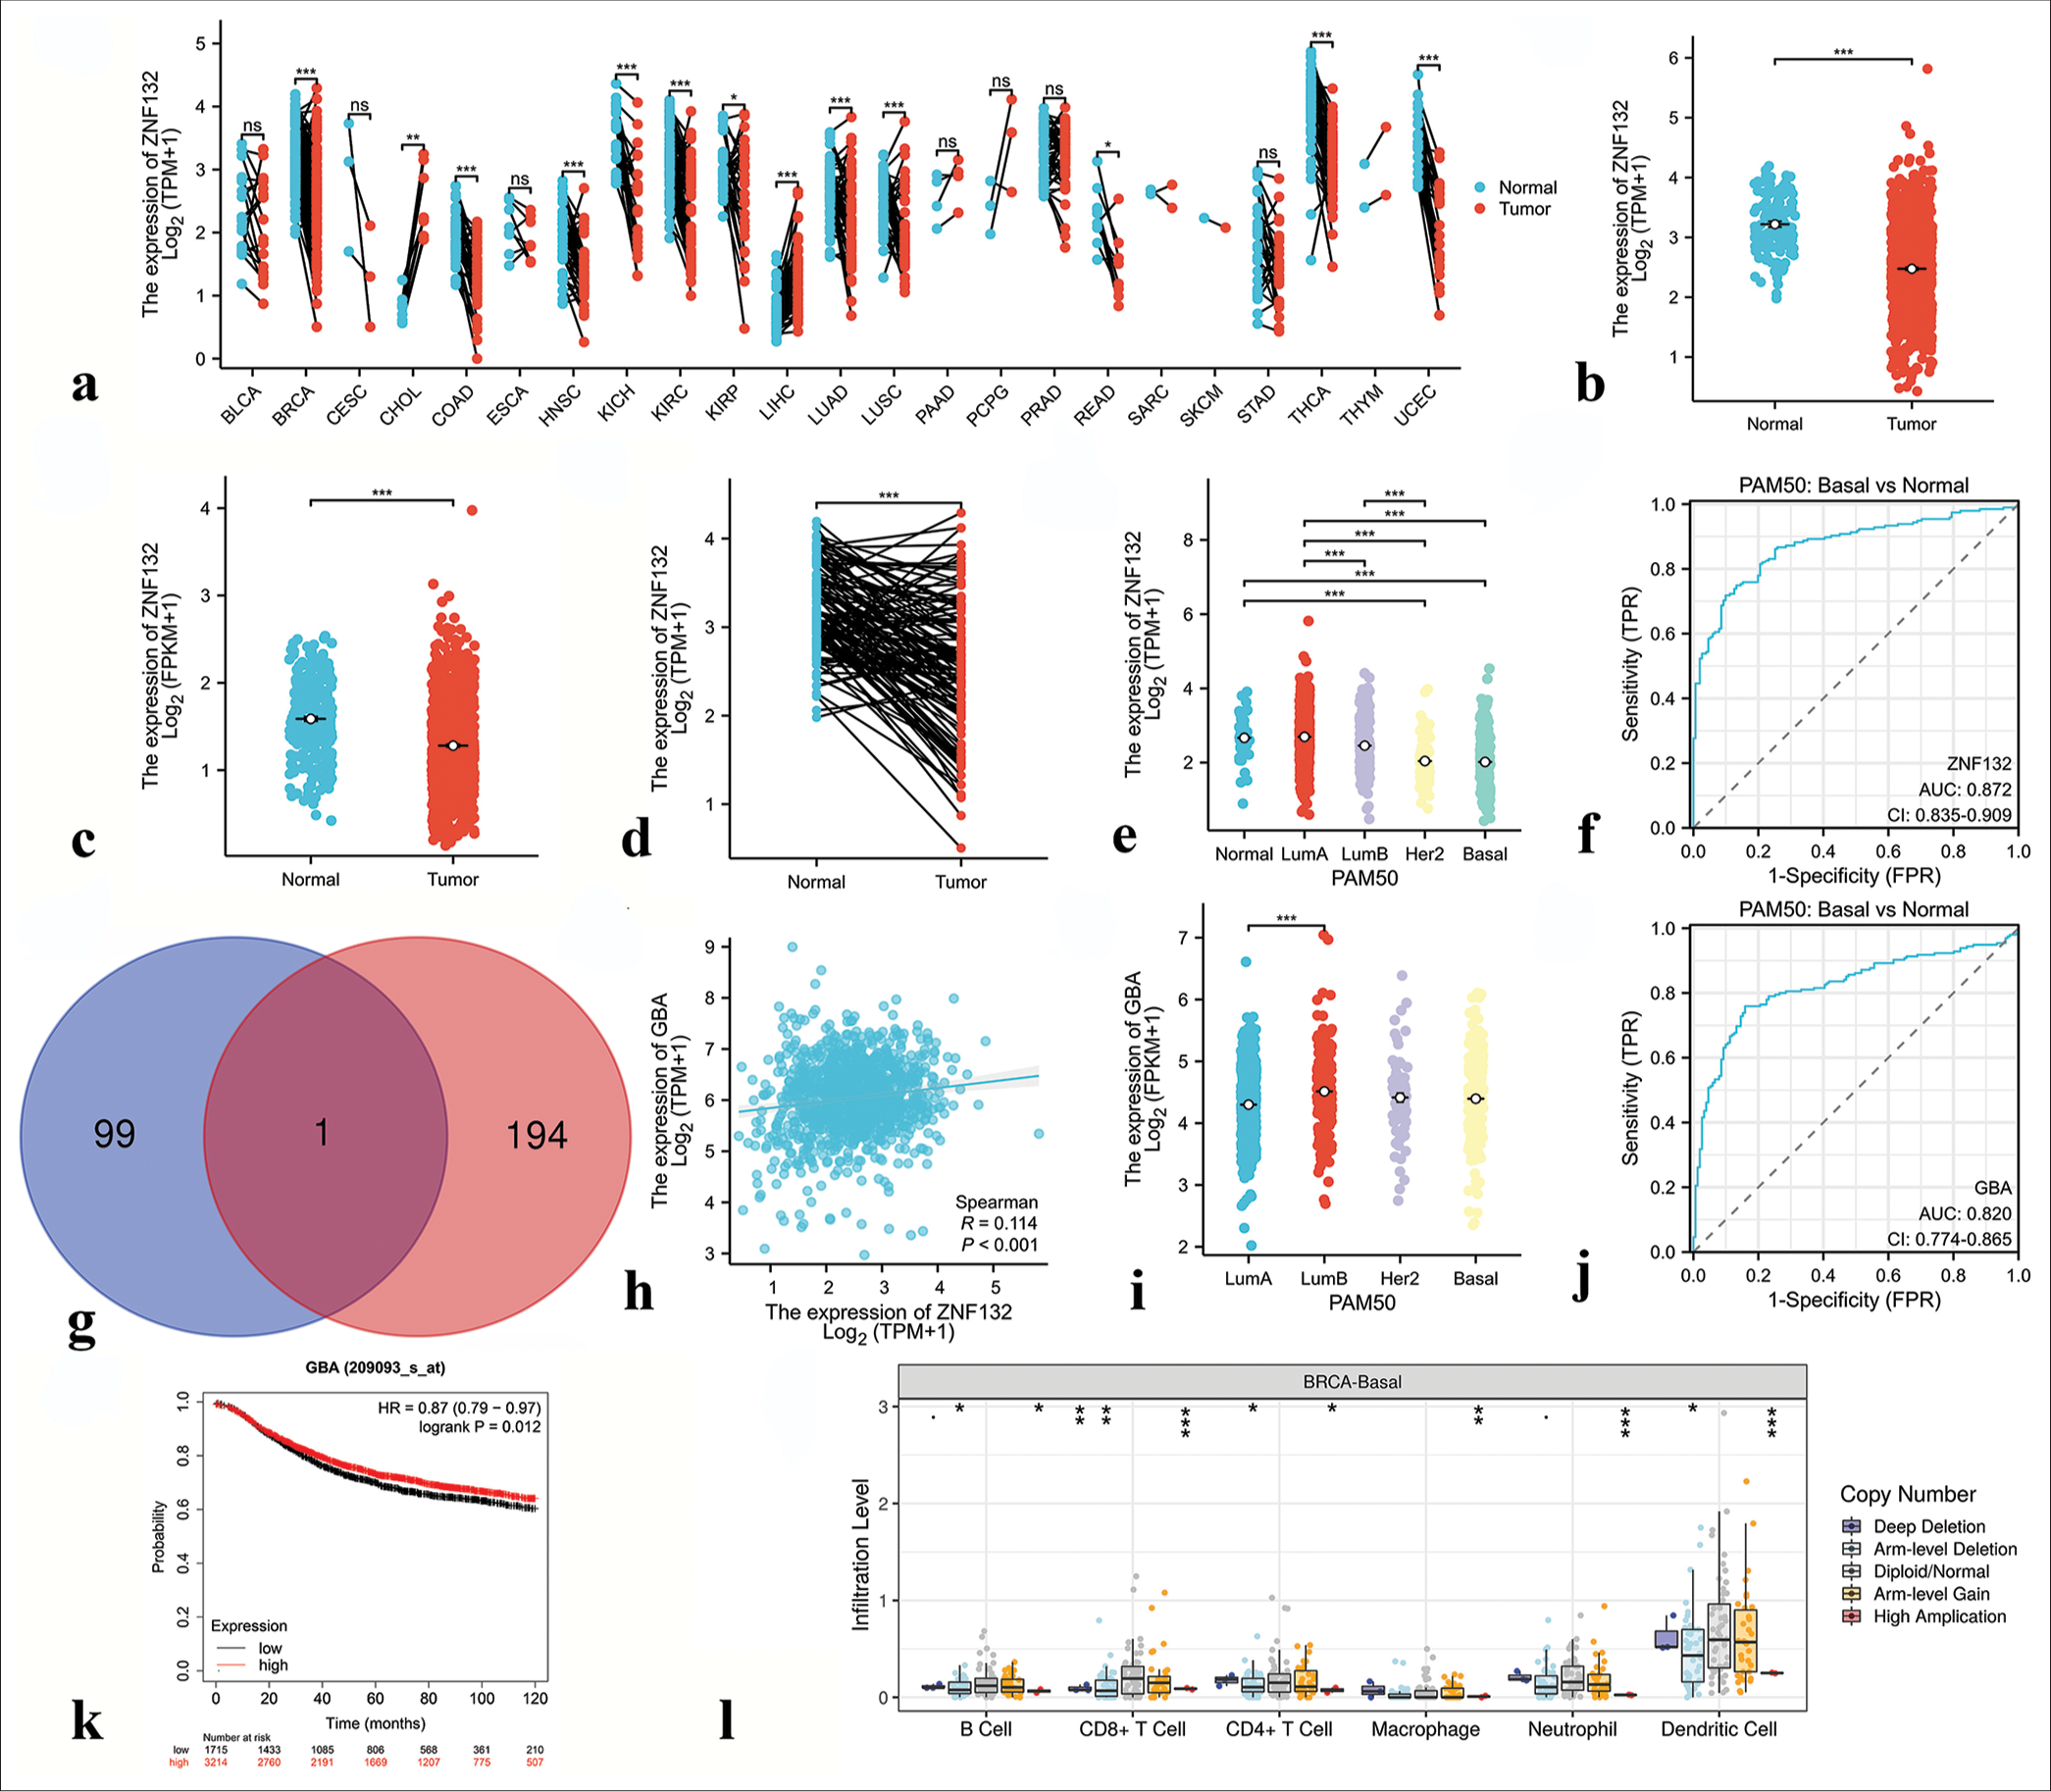
- Results of bioinformatics analysis of zinc finger protein 132 (ZNF132). (a) Expression of ZNF132 in 23 human tumors. (b and c) The cancer genome atlas (TCGA) and GTEx databases demonstrated the expression levels of ZNF132 in BC and normal tissues. (d) ZNF132 expression in BC (n = 113) and paired normal samples (n = 113) collected from the TCGA database. (e) ZNF132 expression in the PAM50 subtypes. (f) Receiver operating characteristic (ROC) curve based on ZNF132 expression level. (g) Venn diagram of the downstream target genes of ZNF132 shared between Cistrome Data Browser database and GRNdb database (intersection) and those unique to each database. Blue indicates the downstream target genes in the Cistrome Data Browser database, pink indicates the downstream target genes in the GRNdb database, and dark red indicates the common downstream target genes shared by both databases. (h) Correlation analysis between ZNF132 and downstream target gene GBA. (i) GBA expression in PAM50 subtypes. (j) ROC curve based on GBA expression level. (k) Correlation between GBA expression level and prognosis. (l) Correlation analysis of ZNF132 with immune cells in triple-negative breast cancer. ✶P < 0.05, ✶✶P < 0.01, ✶✶✶P < 0.001. PAM50: Prediction Analysis of Microarray 50, ZNF: Zinc finger protein, FPKM: Fragments per kilobase of exon model per million mapped fragments, FPR: False positive rate, TPM: Transcripts per million reads, GBA: Glucose brain sphingolipidase gene, HR: Hazard ratio, CD4/8: Cluster of differentiation 4/8, AUC: Area under curve: CI: Confidence interval.
Immunohistochemical staining validation of hub transcription factors
To examine the expression of hub transcription factors, we conducted immunohistochemical staining of tissue slides from 57 patients with TNBC, comprising 30 individuals with post-operative relapse and 27 without relapse. The immunohistochemical scores for FOXD1 were higher in the relapsed group [Figure 15a], whereas the immunohistochemical scores for ARNT2 and ZNF132 were higher in the non-relapsed group [Figure 15b and c].
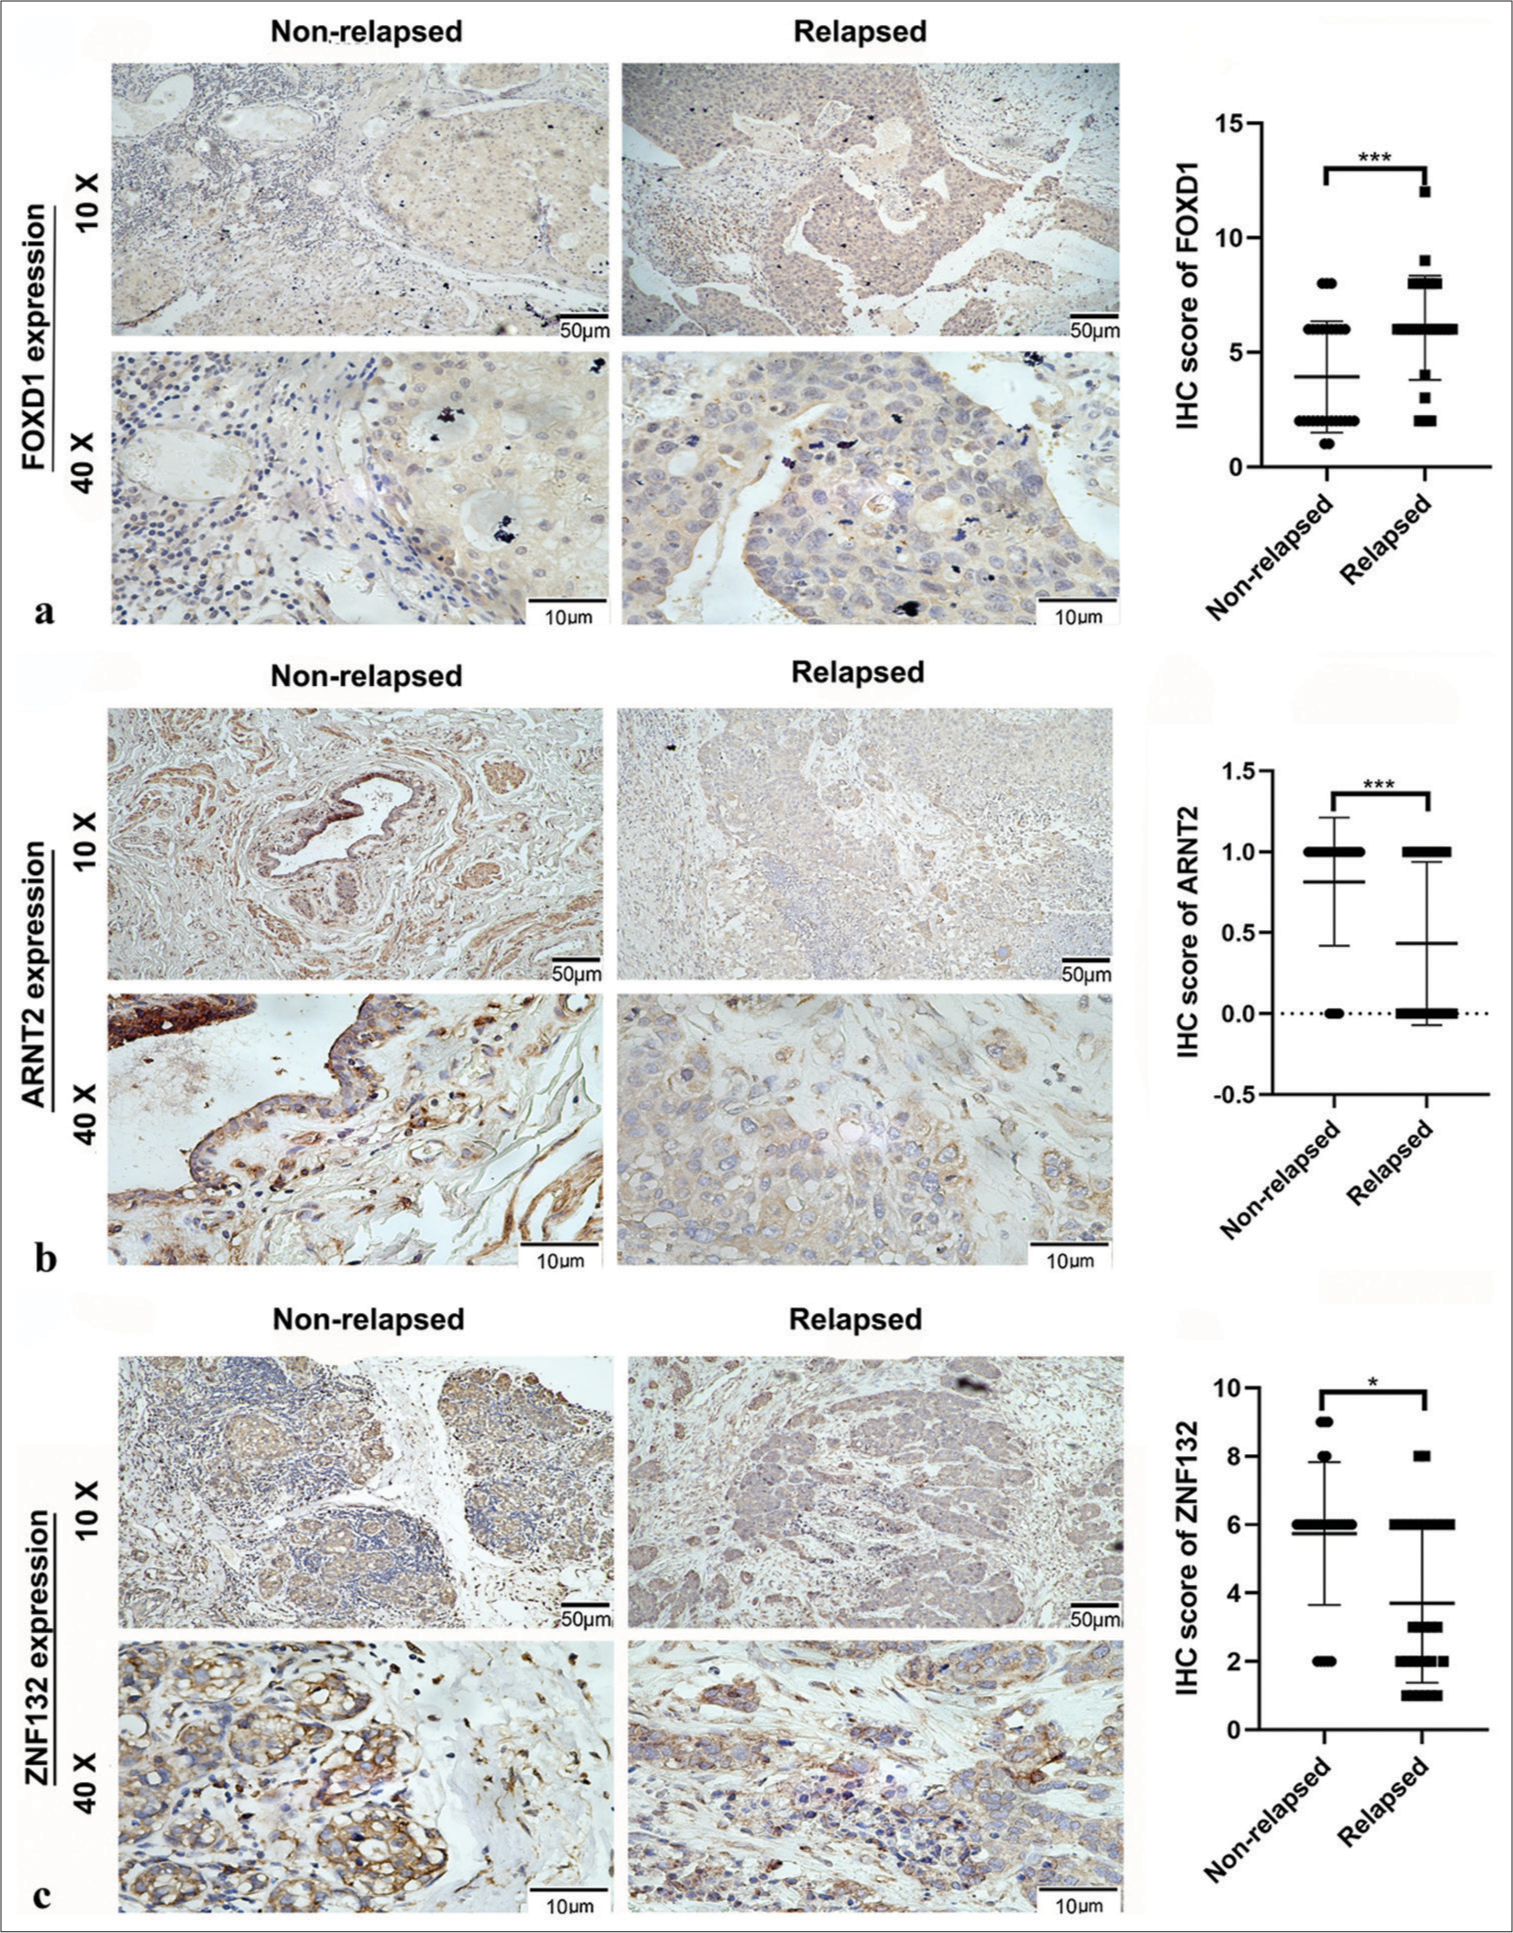
- Relative expression of hub transcription factors in 30 tissues with postoperative relapse and 27 without relapse, as detected by immunohistochemistry (IHC). Panel (a) shows Forkhead box D1 (FOXD1) expression, (b) depicts aryl hydrocarbon receptor nuclear translocator 2 expression (ARNT2), and (c) illustrates zinc finger protein (ZNF) 132 expression. ✶P < 0.05, ✶✶✶P < 0.001.
Tables 1-3 summarizes clinicopathologic variables related to the prognoses of patients with TNBC and the immunohistochemical scores of FOXD1, ARNT2, and ZNF132. Specifically, high FOXD1 expression was significantly correlated with N classification [Table 1], and high ARNT2 expression was significantly associated with American Joint Committee on Cancer (AJCC) stage [Table 2]. Meanwhile, high ZNF132 expression showed significant correlations with body mass index (BMI), menstrual state, T classification, N classification, and AJCC stage [Table 3].
| Clinicopathologic feature | FOXD1 expression | value | |
|---|---|---|---|
| Low | High | ||
| All cases | 17 | 40 | |
| BMI (SD) | 4.37 | 4.21 | 0.861 |
| Age | |||
| ≤60 | 11 | 27 | 1 |
| >60 | 6 | 13 | |
| Menstrual state | |||
| Premenopause | 7 | 19 | 0.882 |
| Menopause | 10 | 21 | |
| Age of menarche | |||
| ≤13 | 4 | 13 | 0.718 |
| >13 | 13 | 27 | |
| T classification | |||
| T 1 | 5 | 17 | 0.528 |
| T 2–4 | 12 | 23 | |
| N classification | |||
| N 0 | 4 | 24 | 0.026 |
| N 1–3 | 13 | 16 | |
| M classification | |||
| M0 | 17 | 37 | 0.609 |
| M1 | 0 | 3 | |
| AJCC stage | |||
| I/II | 8 | 31 | 0.051 |
| III/IV | 9 | 9 | |
P-value was determined using the Chi-square test, where P<0.05 was considered statistically significant. BMI: Body mass index, FOXD1: Forkhead box D1, TNBC: Triple-negative breast cancer, SD: Standard deviation, T1: Tumor diameter is less than 2 cm, T2-4: Tumor diameter is greater than 2 cm, or the tumor invades the chest wall or skin, N0: No lymph nodes metastasis, N1-3: Axillary lymph nodes metastasis or supraclavicular lymph nodes metastasis, M0: No distant metastasis, M1: Distant metastasis, AJCC: American Joint Committee on Cancer.
| Clinicopathologic feature | ARNT2 expression | P-value | |
|---|---|---|---|
| Low | High | ||
| All cases | 20 | 37 | |
| BMI (SD) | 3.64 | 4.54 | 0.635 |
| Age | |||
| ≤60 | 12 | 26 | 0.624 |
| >60 | 8 | 11 | |
| Menstrual state | |||
| Premenopause | 8 | 18 | 0.729 |
| Menopause | 12 | 19 | |
| Age of menarche | |||
| ≤13ge | 6 | 11 | 1 |
| >13 | 14 | 26 | |
| T classification | |||
| T1 | 7 | 15 | 0.901 |
| T2–4 | 13 | 22 | |
| N classification | |||
| N0 | 8 | 20 | 0.462 |
| N 1–3 | 12 | 17 | |
| M classification | |||
| M0 | 18 | 36 | 0.578 |
| M1 | 2 | 1 | |
| AJCC stage | |||
| I/II | 9 | 30 | 0.012 |
| III/IV | 11 | 7 | |
P-values were determined using the Chi-square test, where P<0.05 was considered statistically significant. ARNT2: Aryl hydrocarbon receptor nuclear translocator 2, BMI: Body mass index, TNBC: Triple-negative breast cancer, SD: Standard deviation, T1: Tumor diameter is less than 2 cm, T2-4: Tumor diameter is greater than 2 cm, or the tumor invades the chest wall or skin, N0: No lymph nodes metastasis, N1-3: Axillary lymph nodes metastasis or supraclavicular lymph nodes metastasis, M0: No distant metastasis, M1: Distant metastasis, AJCC: American Joint Committee on Cancer.
| Clinicopathologic feature | ZNF132 expression | P-value | |
|---|---|---|---|
| Low | High | ||
| All cases | 20 | 37 | |
| BMI (SD) | 4.24 | 3.53 | <0.001 |
| Age | |||
| ≤60 | 13 | 25 | 1 |
| >60 | 7 | 12 | |
| Menstrual state | |||
| Premenopause | 5 | 21 | 0.044 |
| Menopause | 15 | 16 | |
| Age of menarche | |||
| ≤13ge | 3 | 14 | 0.135 |
| >13 | 17 | 23 | |
| T classification | |||
| T1 | 12 | 10 | 0.031 |
| T2–4 | 8 | 27 | |
| N classification | |||
| N0 | 16 | 12 | 0.002 |
| N1–3 | 4 | 25 | |
| M classification | |||
| M0 | 20 | 34 | 0.492 |
| M1 | 0 | 3 | |
| AJCC stage | |||
| I/II | 18 | 21 | 0.023 |
| III/IV | 2 | 16 | |
P-value was determined using the Chi-square test, where P<0.05 was considered statistically significant. BMI: Body mass index, TNBC: Triple-negative breast cancer, SD: Standard deviation, ZNF132: Zinc finger protein 132, T1: Tumor diameter is less than 2 cm, T2-4: Tumor diameter is greater than 2 cm, or the tumor invades the chest wall or skin, N0: No lymph nodes metastasis, N1-3: Axillary lymph nodes metastasis or supraclavicular lymph nodes metastasis, M0: No distant metastasis, M1: Distant metastasis, AJCC: American Joint Committee on Cancer.
Verification of expression levels of hub transcription factors in TNBC tissues by qRT-PCR and western blotting
PCR results from 20 pairs of TNBC tissues indicated significantly higher mRNA expression levels of FOXD1 in cancer tissues than in paracancer normal tissues (P < 0.05; [Figure 16a]). Conversely, the mRNA expression levels of ARNT2 and ZNF132 were significantly lower in cancer tissues (P < 0.05; [Figure 16b and c]). Western blotting results further confirmed the upregulation of FOXD1 in cancer (C) tissues (P < 0.001; [Figure 17a and b]), whereas ARNT2 and ZNF132 were significantly upregulated in the paracancer normal (N) tissues (P < 0.01; [Figure 17a,c,d]).
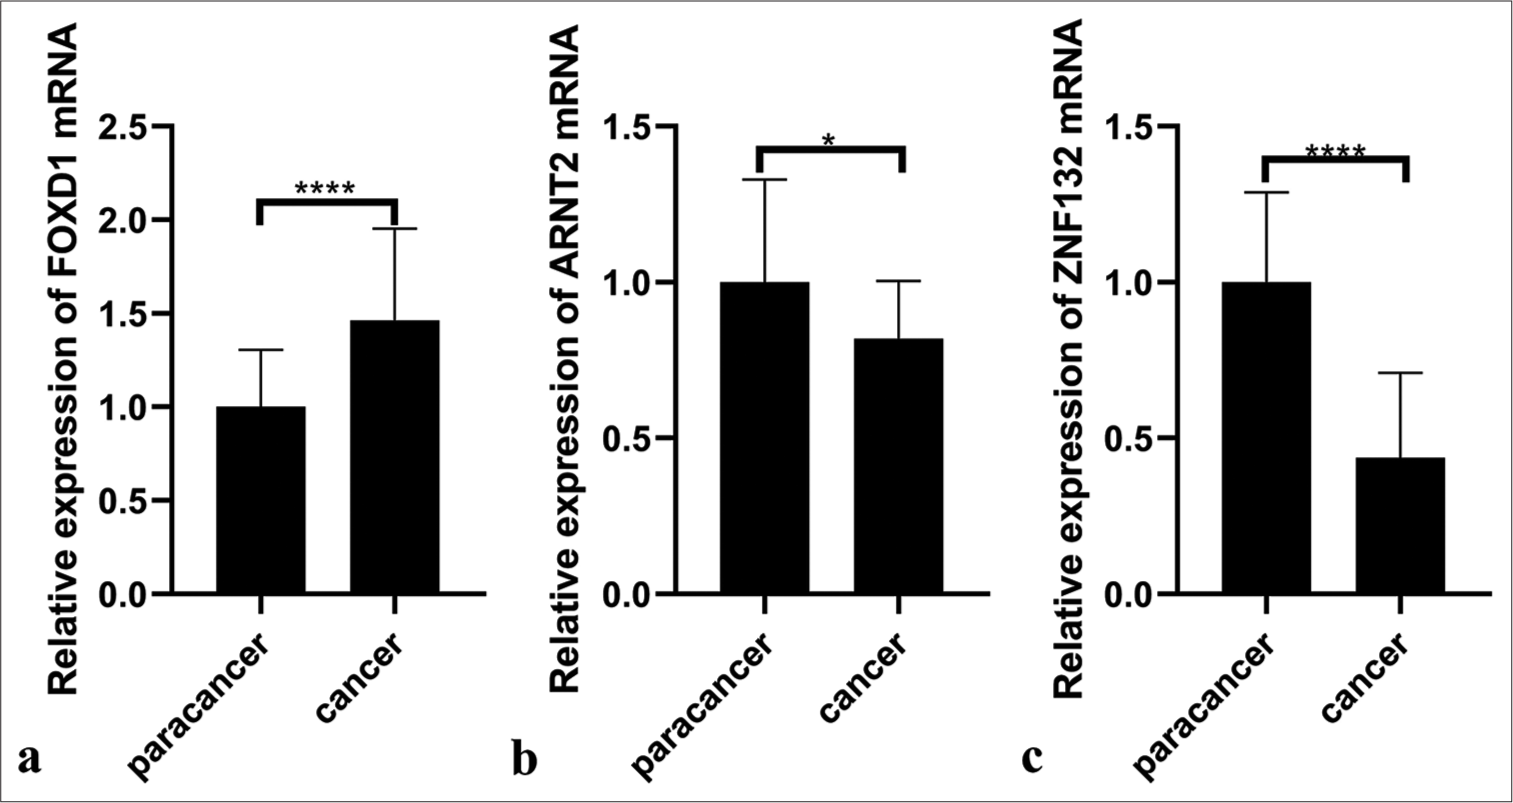
- Polymerase chain reaction illustrating RNA expression of three hub transcription factors in paracancer (n = 20) and cancer tissues (n = 20). (a) Forkhead box D1 (FOXD1), (b) Aryl hydrocarbon receptor nuclear translocator 2 (ARNT2), and (c) zinc finger protein 132 (ZNF132). ✶P <0.05, ✶✶✶✶P<0.0001.
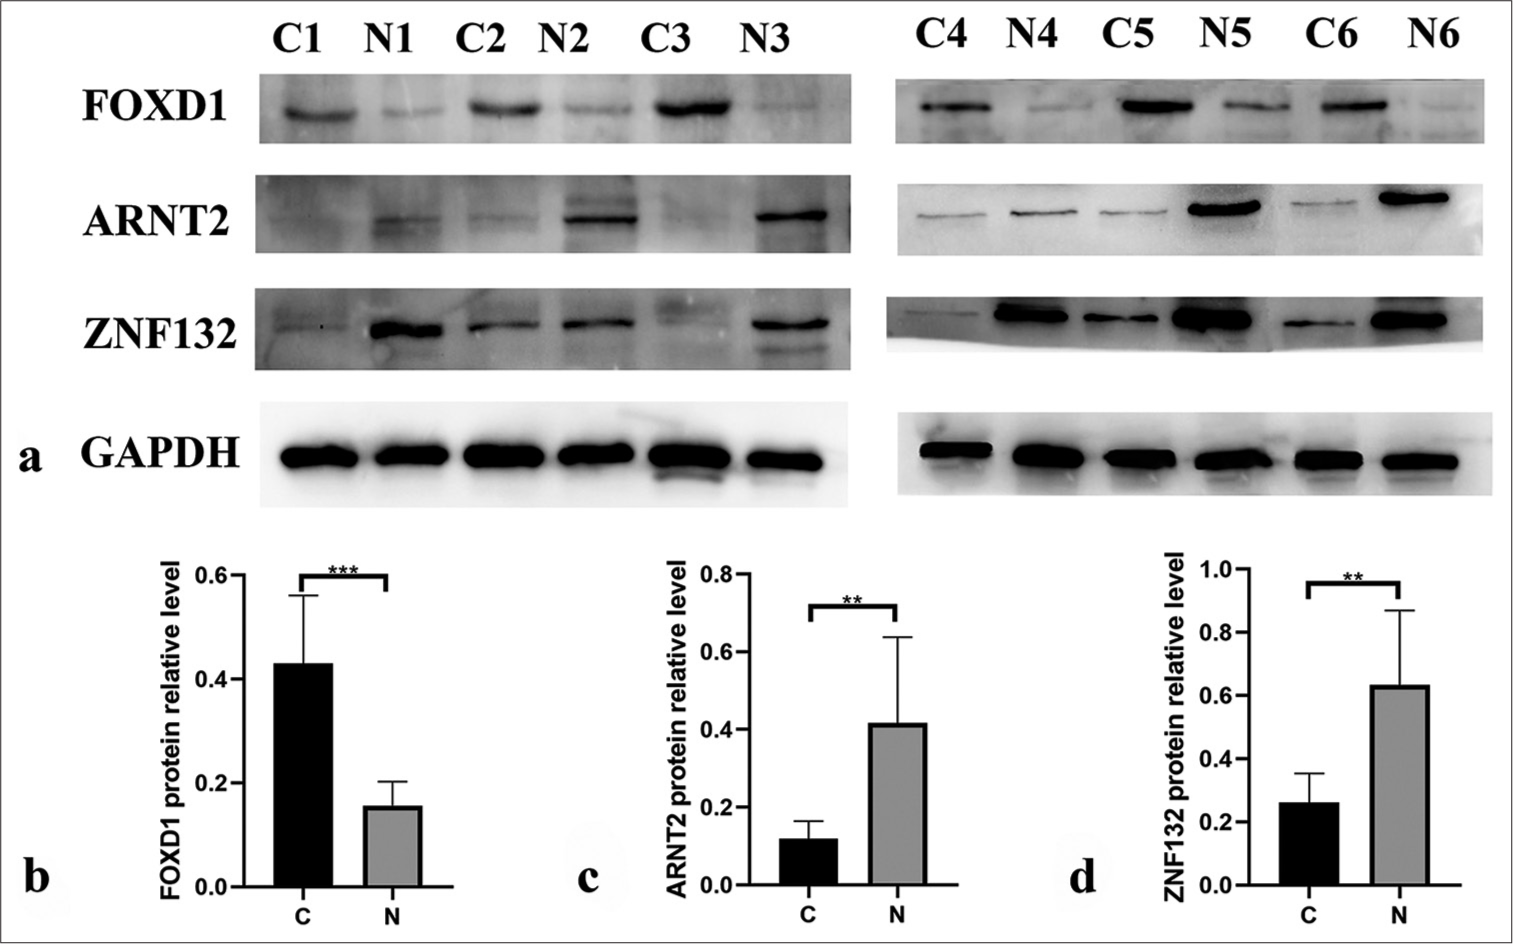
- Western blotting showing the protein expression levels of three hub transcription factors in paracancer (n = 6) and cancer tissues (n = 6). (b) Forkhead box D1 (FOXD1), (c) aryl hydrocarbon receptor nuclear translocator 2 (ARNT2), and (d) zinc finger protein (ZNF) 132. ✶✶P < 0.01, ✶✶✶P < 0.001.
DISCUSSION
In this study, we acquired the gene expression profiles and clinical prognosis data of TNBC from the GEO website. Utilizing WGCNA analysis, we found that the green-yellow, magenta, and turquoise modules had the highest correlations with TNBC’s DFS. To ensure the identified regulatory factors were transcription factors, we intersected these modules with the HumanTFDB and identified potential DFS-related transcription factors. Through univariate Cox regression analysis, we ultimately identified three hub transcription factors: FOXD1, ARNT2, and ZNF132. Survival analysis demonstrated the correlations between the three transcription factors and prognosis.
FOXD1, which belongs to the forkhead gene transcription factor family and locates on 5q13.2, has been associated with tumorigenesis.[25-29] FOXD1 dysfunction can contribute to various diseases, demonstrating its potential as a biomarker and therapeutic target.[30] FOXD1 expression is elevated across multiple tumor types, including colorectal, ovarian, nasopharyngeal, lung, gastric, breast, and pancreatic tumors.[31,32] Our pan-cancer analysis corroborated these findings, demonstrating elevated FOXD1 expression across various tumors and significantly high expression in TNBC. In addition, qRT-PCR and Western blotting results confirmed that FOXD1 expression in TNBC tissues is elevated relative to that in normal tissues. Moreover, FOXD1 is a gene associated with the prognosis of breast cancer.[33] Survival analysis and immunohistochemistry staining further linked high FOXD1 expression with increased recurrence and metastasis risk post-surgery. Kumegawa et al.[34] reported gene expression and enhancer profiles in basal-like breast cancer cell lines, finding that some enhancer genes were regulated by FOXD1. These findings are consistent with those of previous reports regarding FOXD1 function associated with tumor progression and metastasis. Further, they highlighted that FOXD1 may be an oncogenic transcription factor that activates tumor-promoting gene expression programs by modulating enhancers. Furthermore, correlation analysis identified DAAM2 as a downstream target gene of FOXD1. DAAM2 is a member of the DAAM subfamily and contains thousands of amino acids. It is widely expressed in the hypothalamus, spinal cord, eyes, lungs, kidneys, prostate, glioma, melanoma, adenocarcinoma of the breast, and chondrosarcoma in adults. In addition, DAAM2 plays a key role in the WNT/PCP (plantar cell polarity) signaling pathway, may promote tumorigenesis and tumor proliferation,[35] and is strongly associated with the proliferation, migration, and invasion of breast cancer cells.[36] These features suggest the involvement of DAAM2 in breast cancer progression.
ARNT2 is a member of the Basic Helix-Loop-Helix ( bHLH)/Per-Arnt-Sim (PAS) family and has been linked to organ development.[37] Its association with cancer prognosis has not been comprehensively explored. Our pan-cancer analysis revealed significantly upregulated ARNT2 expression in breast and bile duct cancer. The results of bioinformatics analyses showed that the expression level of ARNT2 decreased in TNBC, and qRT-PCR and Western blotting verified that ARNT2 was significantly underexpressed in TNBC tissues. ARNT2 has been extensively studied in breast cancer cell lines, but studies in other cancer cell lines have confirmed that the overexpression of ARNT2 is associated with decreased cell proliferation and enhanced prognosis.[38,39] Expression analysis identified DCTN4 as an ARNT2 target gene, and high DCTN4 expression correlated positively with breast cancer prognosis. These results are consistent with previous findings in colon adenocarcinoma.[40]
ZNF132 is located on chromosome 19q13.4 and is a zinc finger transcription factor with KRAB domains implicated in transcriptional repression.[41] ZNF132 has low expression in various cancers, including breast, prostate, esophageal, head and neck, and lung cancer, and is associated with increased cell growth, migration, and invasion.[42-44] Our survival analysis confirmed the positive correlation between ZNF132 expression and TNBC prognosis, consistent with previous findings. Liu et al.[44] confirmed that the protein levels of ZNF132 in breast cancer cell lines were decreased compared to normal breast epithelial cell line, suggesting that ZNF132 can be used as a diagnostic indicator for TNBC and may even be an important target for TNBC treatment. In addition, GBA emerged as a target gene of ZNF132, showing downregulated expression in TNBC. High GBA expression correlates with favorable breast cancer prognosis.[45-47]
Despite these insights, our study has limitations. First, it lacks functional and mechanistic investigations, necessitating further in vitro and in vivo experiments to elucidate the underlying mechanisms of these hub transcription factors in TNBC. Second, we did not analyze other genes within the modules. Finally, the validation sample size was small.
SUMMARY
This study identified FOXD1, ARNT2, and ZNF132 as hub transcription factors associated with the DFS of TNBC. These factors can serve as independent prognostic indicators for patients with TNBC. However, translating these findings into clinical practice and elucidating their molecular mechanisms are challenges that need to be addressed in future research.
AVAILABILITY OF DATA AND MATERIALS
The datasets used and/or analyzed during the present study are available from the corresponding author on reasonable request.
ABBREVIATIONS
ARNT2: Aryl hydrocarbon receptor nuclear translocator 2
BMI: Body Mass Index
DFS: Disease-free survival
FOXA1: Forkhead Box A1
FOXD1: Forkhead Box D1
GEO: Gene Expression Omnibus
GO: Gene Ontology
GS: Gene significance
HER2: Human Epidermal Growth Factor Receptor 2
HumanTFDB: Human Transcription Factor Database
KEGG: Kyoto Encyclopedia of Genes and Genomes
KLF5: Kruppel-like factor 5
ME: Module eigengene
PITX1: Paired-like homeodomain transcription factor1
qRT-PCR: Quantitative Reverse Transcription Polymerase Chain Reaction
TNBC: Triple-Negative Breast Cancer
WGCNA: Weighted gene co-expression network analysis
ZNF132: Zinc Finger Protein 132
AUTHOR CONTRIBUTIONS
HPW and RH: Drafted the manuscript, prepared figures, analyzed the data, and prepared tables; WL, YZ, SM, YWL: Validated and processed data; JH and YXQ: Designed this study. All authors reviewed and approved the manuscript.
ETHICS APPROVAL AND CONSENT TO PARTICIPATE
The Fourth Hospital of Hebei Medical University’s Ethical Committee approved this study (approval ID: 2019MEC067). Written informed consent was obtained from the patients.
CONFLICT OF INTEREST
The authors declare no conflict of interest.
EDITORIAL/PEER REVIEW
To ensure the integrity and highest quality of CytoJournal publications, the review process of this manuscript was conducted under a double-blind model (authors are blinded for reviewers and vice versa) through an automatic online system.
FUNDING
Not applicable.
References
- Nano to rescue: Repository of nanocarriers for targeted drug delivery to curb breast cancer. 3 Biotech. 2022;12:70.
- [CrossRef] [PubMed] [Google Scholar]
- Molecular signaling network and therapeutic developments in breast cancer brain metastasis. Adv Cancer Biol Metastasis. 2023;7:100079.
- [CrossRef] [PubMed] [Google Scholar]
- PAM50 gene signatures and breast cancer prognosis with adjuvant anthracycline-and taxane-based chemotherapy: Correlative analysis of C9741 (Alliance) NPJ Breast Cancer. 2016;2:15023.
- [CrossRef] [PubMed] [Google Scholar]
- CSA antisense targeting enhances anticancer drug sensitivity in breast cancer cells, including the triple-negative subtype. Cancers (Basel). 2022;14:1687.
- [CrossRef] [PubMed] [Google Scholar]
- Unique cartilage matrix-associated protein inhibits the migratory and invasive potential of triple-negative breast cancer. Biochem Biophys Res Commun. 2020;530:680-5.
- [CrossRef] [PubMed] [Google Scholar]
- Androgen receptor, EGFR, and BRCA1 as biomarkers in triple-negative breast cancer: A meta-analysis. Biomed Res Int. 2015;2015:357485.
- [CrossRef] [PubMed] [Google Scholar]
- Fibroblast growth factor receptor 4 as a prognostic indicator in triple-negative breast cancer. Transl Cancer Res. 2020;9:6881-8.
- [CrossRef] [PubMed] [Google Scholar]
- Beyond the limitation of targeted therapy: Improve the application of targeted drugs combining genomic data with machine learning. Pharmacol Res. 2020;159:104932.
- [CrossRef] [PubMed] [Google Scholar]
- An integrated genomic strategy to identify CHRNB4 as a diagnostic/prognostic biomarker for targeted therapy in head and neck cancer. Cancers (Basel). 2020;12:1324.
- [CrossRef] [PubMed] [Google Scholar]
- Neuropilin-1 is upregulated in the adaptive response of prostate tumors to androgen-targeted therapies and is prognostic of metastatic progression and patient mortality. Oncogene. 2017;36:3417-27.
- [CrossRef] [PubMed] [Google Scholar]
- WNT5A as a therapeutic target in breast cancer. Cancer Metastasis Rev. 2018;37:767-78.
- [CrossRef] [PubMed] [Google Scholar]
- Expression analysis and regulation of GLI and its correlation with stemness and metabolic alteration in human brain tumor. 3 Biotech. 2023;13:10.
- [CrossRef] [PubMed] [Google Scholar]
- Expression of KLF5 is a prognostic factor for disease-free survival and overall survival in patients with breast cancer. Clin Cancer Res. 2006;12:2442-8.
- [CrossRef] [PubMed] [Google Scholar]
- Bioinformatics analysis of prognostic value of PITX1 gene in breast cancer. Biosci Rep. 2020;40:BSR20202537.
- [CrossRef] [PubMed] [Google Scholar]
- GATA-3 and FOXA1 expression is useful to differentiate breast carcinoma from other carcinomas. Hum Pathol. 2016;47:26-31.
- [CrossRef] [PubMed] [Google Scholar]
- WGCNA: An R package for weighted correlation network analysis. BMC Bioinformatics. 2008;9:559.
- [CrossRef] [PubMed] [Google Scholar]
- Identification of susceptibility modules and genes for cardiovascular disease in diabetic patients using WGCNA analysis. J Diabetes Res. 2020;2020:4178639.
- [CrossRef] [PubMed] [Google Scholar]
- Visualizing and interpreting cancer genomics data via the Xena platform. Nat Biotechnol. 2020;38:675-8.
- [CrossRef] [PubMed] [Google Scholar]
- Identification of invasion-metastasis-associated microRNAs in hepatocellular carcinoma based on bioinformatic analysis and experimental validation. J Transl Med. 2018;16:266.
- [CrossRef] [PubMed] [Google Scholar]
- TIMER: A web server for comprehensive analysis of tumor-infiltrating immune cells. Cancer Res. 2017;77:e108-10.
- [CrossRef] [PubMed] [Google Scholar]
- A novel feedback regulated loop of circRRM2-IGF2BP1-MYC promotes breast cancer metastasis. Cancer Cell Int. 2023;23:54.
- [CrossRef] [PubMed] [Google Scholar]
- Immunohistochemistry in surgical pathology: Principles and practice. Methods Mol Biol. 2014;1180:81-109.
- [CrossRef] [PubMed] [Google Scholar]
- A risk prediction model of DNA methylation improves prognosis evaluation and indicates gene targets in prostate cancer. Epigenomics. 2020;12:333-52.
- [CrossRef] [PubMed] [Google Scholar]
- miR-30a inhibits androgen-independent growth of prostate cancer via targeting MYBL2, FOXD1, and SOX4. Prostate. 2020;80:674-86.
- [CrossRef] [PubMed] [Google Scholar]
- A comprehensive analysis of the FOX family for predicting kidney renal clear cell carcinoma prognosis and the oncogenic role of FOXG1. Aging (Albany NY). 2022;14:10107-24.
- [CrossRef] [PubMed] [Google Scholar]
- FOXD1-AS1 regulates FOXD1 translation and promotes gastric cancer progression and chemoresistance by activating the PI3K/AKT/mTOR pathway. Mol Oncol. 2021;15:299-316.
- [CrossRef] [PubMed] [Google Scholar]
- LncRNA OIP5-AS1 promotes the malignancy of pancreatic ductal adenocarcinoma via regulating miR-429/FOXD1/ERK pathway. Cancer Cell Int. 2020;20:296.
- [CrossRef] [PubMed] [Google Scholar]
- The multisystemic functions of FOXD1 in development and disease. J Mol Med (Berl). 2018;96:725-39.
- [CrossRef] [PubMed] [Google Scholar]
- Dissecting multifunctional roles of forkhead box transcription factor D1 in cancers. Biochim Biophys Acta Rev Cancer. 2023;1878:188986.
- [CrossRef] [PubMed] [Google Scholar]
- miR-30e-5p-mediated FOXD1 promotes cell proliferation by blocking cellular senescence and apoptosis through p21/CDK2/Rb signaling in head and neck carcinoma. Cell Death Discov. 2023;9:295.
- [CrossRef] [PubMed] [Google Scholar]
- FOXD1 regulates cell division in clear cell renal cell carcinoma. BMC Cancer. 2021;21:312.
- [CrossRef] [PubMed] [Google Scholar]
- FOXD1 is associated with poor outcome and maintains tumor-promoting enhancer-gene programs in basal-like breast cancer. Front Oncol. 2023;13:1156111.
- [CrossRef] [PubMed] [Google Scholar]
- Rare variants in known susceptibility loci and their contribution to risk of lung cancer. J Thorac Oncol. 2018;13:1483-95.
- [CrossRef] [PubMed] [Google Scholar]
- The prognostic value of DAAM2 in lower grade glioma, liver cancer, and breast cancer. Clin Transl Oncol. 2023;25:2224-38.
- [CrossRef] [PubMed] [Google Scholar]
- cDNA cloning and tissue-specific expression of a novel basic helix-loop-helix/PAS factor (Arnt2) with close sequence similarity to the aryl hydrocarbon receptor nuclear translocator (Arnt) Mol Cell Biol. 1996;16:1706-13.
- [CrossRef] [PubMed] [Google Scholar]
- Overexpression of ARNT2 is associated with decreased cell proliferation and better prognosis in gastric cancer. Mol Cell Biochem. 2019;450:97-103.
- [CrossRef] [PubMed] [Google Scholar]
- Effects of ARNT2 gene on invasion and migration of human hepatocellular carcinoma HCCLM6 cell line. Zhonghua Gan Zang Bing Za Zhi. 2010;18:27-31.
- [Google Scholar]
- Distinct prognostic value of dynactin subunit 4 (DCTN4) and diagnostic value of DCTN1, DCTN2, and DCTN4 in colon adenocarcinoma. Cancer Manag Res. 2018;10:5807-24.
- [CrossRef] [PubMed] [Google Scholar]
- C2H2 zinc finger proteins: The largest but poorly explored family of higher eukaryotic transcription factors. Acta Naturae. 2017;9:47-58.
- [CrossRef] [PubMed] [Google Scholar]
- Epigenetic silencing of ZNF132 mediated by methylation-sensitive Sp1 binding promotes cancer progression in esophageal squamous cell carcinoma. Cell Death Dis. 2018;10:1.
- [CrossRef] [PubMed] [Google Scholar]
- Kruppel-family zinc finger proteins as emerging epigenetic biomarkers in head and neck squamous cell carcinoma. J Otolaryngol Head Neck Surg. 2023;52:41.
- [CrossRef] [PubMed] [Google Scholar]
- Downregulated ZNF132 predicts unfavorable outcomes in breast cancer via hypermethylation modification. BMC Cancer. 2021;21:367.
- [CrossRef] [PubMed] [Google Scholar]
- The potential therapeutic effects of Galbanic acid on cancer. Pathol Res Pract. 2023;248:154686.
- [CrossRef] [PubMed] [Google Scholar]
- Galbanic acid decreases androgen receptor abundance and signaling and induces G1 arrest in prostate cancer cells. Int J Cancer. 2012;130:200-12.
- [CrossRef] [PubMed] [Google Scholar]
- Galbanic acid: Induced antiproliferation in estrogen receptor-negative breast cancer cells and enhanced cellular redox state in the human dermal fibroblasts. J Biochem Mol Toxicol. 2019;33:e22402.
- [CrossRef] [PubMed] [Google Scholar]


