


Translate this page into:
Matrix gla protein mediates CD8+ T-cell exhaustion to facilitate immune evasion in intrahepatic cholangiocarcinoma

*Corresponding author: Jun Liu, Department of Liver Transplantation and Hepatobiliary Surgery, Shandong Provincial Hospital Affiliated to Shandong First Medical University, Jinan, China. dr_liujun1967@126.com
-
Received: ,
Accepted: ,
How to cite this article: Cao X, Lang S, Xie Y, Zheng K, Liu J. Matrix gla protein mediates CD8+ T-cell exhaustion to facilitate immune evasion in intrahepatic cholangiocarcinoma. CytoJournal. 2025;22:41. doi: 10.25259/Cytojournal_232_2024
Abstract
Objective
Matrix Gla protein (MGP) has been found to be strongly associated with cancer progression. However, its role in intrahepatic cholangiocarcinoma (ICC) remains unclear, particularly within the tumor immune microenvironment. MGP may promote immune evasion by activating the nuclear factor-kappa-light-chain-enha ncer of activated B-cells (NF-κB) signaling pathway, which increases the expression of programmed death-ligand 1 (PD-L1) and contributes to CD8+ T-cell exhaustion. This research mainly aims to examine the regulatory role of MGP in immune evasion in ICC.
Material and Methods
ICC xenograft mouse models and human ICC cell line (HuCCT1) cell models were established to evaluate MGP expression patterns. MGP knockdown or overexpression in HuCCT1 cells was co-incubated with antigen-specific CD8+ T cells, and flow cytometry was used to detect markers of CD8+ T-cell exhaustion. The effects of MGP modulation on PD-L1 expression were assessed by immunohistochemistry and immunofluorescence. Western blotting was employed to analyze the impact on NF-κB signaling. In addition, MGP overexpression and p65 knockdown in HuCCT1 cells were co-transfected to study their combined effects on PD-L1 expression and CD8+ T-cell exhaustion markers. Cell proliferation and apoptosis were evaluated through colony formation assays and flow cytometry.
Results
Compared to adjacent tissues and human intrahepatic cholangiocellular epithelial cells, MGP was significantly overexpressed in ICC tumor tissues and HuCCT1 cells (P < 0.001). MGP overexpression led to NF-κB signaling phosphorylation (P < 0.001), elevated PD-L1 expression (P < 0.001), and heightened levels of CD8+ T-cell exhaustion markers (P < 0.001). Conversely, p65 knockdown mitigated the effects of MGP overexpression on HuCCT1 cell proliferation (P < 0.01) and CD8+ T-cell exhaustion (P < 0.01 and P < 0.001), while also significantly reducing PD-L1 expression (P < 0.01).
Conclusions
MGP promotes CD8+ T-cell exhaustion and facilitates immune evasion in ICC through NF-κB pathway activation.
Keywords
CD8+ T cells
Immune escape
Intrahepatic cholangiocarcinoma
Matrix Gla protein
Programmed Death-Ligand 1

INTRODUCTION
Intrahepatic cholangiocarcinoma (ICC), known for its aggressive nature and poor prognosis, is an aggressive tumor that originates in the bile ducts within the liver.[1] Despite advancements in cancer treatment, ICC is still a crucial clinical obstacle due to its often late diagnosis and resistance to conventional therapies.[2] Recent publications have emphasized the implications of tumor microenvironmental factors in the development of ICC.[3,4]
Matrix Gla protein (MGP) is a small calcium-binding protein that is primarily involved in bone mineralization and the regulation of the extracellular matrix.[5] Recent investigations have also indicated a role for MGP in cancer progression. Increased levels of MGP have been observed in multiple cancers, including gastric and colorectal cancer, and this increase correlates with enhanced tumor invasiveness and poor prognosis.[6,7] While the role of MGP in several cancers has been well documented, its physiological function in ICC, particularly within the tumor immune microenvironment, has not been fully explored. Immune evasion is a critical mechanism by which tumors, including ICC, evade immune surveillance, facilitating continued tumor growth and metastasis.[8] Tumor cells often manipulate immune checkpoints, such as the expression of PD-L1, to suppress the activity of cytotoxic CD8+ T cells, leading to immune evasion.[9] The potential involvement of MGP in regulating immune responses, particularly in promoting CD8+ T-cell exhaustion, offers a novel perspective on how ICC tumors may evade immune detection. Therefore, understanding the mechanisms by which MGP facilitates immune evasion could introduce new therapeutic strategies aimed at boosting anti-tumor immunity in ICC.
Immune evasion is a key mechanism that enables tumors to escape immune surveillance, allowing for uncontrolled growth and metastasis.[10,11] A central feature of immune evasion is the exhaustion of CD8+ T cells. This exhaustion is characterized by the upregulation of several inhibitory receptors, which impair the function of CD8+ T cells and enhance the capability of tumors to evade immune detection.[12]
Programmed death-ligand 1 (PD-L1) is a key immune checkpoint protein that suppresses immune responses by binding to the PD-1 receptor on T cells, thereby promoting tumor cell survival.[13] In a range of cancers, such as non-small cell lung cancer, the nuclear factor-kappa B (NF-κB) signaling pathway has been demonstrated to promote PD-L1 expression, thereby aiding immune evasion.[14]
This research is designed to investigate the role of MGP in ICC, focusing specifically on its influence on the NF-κB signaling pathway and the subsequent effects on immune evasion. The study hypothesizes that MGP activates NF-κB, leading to increased PD-L1 expression and the depletion of CD8+ T cells. By elucidating these mechanisms, this study seeks to enhance the understanding of how MGP contributes to ICC progression and identify potential therapeutic targets to improve treatment strategies for ICC.
MATERIAL AND METHODS
Cell cultures
Human ICC cell line (HuCCT1) (iCell-h316) and human intrahepatic biliary epithelial cells (BECs) (HUM-iCell-d014) were obtained from Cellverse Co., Ltd. (Shanghai, China). HuCCT1 cells were cultured in a medium (iCell-h316-001b, Cellverse Co., Ltd., Shanghai, China) specifically designed for them, while BECs were cultured in their respective specialized medium (iCell-d014-002h, Cellverse Co., Ltd., Shanghai, China). All cells were maintained in a 5% CO2 incubator at 37°C. Short Tandem Repeat authentication and mycoplasma testing were performed on all cell lines used in this study, confirming the absence of mycoplasma contamination.
Animal experiments
A total of 30 male BALB/C mice (20 ± 2g, 6–8 weeks) were acquired from Shanghai Model Organisms Center, Inc. (Shanghai, China) and randomly divided into five groups: Control, ShRNA negative control (Sh-NC), ShRNA-Matrix Gla Protein (Sh-MGP), Overexpression-Negative control (Ov-NC), and Overexpression-Matrix Gla Protein (OvMGP) groups. HuCCT1 cells, treated with ShRNA (Sh-MGP) and MGP overexpression plasmid (1), were subcutaneously implanted into the right side of BALB/C mice to establish a subcutaneous tumor-bearing model. An identical volume of saline was administered to the control group, while negative control groups were injected with HuCCT1 cells treated with an equal volume of ShRNA (Sh-NC) or an empty plasmid. On day 24, the mice were euthanized through intraperitoneal injection of 3% sodium pentobarbital (100 mg/kg) (57-33-0, Sigma-Aldrich, St. Louis, Missouri, USA). Peripheral blood and tumor tissues were collected from the mice. The study adhered to the regulations outlined in the “Administration of Experimental Animals” guidelines and was approved by the Beijing Maide Kangna Laboratory Animal Welfare Ethics Committee (approval No. MDKN-2024-036) (date: January 03, 2024). The mice were kept in a regulated environment at a temperature of 22°C–24°C, with humidity levels between 40% and 60%, and subjected to a 12-h light/dark cycle.
Cell transfection
HuCCT1 cells were seeded into culture plates, ensuring that the confluency at the transfection time was between 60% and 80%. The transfection mixtures were prepared in accordance with the Lipofectamine 3000 reagent (L3000150, Invitrogen, Waltham, Massachusetts, USA) instructions, which include Sh-NC (sequence: TTCTCCGAACGTGTCACGT), ShRNA-MGP (Sh-MGP) (Sh-MGP-1 sequence: CGCCATGG TTTATGGATACAA; Sh-MGP-2 sequence: CCCTTCAT TAACAGGAGAAAT; Sh-MGP-3 sequence: AGCCTGTCC ACGAGCTCAATA), empty plasmid (Ov-NC), MGP overexpression plasmid (Ov-MGP) (sequence: ATGA AGAGCCTGATCCTTCTTGCCATCCTGGCCGCCT TAGCGGTAGTAACTTTGTGTTATGGAGAGTGGCA GAAAGAAGAAAACTTCGGCTTTGATATCGTTTCA GTTCTCTCTCTGAACTGGCATCGTGCCCAGGAAT CACATGAAAGCATGGAATCTTATGAACTTAATCCC TTCATTAACAGGAGAAATGCAAATACCTTCATATCC C CTCAGCAGAGATGGAGAGCTAAAGTCCAAGAGAGG ATCCGAGAACGCTCTAAGCCTGTCCACGAGCTCAA TAGGGAAGCCTGTGATGACTACAGACTTTGCG AACGCTACGCCATGGTTTATGGATACAATGC TGCCTATAATCGCTACTTCAGGAAGCGCCGAGGG ACCAAATGA), ShRNA-p65 (Sh-p65) (Sh-p65-1 sequence: CGGATTGAGGAGAAACGTAAA; Sh-p65-2 sequence: GCCTTAATAGTAGGGTAAGTT; Sh-p65-3 sequence: GCAGGCTATCAGTCAGCGCAT). ShRNA and overexpression plasmids were procured from Thermo Fisher Scientific (Waltham, Massachusetts, USA). Wash the HuCCT1 cells with sterile phosphate-buffered saline (PBS) and resuspend them in an appropriate amount of culture medium. Following the reagent instructions, the transfection mixture was transferred to the HuCCT1 cell suspension. The transfected cells were returned to a 37°C, 5% CO2 incubator for continued cultivation. The samples were collected after 24 h of transfection, verifying transfection efficiency using quantitative real-time polymerase chain reaction (qRT-PCR) or Western blot.
qRT-PCR
Total RNA is obtained from cells and tissues with an RNA extraction kit (DP419, TIANGEN, Beijing, China). The RNA is then converted to complementary DNA (cDNA) using a cDNA reverse transcription kit (NG3-8, TIANGEN, Beijing, China). An RT-PCR kit (KR123, TIANGEN, Beijing, China) is purchased, and the cDNA is mixed with the reagents from the qPCR kit and gene-specific primers. Amplification is performed in a qRT-PCR instrument (LightCycler 480, Roche, Basel, Switzerland). To assess the relative expression levels of the target genes, the 2−ΔΔCt method was applied, using glyceraldehyde-3-phosphate dehydrogenase (GAPDH) as the internal control gene. The primer sequences are shown in Table 1.
| Prime Name | Prime sequences (5’-3’) |
|---|---|
| MGP-F | AGAGAGGCCTGCGATGACTA |
| MGP-R | CTGCCTGAAGTAGCGGTTGT |
| GAPDH-F | TGTCTCCTGCGACTTCAACA |
| GAPDH-R | GGTGGTCCAGGGTTTCTTACT |
MGP: Matrix Gla protein, GAPDH: Glyceraldehyde-3-phosphate dehydrogenase, F: Forward, R: Reverse, A: Adenine, C: Cytosine, G: Guanine, T: Thymine
Western blot
Cells and tissues were treated with lysis buffer (R0010, Solarbio, Beijing, China) to extract total protein. After lysis, samples underwent centrifugation to clear cell debris, and the supernatant was retrieved. Protein concentration was determined through the bicinchoninic acid assay (PC0020, Solarbio, Beijing, China). Equal amounts of protein samples and molecular weight markers were loaded into the wells of a polyacrylamide gel (D1260, Solarbio, Beijing, China), and the appropriate voltage was applied for protein separation. The separated proteins were transferred onto a polyvinylidene fluoride membrane (YA1701, Solarbio, Beijing, China). To prevent non-specific binding, the membrane was blocked with 5% bovine serum albumin (BSA) (SW3015, Solarbio, Beijing, China) and incubated overnight at 4°C with primary antibodies against MGP (ab224367), p-p65 (ab86299), p65 (ab207297), phosphorylated cAMP response element-binding protein (CREB) (ab32096), CREB (ab32515), phosphorylated nuclear factor of activated T-cells 1 (NFATC1) (ab183023), NFATC1 (ab253477), cellular Myc (c-MYC) (ab32072), Cyclooxygenase-2 (COX-2) (ab179800), PD-L1 (ab228415), and GAPDH (ab9485). Conduct a tris-buffered saline with tween 20 (TBST) wash on the membrane to eliminate unbound primary antibody, followed by incubation with horseradish peroxidase (HRP)-conjugated secondary antibody (ab6721, 1:500) at room temperature for 1 h. The membrane was washed again with TBST, removing the unbound secondary antibody. Afterward, the signal was detected using an enhanced chemiluminescence reagent (PE0010, Solarbio, Beijing, China) and then visualized with a ChemiDoc MP Imaging System (Bio-Rad Laboratories, Hercules, CA, USA). Finally, the expression levels of the target protein were quantified using ImageJ software (version 1.x, National Institutes of Health, Bethesda, Maryland, USA). The primary antibodies in this study were obtained from Abcam (Cambridge, UK) and diluted to a concentration of 1:1000. The secondary antibody was also from Abcam.
Immunohistochemistry
First, tumor tissue samples are fixed using tissue fixative (G2161, Solarbio, Beijing, China), then dehydrated and embedded. The samples are sectioned into 4–6 μm thick slices and placed on glass slides. Next, xylene is used to remove paraffin, followed by rehydration of the slices using a series of ethanol solutions and distilled water. Antigen retrieval is then performed to expose antigen sites. To block non-specific binding, non-immune serum is used, followed by incubation with the primary antibody against MGP (ab224367), PD-L1 (ab205921) (overnight at 4°C). The slides are incubated with a secondary antibody (ab6721, 1:200) that is conjugated to HRP, followed by additional washing to remove the unbound secondary antibody. 3,3’-diaminobenzidine (DAB) substrate (P0202, Beyotime, Shanghai, China) is used for color development, forming a visible precipitate, followed by counterstaining with hematoxylin. Finally, the slides are covered with a mounting medium and then recorded under a microscope (BX53, Olympus, Tokyo, Japan) to assess the expression of the target protein. Finally, the expression levels of the target protein are quantified using ImageJ software (version 1.x, NIH, Bethesda, Maryland, USA). The primary antibodies in this study, obtained from Abcam (Cambridge, UK), were diluted to a concentration of 1:500. The secondary antibody was also from Abcam.
Immunofluorescence staining
Begin by plating the target cells onto a culture plate and allow them to grow until they reach approximately 70% confluence. Next, fix the cells with 4% paraformaldehyde and incubate at room temperature for 10 min, followed by washing using PBS. After preparation, the cells are permeabilized using 0.1% Triton X-100, incubated for 5 min, and then rinsed with PBS. The cells are blocked with 5% normal serum or BSA and incubated for 30 min to 1 h, preventing non-specific binding. The appropriately diluted primary antibodies MGP (ab224367) and PD-L1 (ab205921) are introduced and then incubated at room temperature for 1 h or overnight at 4°C, followed by two washes with PBS. Next, the fluorescently conjugated secondary antibody is added, and the cells are incubated for 1 h, followed by washing to eliminate any unbound Alexa Fluor® 594 secondary antibody (ab150080). Nuclear staining is applied using 4’,6-Diamidino-2-Phenylindole (DAPI) (28718-90-3, Sigma-Aldrich, St. Louis, Missouri, USA), and the cells are incubated for 5 min and then washed again. Finally, an anti-fluorescence quenching agent is applied, covering the slide with a coverslip to examine the cells under a fluorescence microscope (IX83, Olympus, Tokyo, Japan) and capture images. The antibodies in this study were from Abcam (Cambridge, UK) and were diluted to a concentration of 1:1000. Quantitative analysis of the images was performed using ImageJ software (version 1.x, National Institutes of Health, Bethesda, Maryland, USA).
Isolation of dendritic cells and CD8+ T cells
First, blood is collected from the mouse and placed into a centrifuge tube containing an anticoagulant. Then, density gradient centrifugation is performed to separate PBMCs by mixing the blood with an equal volume of Ficoll–Paque solution (17144003, Cytiva, Marlborough, Massachusetts, USA), followed by centrifugation to collect the PBMC fraction. The cells are washed with PBS to eliminate Ficoll and plasma proteins. Next, CD8+ T cells are isolated from the PBMCs using magnetic bead-based cell sorting, where the beads are conjugated with an anti-CD8 antibody. If antigen-specific CD8+ T cells are needed, then activation can be performed by co-culturing them with a specific CD3+ antibody. Finally, flow cytometry (BD FACSCanto II, BD Biosciences, Franklin Lakes, New Jersey, USA) is used to verify the purity of the isolated CD8+ T cells, ensuring that the cells are highly purified. CD8+ T cells have been confirmed to be free of mycoplasma contamination.
Flow cytometry
The CD8+ T cells are collected and washed with PBS to eliminate the culture medium. These cells are re-suspended in PBS, adjusting the cell concentration to 1 million cells/mL. Afterward, the cells are exposed to 0.5% Triton X-100 (ST1723, Beyotime, Shanghai, China) at room temperature for 5 min for permeabilization. These cells are washed with PBS, removing the permeabilizing agent. The cells are also incubated in PBS containing 5% fetal bovine serum (C0226, Beyotime, Shanghai, China) at room temperature for 30 min to block non-specific binding. Fluorescently labeled antibodies against lymphocyte-activation gene 3 (LAG3) (ab209236, Abcam, Cambridge, UK), PD-1 (46-9969-42, Thermo Fisher Scientific, Waltham, Massachusetts, USA), T-cell immunoreceptor with Ig and ITIM domains (TIGIT) (ab321793, Abcam, Cambridge, UK), and T-cell immunoglobulin and mucin domain 3 (TIM3) (ab210543, Abcam, Cambridge, UK) are added to the cell suspension, which is then incubated at 4°C for 1 h. A PBS wash is performed to remove unbound antibodies from the cells, and the stained cells are re-suspended in an appropriate PBS volume. Data collection is performed using a flow cytometer (BD FACSCanto II, BD Biosciences, Franklin Lakes, New Jersey, USA), and the appropriate channels are set to detect the different fluorescent labels. The expression levels of LAG3, PD-1, TIGIT, and TIM3 on the cells are recorded and analyzed.
Colony formation assay
First, the logarithmic-phase HuCCT1 cells that have been transfected are collected. A cell suspension is then prepared, and 1000 cells are seeded into culture dishes containing medium. The dishes are gently shaken to evenly distribute the cells, which are then placed in a 37°C, 5% CO2 incubator for 10 days until colonies are visible to the naked eye. During the culture period, the medium is replaced with fresh medium every 2 to 3 days. The medium is removed after colony formation, and the cells are washed twice with PBS. The cells are fixed with 4% paraformaldehyde for 10 min. After fixation, the paraformaldehyde is removed, and the cells are washed twice with PBS and then stained with 0.1% crystal violet (C0121, Beyotime, Shanghai, China) solution for 10 min until the colonies are visible. After staining, the stain is removed, and the cells are gently rinsed with water until the background is clear. Finally, the culture dishes are air-dried, the number of colonies under a microscope is counted (BX53, Olympus, Tokyo, Japan), and the data are analyzed to assess cell proliferation and survival rates.
5-ethynyl-2’-deoxyuridine (EdU) staining
First, HuCCT1 cells (1 × 10⁶ cells/well) are seeded into a 6-well plate. Then, EdU is added to the culture medium according to the kit (C0071S, Beyotime, Shanghai, China) instructions and incubated with the cells for 1 h. The cells are fixed with 4% paraformaldehyde for 15 min and then incubated with 0.1% Triton X-100 for 10 min to permeabilize. Next, the Click-iT reaction mixture is prepared in accordance with the instructions and added to the cells, which are then incubated in the dark for 30 min. The cell nuclei are stained with Hoechst 33342, incubated for 5 min, and washed with PBS. Finally, images are observed and captured under a fluorescence microscope (IX83, Olympus, Tokyo, Japan), and Image J software (version 1.x, National Institutes of Health, Bethesda, Maryland, USA) is used to count EdU-positive cells and analyze the data to evaluate DNA synthesis and cell proliferation.
Terminal deoxynucleotidyl transferase dUTP nick-end labeling (TUNEL) staining
HuCCT1 cells (1 × 10⁶ cells/well) were seeded into a 6-well plate, and the cells with 4% paraformaldehyde were stored at room temperature for 15 min. The TUNEL reaction mixture was prepared in accordance with the kit (C1086, Beyotime, Shanghai, China) instructions and then applied uniformly to the cells. The mixture was incubated in a humidified chamber at 37°C for 1 h in the dark, preventing light interference with fluorescence. After incubation, the samples were washed with PBS to remove the unbound TUNEL reagent. Optionally, the nuclei were counterstained with DAPI for 5 min and then washed with PBS. An anti-fade mounting medium was used to mount the samples, thereby preserving fluorescence. Finally, images were observed and captured using a fluorescence microscope (IX83, Olympus, Tokyo, Japan), and TUNEL-positive cells were counted using ImageJ software (version 1.x, NIH, Bethesda, Maryland, USA).
Statistical analysis
Data were analyzed using GraphPad Prism software (version 9.0, GraphPad Software, Inc., San Diego, California, USA), with statistical significance defined as P < 0.05. Differences between the two groups were assessed using t-tests, while a one-way analysis of variance followed by Tukey’s post hoc test was applied for comparisons across multiple groups.
RESULTS
Upregulation of MGP in ICC
The expression pattern of MGP in ICC cells (HuCCT1) and BEC was examined. The results in Figures 1a-c indicate that MGP mRNA and protein levels were significantly higher in HuCCT1 cells than in BEC (P < 0.001).
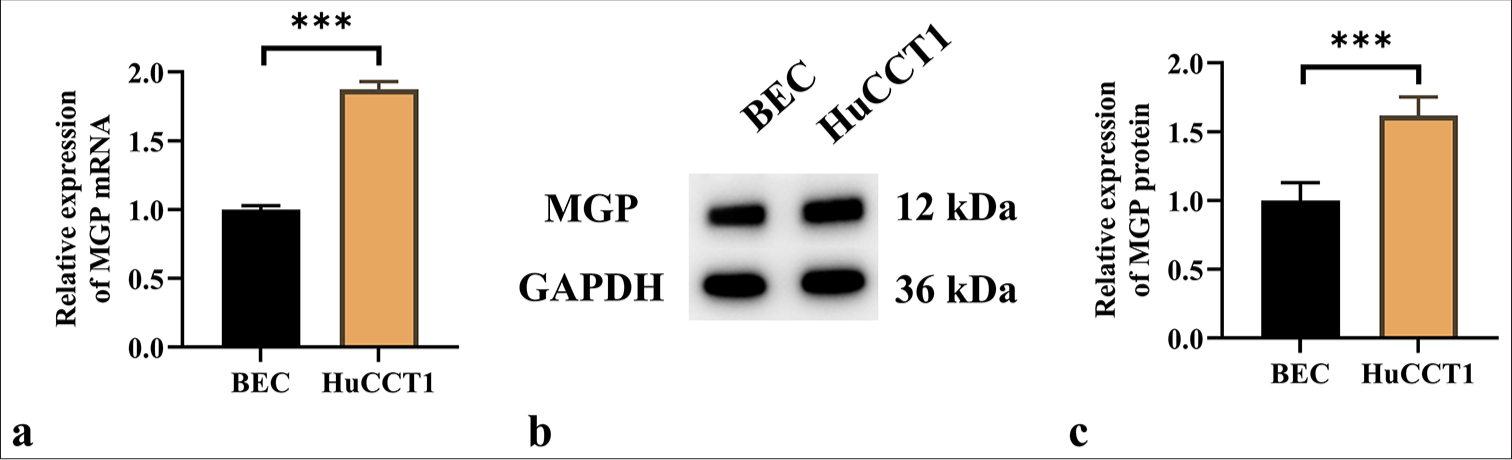
- MGP Expression is overexpressed in ICC. (a) qRT-PCR analysis of MGP mRNA expression in ICC cells (HuCCT1) and biliary epithelial cells (BEC). (b and c) Western blot detection of MGP protein expression in HuCCT1 and BEC; (b) MGP protein bands; (c) Quantitative analysis of MGP protein gray values. n = 6. ✶✶✶P < 0.001. MGP: Matrix gla protein, GAPDH: Glyceraldehyde-3-phosphate dehydrogenase, ICC: Intrahepatic cholangiocarcinoma, HuCCT1: ICC cells line, BEC: Biliary epithelial cells.
MGP induces antigen-specific CD8+ T-cell exhaustion
The results demonstrated that ShRNA-MGP and MGP overexpression plasmids were successfully transfected into HuCCT1 cells (P < 0.001) [Figure 2a-c]. Subsequently, HuCCT1 cells with either MGP gene knockout or overexpression were co-cultured with antigen-specific CD8+ T cells isolated from PBMCs. The expression of immune markers was assessed using flow cytometry. The results demonstrated that reduced MGP expression in HuCCT1 cells, when co-cultured with antigen-specific CD8+ T cells, induced a notable decrease in the levels of CD8+ T-cell exhaustion markers (LAG3, PD1, TIGIT, and TIM3) [Figure 2d-k]. In contrast, when HuCCT1 cells with high MGP expression were co-cultured with antigen-specific CD8+ T cells, a marked increase in the expression of LAG3, PD1, TIGIT, and TIM3 was observed (P < 0.01 and P < 0.001) [Figure 2d-k]. Overall, the results indicate that high MGP expression can induce antigen-specific CD8+ T-cell exhaustion.
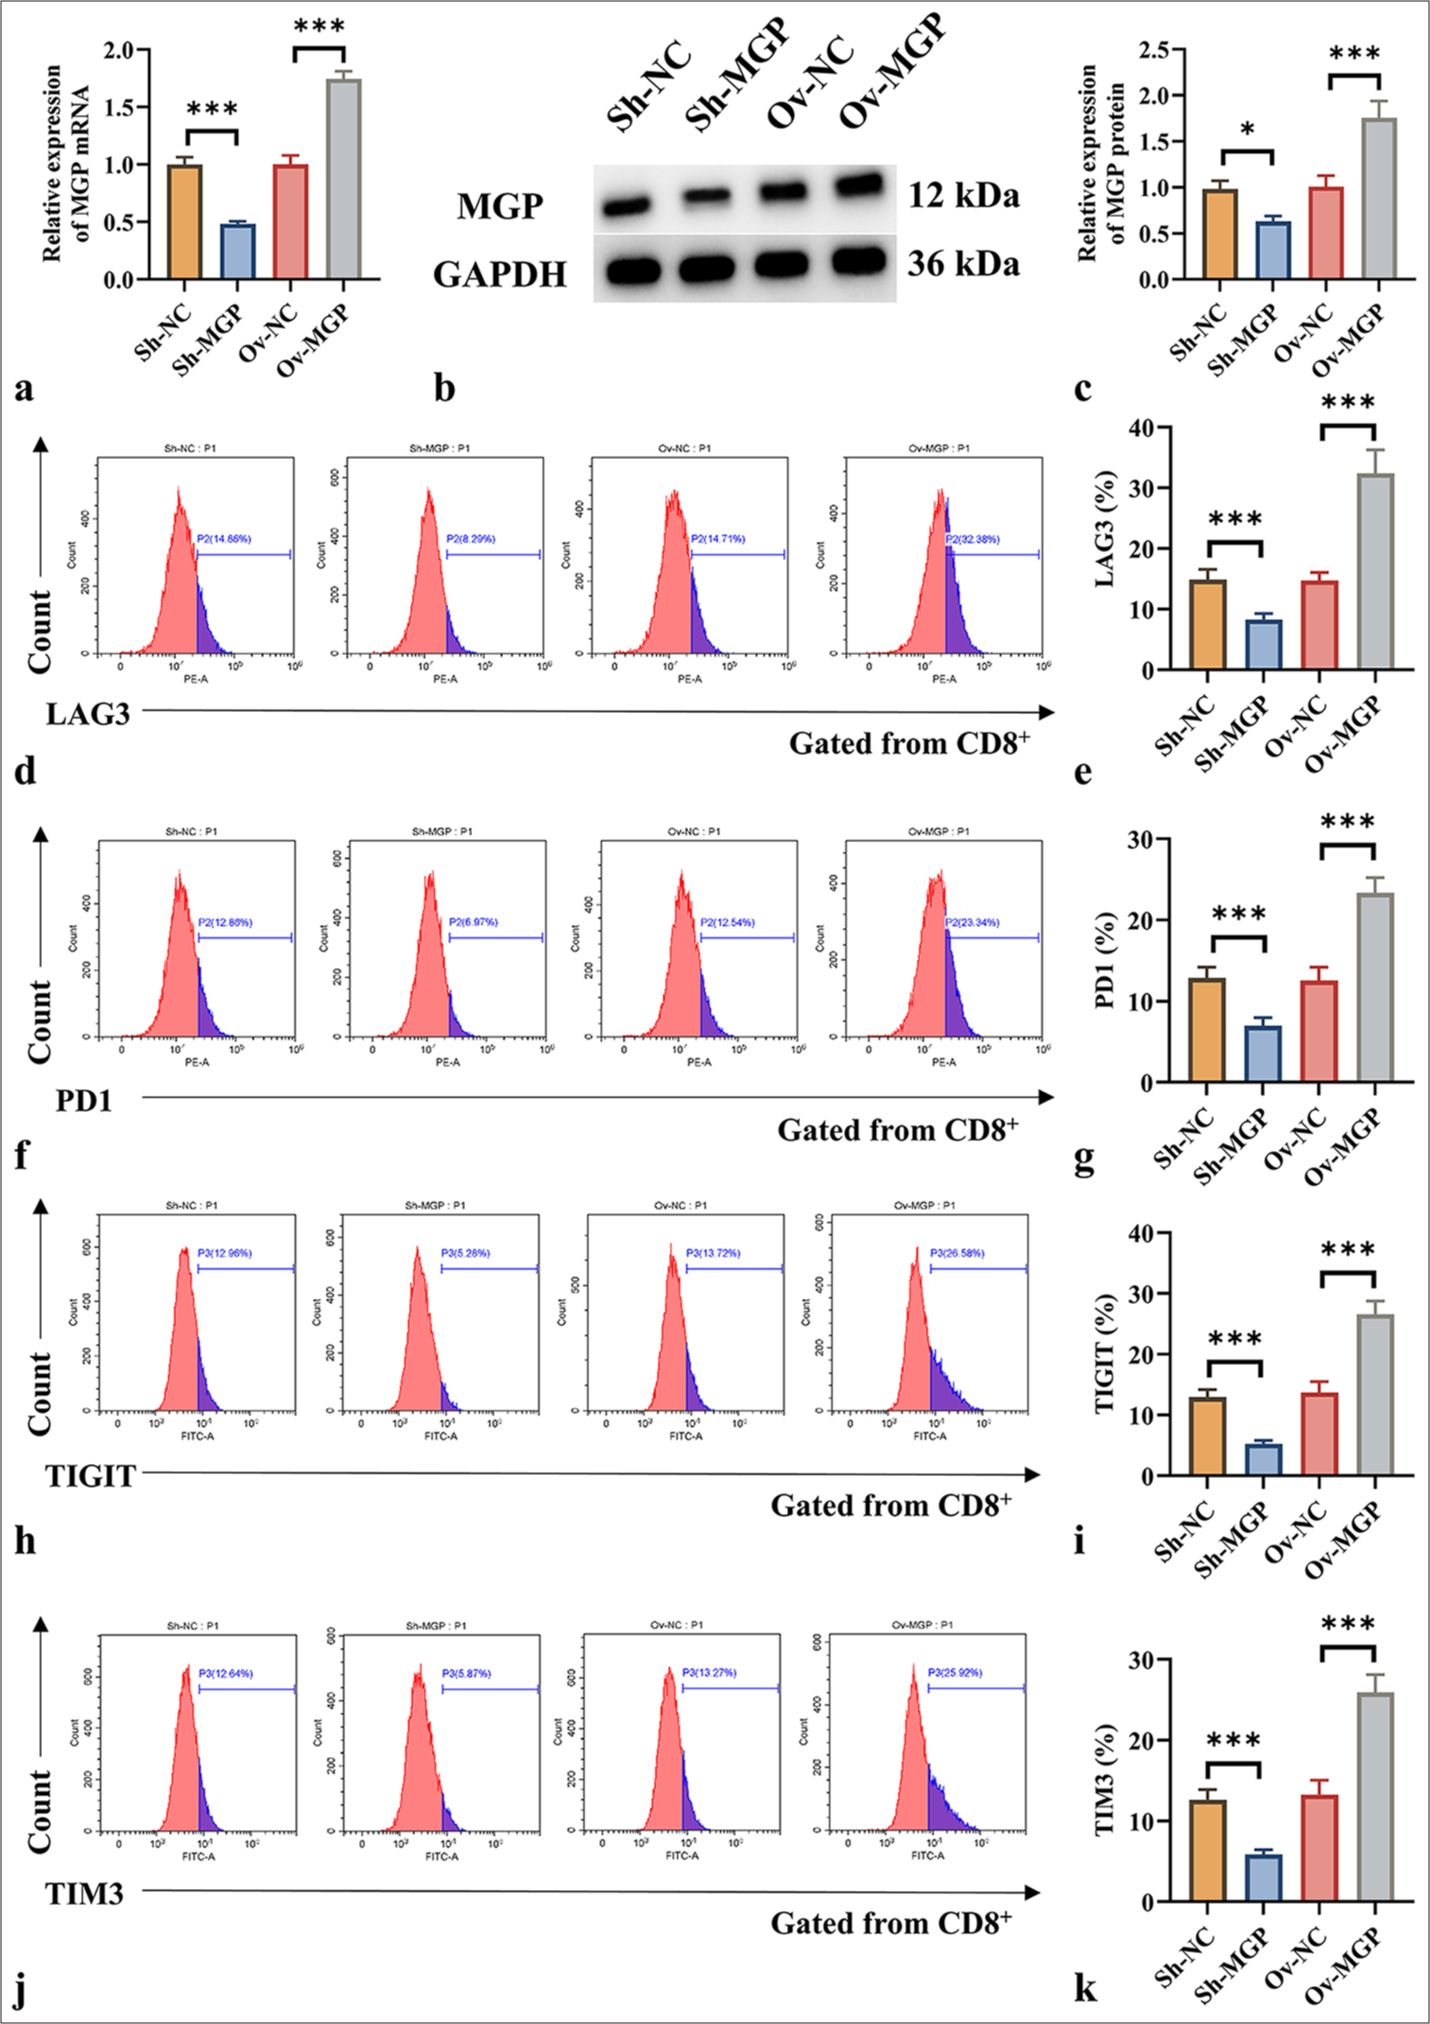
- MGP triggers CD8+ T-cell impairment in co-culture using antigen-specific CD8+ T cells extracted from PBMC samples. (a) qRT–PCR validation of MGP mRNA expression efficiency in HuCCT1 cells transfected with ShRNA-MGP and MGP overexpression plasmids. (b and c) Western blot validation of MGP protein expression efficiency in HuCCT1 cells transfected with ShRNA-MGP and MGP overexpression plasmids; (b) MGP protein bands; (c) Quantitative analysis of MGP protein gray values. (d-k) Cells transfected with ShRNA-MGP and MGP overexpression plasmids in HuCCT1, co-cultured with antigen-specific CD8+ T cells, as well as the expressions of LAG3, PD1, TIGIT, and TIM3, were analyzed by flow cytometry. n = 6. ✶P < 0.05, ✶✶✶P < 0.001. MGP: Matrix Gla Protein, GAPDH: Glyceraldehyde-3-phosphate dehydrogenase, Sh-NC: ShRNA-Negative control, Sh-MGP: ShRNA-Matrix Gla Protein, Ov-NC: Overexpression-Negative control, Ov-MGP: Overexpression-Matrix Gla Protein, LAG3: Lymphocyte-activation gene 3, PD1: Programmed cell death protein 1, TIGIT: T-cell immunoreceptor with Ig and ITIM domains, TIM3: T-cell immunoglobulin and mucin domain 3.
MGP upregulates PD-L1 level in ICC
The results in Figures 3a-d show that after MGP knockdown, the PD-L1 level in ICC tumor tissues also decreased (P < 0.001). Conversely, MGP overexpression led to a marked increase in PD-L1 expression in ICC tumor tissues (P < 0.001). Immunocytochemistry experiments produced consistent results, showing that MGP knockdown decreased the PD-L1 level in HuCCT1 cells, while MGP overexpression elevated the PD-L1 level in HuCCT1 cells (P < 0.001) [Figure 3e-h].
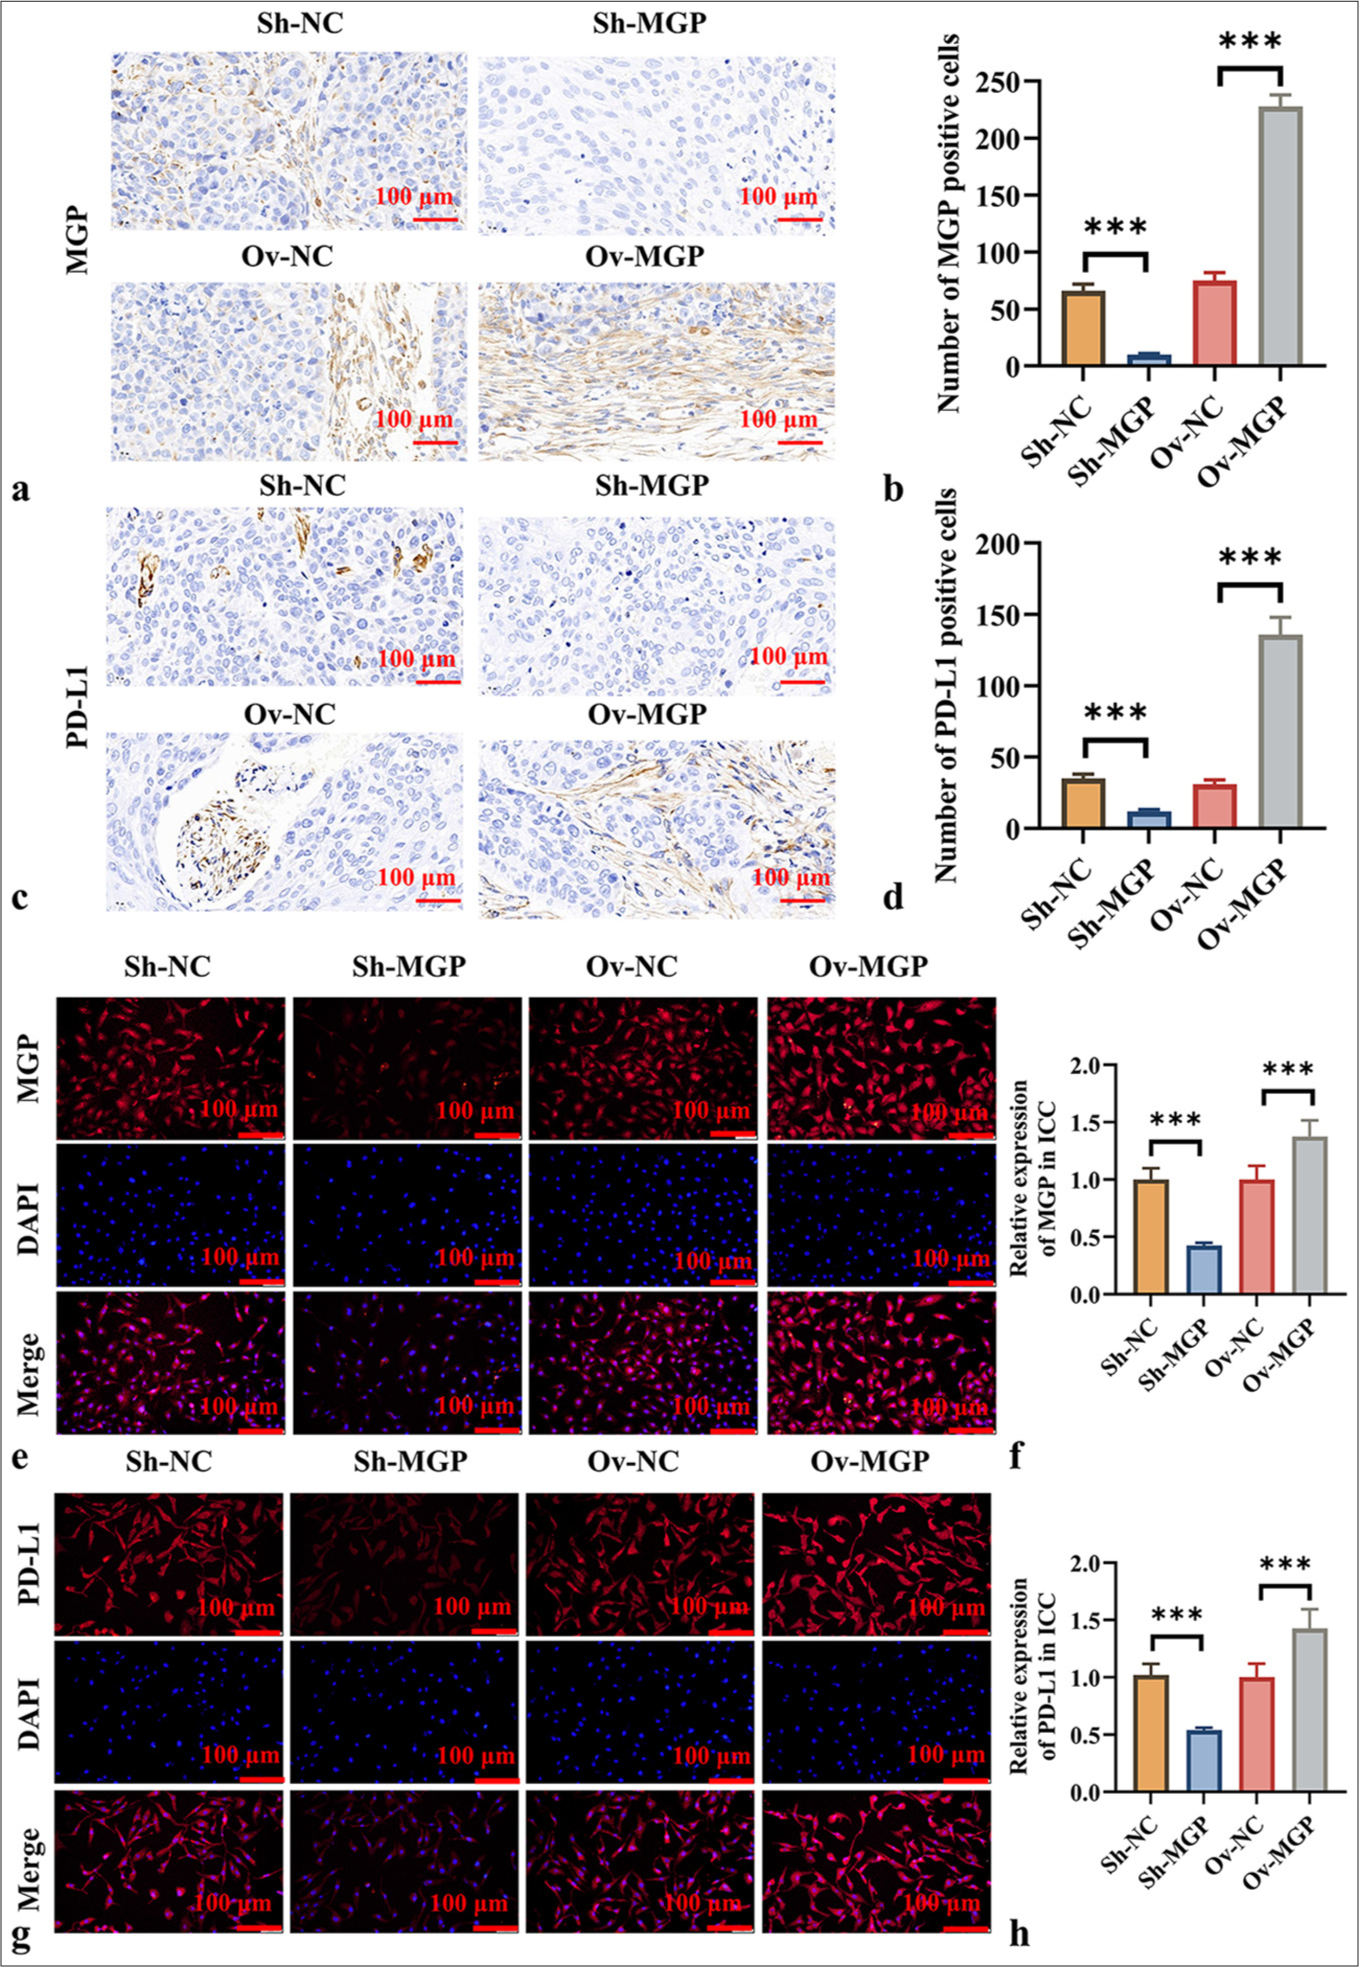
- MGP Upregulates PD-L1 Expression in ICC. (a and b) IHC detection of MGP protein expression in ICC tumor tissues after MGP knockdown or overexpression. (a) IHC images, scale bar:100 μm, 200× of MGP; (b) Quantitative analysis of MGP expression levels; (c and d) Immunohistochemical detection of PD-L1 protein expression in ICC tumor tissues after MGP knockdown or overexpression; (c) IHC images, scale bar:100 μm, 200× of PD-L1; (d) Quantitative analysis of PD-L1 expression levels; (e and f) Immunocytochemical detection of MGP protein expression in HuCCT1 cells after MGP knockdown or overexpression; (e) Immunocytochemical images, scale bar:100 μm, 200× of MGP; (f) Quantitative analysis of MGP expression levels; (g and h) Immunocytochemical detection of PD-L1 protein expression in HuCCT1 cells after MGP knockdown or overexpression; (g) Immunocytochemical images of PD-L1; , scale bar:100 μm, 200× (h) Quantitative analysis of PD-L1 expression levels. n = 6. ✶✶✶P < 0.001. MGP: Matrix Gla Protein, PDL1: Programmed cell death ligand 1, Sh-NC: ShRNA-Negative control, Sh-MGP: ShRNA-Matrix Gla Protein, Ov-NC: Overexpression-negative control, Ov-MGP: Overexpression-Matrix Gla Protein, DAPI: 4’,6-diamidino-2-phenylindole.
MGP activates the NF-κB signaling pathway in ICC, upregulating PD-L1 expression
Further investigation was conducted to assess whether MGP could activate the NF-κB signaling pathway in HuCCT1 cells, thereby influencing PD-L1 expression. The results revealed that MGP inhibition led to a substantial reduction in the phosphorylation of key proteins involved in signaling, including p65, CREB, and NFATC1 (P < 0.001). When MGP levels were reduced, a substantial decrease in the expression of the c-MYC protein was also observed (P < 0.001) [Figure 4a-e].
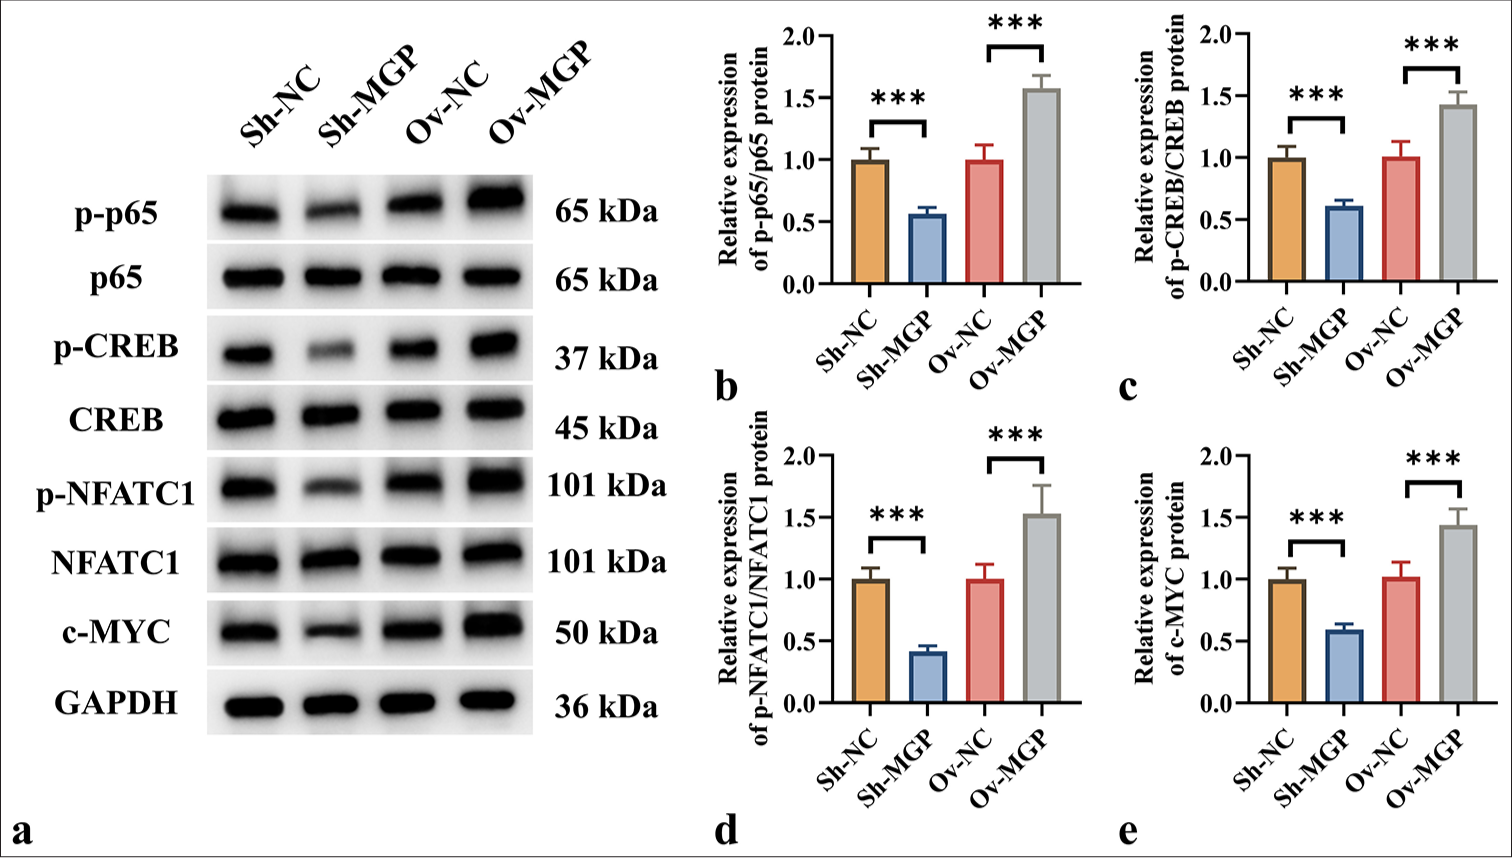
- MGP triggered the NF-κB Pathway in ICC Cells. (a-e) Western blot analysis of protein levels of p-p65, p65, p-CREB, CREB, p-NFATC1, NFATC1, and c-MYC in HuCCT1 cells after MGP knockdown or overexpression. n = 6, ✶✶✶P < 0.001. MGP: Matrix Gla Protein, PD-L1: Programmed cell death ligand 1, Sh-NC: ShRNA-Negative control, Sh-MGP: ShRNA-Matrix Gla Protein, Ov-NC: Overexpression-Negative control, Ov-MGP: Overexpression-matrix gla protein, p65: RelA, p-p65: Phosphorylated p65, CREB: cAMP response element-binding protein, p-CREB: Phosphorylated CREB, NFATC1: Nuclear Factor of Activated T-cells 1, p-NFATC1: Phosphorylated NFATC1, c-MYC: Cellular Myc, GAPDH: Glyceraldehyde-3-phosphate dehydrogenase.
Previous studies have shown that activation of the NF-κB pathway leads to increased PD-L1 expression in colorectal cancer.[7] It is proposed that MGP could increase PD-L1 expression by triggering the NF-κB pathway, thereby aiding immune evasion in ICC. Western blot analysis demonstrated that MGP overexpression resulted in a substantial increase in p-p65 and PD-L1 levels (P < 0.001) [Figure 5a-e]. However, when HuCCT1 cells were co-transfected with p65 knockdown and MGP overexpression plasmids, a marked decrease in the protein level of p-p65 and PD-L1 was observed (P < 0.001) [Figure 5a-e].
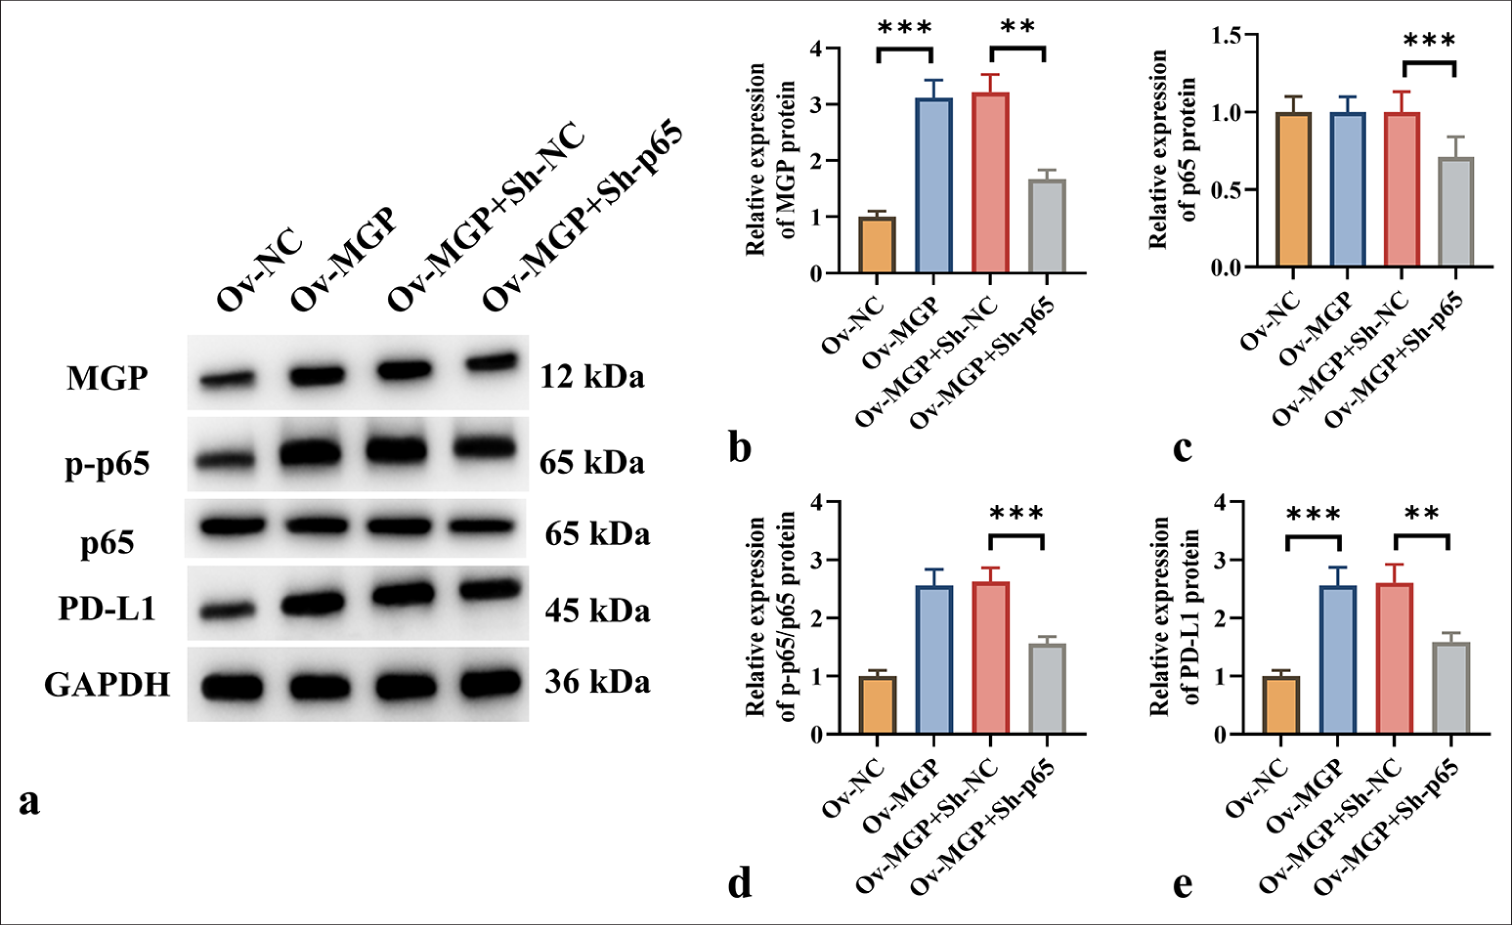
- NF-κB Transcription Induces PD-L1 Expression in ICC Cells. (a-e) Protein expression levels of MGP, p-p65, p65, and PD-L1 in HuCCT1 cells were assessed by Western blot following MGP overexpression or co-transfection with p65 knockdown. n = 6, ✶✶P < 0.01, ✶✶✶P < 0.001. MGP: Matrix gla protein, Ov-NC: Overexpression-negative control, Ov-MGP: Overexpression-matrix gla protein, p65: RelA, Sh-NC: ShRNA-Negative control, Sh-p65: ShRNA-p65, p-p65: Phosphorylated p65, PD-L1: Programmed cell death ligand 1, GAPDH: Glyceraldehyde-3-phosphate dehydrogenase.
p65 knockdown counteracts MGP overexpression-induced ICC cell proliferation
Colony formation assays and EdU fluorescence staining demonstrated that MGP overexpression significantly promoted ICC cell proliferation (P < 0.001) [Figure 6a-d]. However, co-transfection of MGP overexpression with p65 knockdown markedly inhibited ICC cell proliferation (P < 0.01) [Figure 6a-d]. TUNEL staining results revealed that MGP overexpression significantly reduced ICC cell apoptosis (P < 0.001) [Figure 6e and f]. In contrast, after co-transfection of MGP overexpression with p65 knockdown, ICC cell apoptosis levels were significantly increased (P < 0.01) [Figure 6e and f].
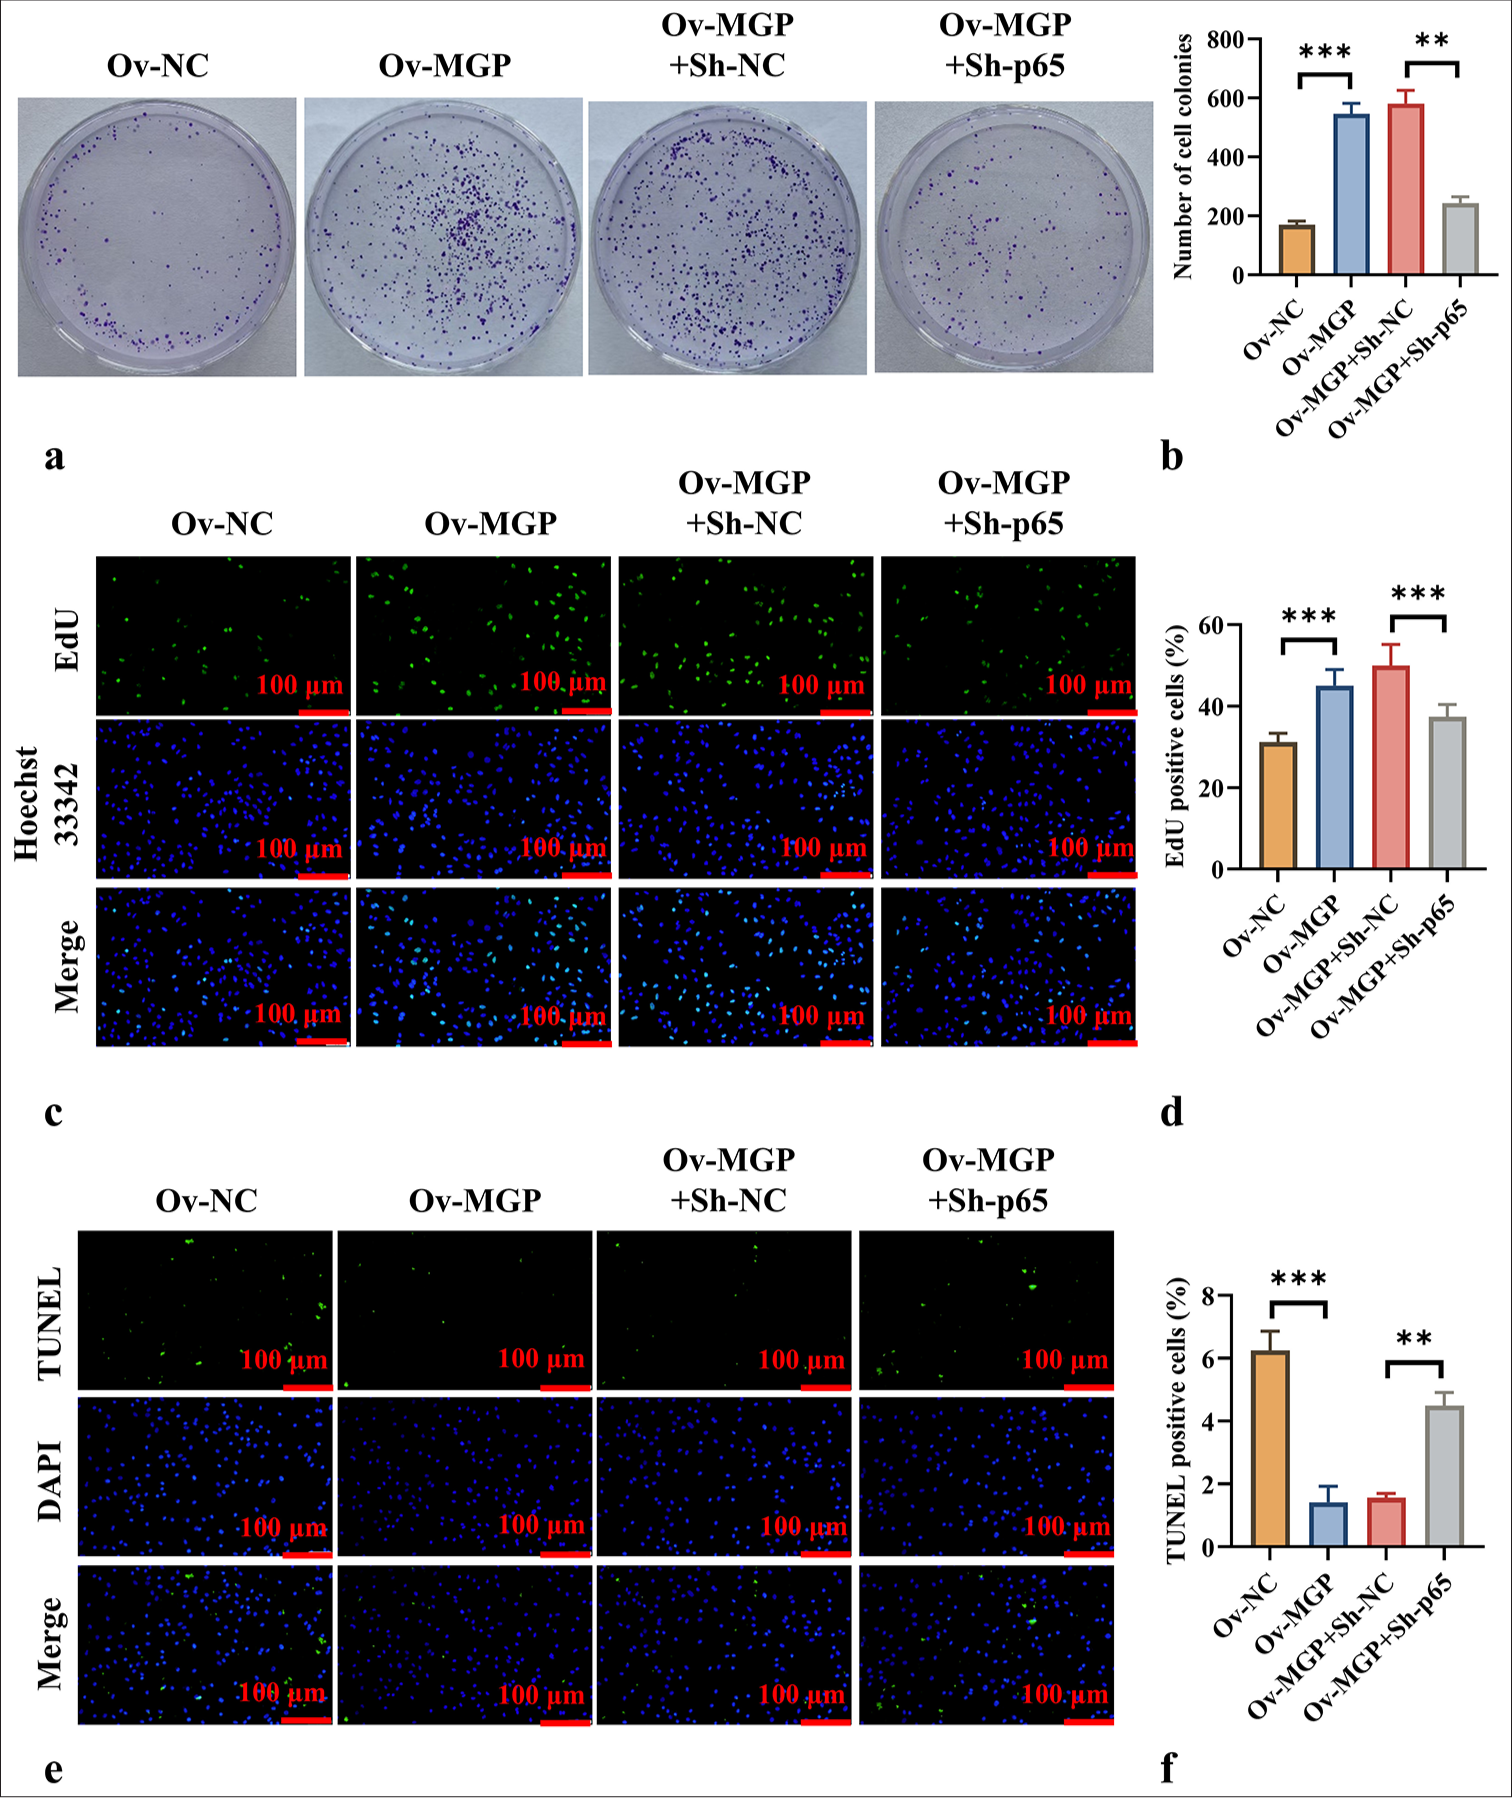
- p65 Knockdown Counteracts MGP Overexpression-Induced Cell Proliferation. (a and b) Colony formation assays evaluating cell proliferation across different groups. (c and d) EdU fluorescence staining, scale bar:100 μm, 200× assessing cell proliferation capability in each group. (e and f) TUNEL fluorescence staining, scale bar:100 μm, 200× evaluation of apoptosis levels in each group. n = 6, ✶✶P < 0.01, ✶✶✶P < 0.001. MGP: Matrix gla protein, Ov-NC: Overexpression-negative control, Ov-MGP: Overexpression-matrix gla protein, p65: RelA, Sh-NC: ShRNA-negative control, Sh-p65: ShRNA-p65, EdU: 5-Ethynyl-2’-deoxyuridine, DAPI: 4’,6-diamidino-2-phenylindole, TUNEL: Terminal deoxynucleotidyl transferase dUTP nick end labeling.
p65 silencing prevents MGP overexpression from inducing antigen-specific CD8+ T-cell exhaustion
HuCCT1 cells overexpressing MGP, when co-cultured with antigen-targeted CD8+ T cells, exhibited a substantial increase in the expression of LAG3, PD1, TIGIT, and TIM3 (P < 0.001) [Figure 7a-h]. However, when MGP overexpression was co-transfected with p65 knockdown in HuCCT1 cells, and these cells were co-cultured with antigen-specific CD8+ T cells, a marked decrease in the levels of LAG3, PD1, TIGIT, and TIM3 was observed (P < 0.01, and P < 0.001) [Figure 7a-h].
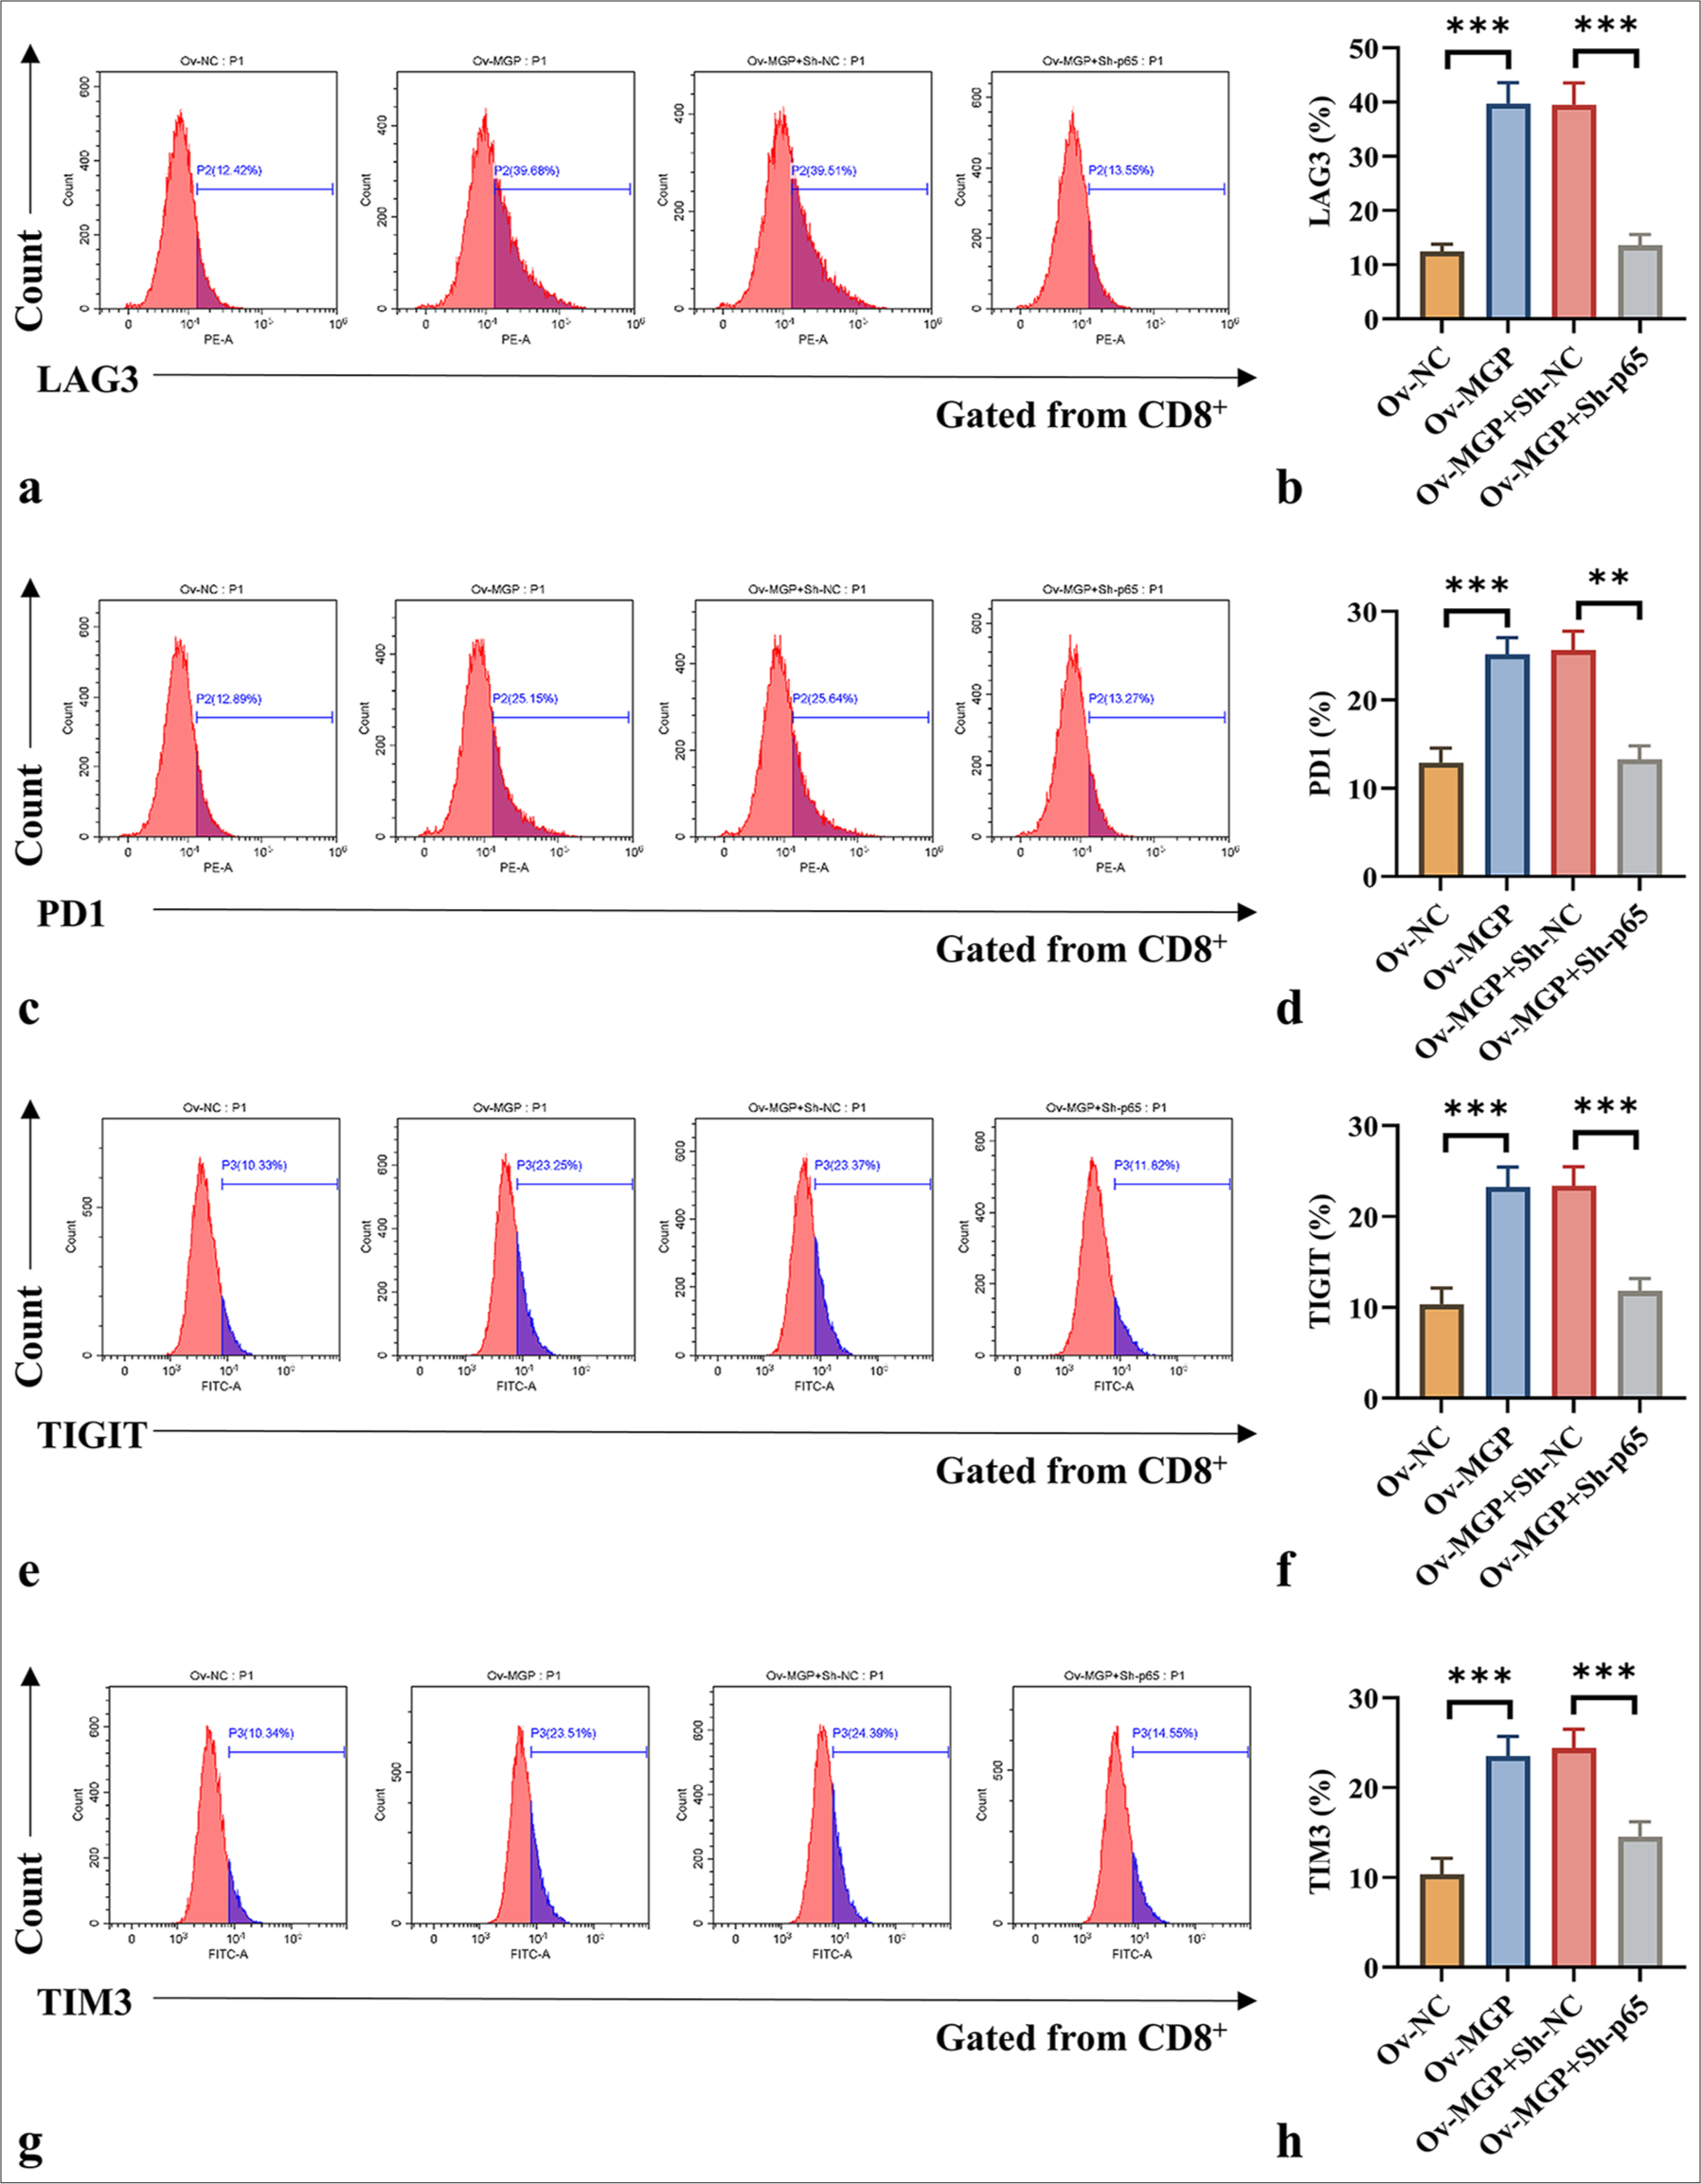
- p65 knockdown counteracts MGP overexpression-induced antigen-specific CD8+ T-cell exhaustion. (a-h) Co-culturing of HuCCT1 cells transfected with MGP overexpression plasmids or co-transfected with p65 knockdown and antigen-specific CD8+ T cells, followed by flow cytometry measurement of common CD8+ T-cell exhaustion markers (LAG3, PD1, TIGIT, and TIM3). n = 6. ✶✶P < 0.01, ✶✶✶P < 0.001. MGP: Matrix gla protein, Ov-NC: Overexpression-negative control, Ov-MGP: Overexpression-matrix gla protein, p65: RelA, Sh-NC: ShRNA-negative control, Sh-p65: ShRNA-p65, LAG3: Lymphocyte-activation gene 3, PD1: Programmed cell death protein 1, TIGIT: T-cell immunoreceptor with Ig and ITIM domains, TIM3: T-cell immunoglobulin and mucin domain 3.
DISCUSSION
This study provides a comprehensive analysis of the role of MGP in the progression of ICC, particularly its impact on immune evasion and cell proliferation. The findings indicate that MGP substantially contributes to ICC progression by upregulating PD-L1 and inducing CD8+ T-cell exhaustion.
Notably, MGP expression in ICC tissues was substantially higher than in adjacent healthy tissues. This result is consistent with findings from other cancers. For instance, in colorectal cancer, MGP upregulation has been associated with increased tumor invasiveness and poor prognosis.[15] As a small calcium-binding protein, MGP plays a crucial role in bone mineralization and extracellular matrix regulation.[16] In cancer, MGP may promote tumor progression by modulating cell proliferation and apoptosis.[17-19] This study further reinforces the oncogenic role of MGP in ICC and suggests its potential as a biomarker.
This study found that MGP overexpression markedly elevated the expression of exhaustion markers, such as LAG3, PD1, TIGIT, and TIM3, in CD8+ T cells. Immune exhaustion of CD8+ T cells is a key mechanism by which tumors evade immune surveillance.[20,21] Previous research has demonstrated that tumor cells inhibit CD8+ T-cell function through various mechanisms, including the expression of PD-L1.[22,23] The results contribute to this understanding by revealing how MGP promotes CD8+ T-cell exhaustion through upregulation of PD-L1. The findings align with existing studies in other cancers, such as breast cancer and endometrial cancer, where PD-L1 upregulation is associated with T-cell senescence and immune evasion.[24,25] These findings highlight the role of MGP in tumor immune evasion and reveal the role of MGP in regulating CD8+ T-cell function.
This study also found that MGP upregulates PD-L1 levels in ICC. PD-L1 is a key molecule by which tumor cells inhibit immune responses by binding to the PD-1 receptor molecule on T cells.[9] The data indicate that MGP upregulates PDL1 by inducing the NF-κB signaling pathway, a finding consistent with other studies. For instance, in cervical cancer and nasopharyngeal carcinoma, the NF-κB pathway has been demonstrated to drive PD-L1 expression.[26,27] The present study further elucidates the mechanism by which MGP regulates PD-L1 through the NF-κB signaling pathway, providing new insights into tumor immune evasion.
This study also discovered that MGP triggers the NF-κB pathway by enhancing the phosphorylation of p65, which is consistent with existing literature.[18] Notably, NF-κB activation is closely associated with PD-L1 upregulation in OSCC and pancreatic ductal carcinoma.[28,29] The results further confirm that MGP regulates PD-L1 expression through the NF-κB pathway, highlighting the potential of NF-κB as a therapeutic target. In addition, this study revealed that p65 knockdown counteracts MGP-induced cell proliferation and CD8+ T-cell exhaustion, indicating the crucial role of NF-κB in these effects. Previous studies have also shown that inhibiting NF-κB can effectively reverse tumor cell immune suppression.[30] These findings indicate that p65 could be a valuable therapeutic target for preventing MGP-induced oncogenic effects and immune evasion.
This study has limitations, including the use of HuCCT1 cell lines and xenograft mouse models, which may only partially replicate human ICC, and the reliance on peripheral blood CD8+ T cells instead of tumor-infiltrating lymphocytes, potentially limiting the relevance of the results to the tumor microenvironment. In addition, while the study focuses on NF-κB activation, other pathways involved in immune evasion were not explored. However, this study provides valuable insights into the role of MGP in immune evasion through NF-κB activation and PD-L1 upregulation, offering potential therapeutic targets. Future studies should validate these findings in human ICC samples, investigate extensive signaling pathways, and explore the effects of MGP on the tumor microenvironment, further developing therapeutic strategies targeting the MGP/NF-κB axis.
SUMMARY
Overall, this study explains the crucial role of MGP in ICC, particularly its mechanism of promoting tumor-mediated immune evasion through increased PD-L1 expression and inducing CD8+ T-cell exhaustion. These findings support prior research, highlighting the potential impact of MGP on ICC progression and providing new perspectives for future therapeutic strategies. Targeting MGP or its downstream signaling pathways, such as NF-κB, could introduce novel approaches to enhance immune responses and improve outcomes in ICC patients. Future work should prioritize assessing the clinical relevance of these targets and assessing their relevance across different types of cancer.
AVAILABILITY OF DATA AND MATERIALS
The data and materials that support the findings of this study are available from the corresponding author upon reasonable request.
ABBREVIATIONS
BEC: Biliary epithelial cells
c-MYC: Cellular Myc
CREB: cAMP response element-binding protein
DAPI: 4’,6-diamidino-2-phenylindole
EdU: 5-Ethynyl-2’-deoxyuridine
F: Forward
GAPDH: Glyceraldehyde-3-phosphate dehydrogenase
HuCCT1: ICC cells line
ICC: Intrahepatic cholangiocarcinoma
LAG3: Lymphocyte-activation gene 3
MGP: Matrix Gla Protein
NFATC1: Nuclear Factor of Activated T-cells 1
Ov-MGP: Overexpression-Matrix Gla Protein
Ov-NC: Overexpression-Negative control
p65: RelA
p-CREB: Phosphorylated CREB
PD1: Programmed cell death protein 1
PD-L1: Programmed cell death ligand 1
p-NFATC1: Phosphorylated NFATC1
p-p65: Phosphorylated p65
R: Reverse
Sh-MGP: ShRNA-Matrix Gla Protein
Sh-NC: ShRNA-Negative control
Sh-p65: ShRNA-p65
TIGIT: T-cell immunoreceptor with Ig and ITIM domains
TIM3: T-cell immunoglobulin and mucin domain 3
TUNEL: Terminal deoxynucleotidyl transferase dUTP nick end labeling
ACKNOWLEDGMENTS
Not applicable.
AUTHOR CONTRIBUTIONS
XHC, SQL, YCX, and KZ: Conducted the research and contributed to data analysis and interpretation of the results; JL: Provided assistance and suggestions for the experiments. All authors participated in the drafting and critical revision of the manuscript. All authors have read and approved the final manuscript. All authors were fully involved in the work, able to take public responsibility for relevant portions of the content, and agreed to be accountable for all aspects of the work, ensuring that any questions related to its accuracy or integrity are addressed.
ETHICS APPROVAL AND CONSENT TO PARTICIPATE
The study has been approved by the Beijing Maide Kangna Laboratory Animal Welfare Ethics Committee (approval No. MDKN-2024-036) (date: 2024.01.03). This study does not involve human research, so no informed consent is required.
CONFLICT OF INTEREST
The authors declare no conflict of interest.
EDITORIAL/PEER REVIEW
To ensure the integrity and highest quality of CytoJournal publications, the review process of this manuscript was conducted under a double-blind model (authors are blinded for reviewers and vice versa) through an automatic online system.
FUNDING: Not applicable.
References
- Molecular profile of intrahepatic cholangiocarcinoma. Int J Mol Sci. 2023;25:461.
- [CrossRef] [PubMed] [Google Scholar]
- Landscape of clinical resistance mechanisms to FGFR inhibitors in FGFR2-Altered cholangiocarcinoma. Clin Cancer Res. 2024;30:198-208.
- [CrossRef] [PubMed] [Google Scholar]
- Tumor cell biodiversity drives microenvironmental reprogramming in liver cancer. Cancer Cell. 2019;36:418-30, e416
- [CrossRef] [PubMed] [Google Scholar]
- Proteogenomic characterization identifies clinically relevant subgroups of intrahepatic cholangiocarcinoma. Cancer Cell. 2022;40:70-87.e15.
- [CrossRef] [PubMed] [Google Scholar]
- The role of GRP and MGP in the development of non-hemorrhagic VKCFD1 phenotypes. Int J Mol Sci. 2022;23:798.
- [CrossRef] [PubMed] [Google Scholar]
- Intracellular matrix Gla protein promotes tumor progression by activating JAK2/STAT5 signaling in gastric cancer. Mol Oncol. 2020;14:1045-58.
- [CrossRef] [PubMed] [Google Scholar]
- MGP promotes CD8(+) T cell exhaustion by activating the NF-κB pathway leading to liver metastasis of colorectal cancer. Int J Biol Sci. 2022;18:2345-61.
- [CrossRef] [PubMed] [Google Scholar]
- Antigen presentation in cancer: Insights into tumour immunogenicity and immune evasion. Nat Rev Cancer. 2021;21:298-312.
- [CrossRef] [PubMed] [Google Scholar]
- The primordial differentiation of tumor-specific memory CD8(+) T cells as bona fide responders to PD-1/PD-L1 blockade in draining lymph nodes. Cell. 2022;185:4049-66.e4025.
- [CrossRef] [PubMed] [Google Scholar]
- Aerobic glycolysis promotes tumor immune evasion by hexokinase2-mediated phosphorylation of IκBα. Cell Metab. 2022;34:1312-24.e1316.
- [CrossRef] [PubMed] [Google Scholar]
- Prostate cancer cell-derived exosomal IL-8 fosters immune evasion by disturbing glucolipid metabolism of CD8(+) T cell. Cell Rep. 2023;42:113424.
- [CrossRef] [PubMed] [Google Scholar]
- CD8(+) T cell exhaustion in anti-tumour immunity: The new insights for cancer immunotherapy. Immunology. 2023;168:30-48.
- [CrossRef] [PubMed] [Google Scholar]
- Tumor-associated macrophages regulate PD-1/PDL1 immunosuppression. Front Immunol. 2022;13:874589.
- [CrossRef] [PubMed] [Google Scholar]
- Regulation of PD-L1 expression by NF-κB in cancer. Front Immunol. 2020;11:584626.
- [CrossRef] [PubMed] [Google Scholar]
- Data on the evaluation of FGF2 gene expression in Colorectal Cancer. Data Brief. 2020;31:105765.
- [CrossRef] [PubMed] [Google Scholar]
- Roles of vitamin Kdependent protein in biomineralization (Review) Int J Mol Med. 2024;53:6.
- [CrossRef] [PubMed] [Google Scholar]
- Assessment of MGP gene expression in cancer and contribution to prognosis. Biochimie. 2023;214:49-60.
- [CrossRef] [PubMed] [Google Scholar]
- MGP promotes colon cancer proliferation by activating the NF-κB pathway through upregulation of the calcium signaling pathway. Mol Ther Oncolytics. 2020;17:371-83.
- [CrossRef] [PubMed] [Google Scholar]
- LGR4 attenuates MGP expression and suppresses EGFR activation-induced triple-negative breast cancer metastasis. Am J Cancer Res. 2024;14:3419-32.
- [CrossRef] [PubMed] [Google Scholar]
- Restoring tumor immunogenicity with dendritic cell reprogramming. Sci Immunol. 2023;8:eadd4817.
- [CrossRef] [PubMed] [Google Scholar]
- SLC38A2 and glutamine signalling in cDC1s dictate anti-tumour immunity. Nature. 2023;620:200-8.
- [CrossRef] [PubMed] [Google Scholar]
- CD8(+) T cell-intrinsic IL-6 signaling promotes resistance to anti-PD-L1 immunotherapy. Cell Rep Med. 2023;4:100878.
- [CrossRef] [PubMed] [Google Scholar]
- N(6)-methyladenosine-modified circIGF2BP3 inhibits CD8(+) T-cell responses to facilitate tumor immune evasion by promoting the deubiquitination of PD-L1 in non-small cell lung cancer. Mol Cancer. 2021;20:105.
- [CrossRef] [PubMed] [Google Scholar]
- B4GALT1 promotes immune escape by regulating the expression of PD-L1 at multiple levels in lung adenocarcinoma. J Exp Clin Cancer Res. 2023;42:146.
- [CrossRef] [PubMed] [Google Scholar]
- SPOP mutations promote tumor immune escape in endometrial cancer via the IRF1-PD-L1 axis. Cell Death Differ. 2023;30:475-87.
- [CrossRef] [PubMed] [Google Scholar]
- IFI16 promotes cervical cancer progression by upregulating PD-L1 in immunomicroenvironment through STING-TBK1-NF-kB pathway. Biomed Pharmacother. 2020;123:109790.
- [CrossRef] [PubMed] [Google Scholar]
- Epstein-barr virus-encoded circular RNA CircBART2.2 promotes immune escape of nasopharyngeal carcinoma by regulating PD-L1. Cancer Res. 2021;81:5074-88.
- [CrossRef] [PubMed] [Google Scholar]
- PER2 binding to HSP90 enhances immune response against oral squamous cell carcinoma by inhibiting IKK/NF-κB pathway and PD-L1 expression. J Immunother Cancer. 2023;11:e007627.
- [CrossRef] [PubMed] [Google Scholar]
- CRIP1 fosters MDSC trafficking and resets tumour microenvironment via facilitating NF-κB/p65 nuclear translocation in pancreatic ductal adenocarcinoma. Gut. 2023;72:2329-43.
- [CrossRef] [PubMed] [Google Scholar]
- IL-18 serves as a main effector of CAF-derived METTL3 against immunosuppression of NSCLC via driving NF-κB pathway. Epigenetics. 2023;18:2265625.
- [CrossRef] [PubMed] [Google Scholar]