Translate this page into:
Preliminary study on the cellular and molecular mechanisms of Cms1 ribosomal small subunit homolog promoting hepatocellular carcinoma progression via activation of the homolog family member A/yes-associated protein 1 signaling pathway


*Corresponding authors: Benzun Wei, Department of Hepatobiliary Surgery, Zibo Central Hospital, Zibo City, Shandong Province, China. zbzxyyweibenzun@163.com
Xiao Lyu, Department of Medical Oncology, Zibo Central Hospital, Zibo City, Shandong Province, China. xiaoxiao81473@126.com
-
Received: ,
Accepted: ,
How to cite this article: Zheng Y, Wang A, Yu S, Wei B, Lyu X. Preliminary study on the cellular and molecular mechanisms of Cms1 ribosomal small subunit homolog promoting hepatocellular carcinoma progression via activation of the homolog family member A/yes-associated protein 1 signaling pathway. CytoJournal. 2024;21:61. doi: 10.25259/Cytojournal_69_2024.
Abstract
Objective:
The precise mechanism of action of cms1 ribosomal small subunit homolog (CMSS1) in hepatocellular carcinoma (HCC) is yet unknown, although it may be essential to the malignant evolution of disease. The aim of this study was to reveal the role of CMSS1 in HCC and its possible mechanism.
Material and Methods:
The expression of CMSS1 in different HCC cell lines was detected by quantitative real-time polymerase chain reaction and Western blot. The expression of CMSS1 in HCC cells was subsequently silenced, and the proliferation capacity of HCC cells was measured by colony formation assay, 5-ethynyl-2’-deoxyuridine (EdU) assay, and flow cytometry, and the migration and metastasis capacity of the HCC cells was measured by Transwell assay and Western blot. Finally, ras homolog family member A (RhoA) and yes-associated protein 1 (YAP1) were silenced, and the relationship between CMSS1, RhoA, and YAP1 was further discussed by immunofluorescence, colony formation assay, and EdU assay.
Results:
The experimental results showed that CMSS1 is highly expressed in HCC tissues and cell lines (P < 0.001). Further experiments demonstrated that CMSS1 promotes the malignant progression of HCC by activating the RhoA GTPase/YAP1 signaling pathway (P < 0.001). Inhibition of YAP1 could reverse the enhanced proliferation and colony formation ability induced by CMSS1 (P < 0.001). Silencing CMSS1 expression can inhibit epithelial– mesenchymal transition (P < 0.01). Moreover, silencing RhoA reduces the YAP1 nuclear translocation (P < 0.001).
Conclusion:
CMSS1 promotes the malignant progression of HCC by activating the RhoA GTPase/YAP1 signaling pathway.
Keywords
Hepatocellular carcinoma
Cms1 ribosomal small subunit homolog
Ras homolog family member A GTPase
Es-associated protein 1
Malignant progression
INTRODUCTION
Hepatocellular carcinoma (HCC) poses a significant public health challenge worldwide.[1,2] Despite some progress in the treatment of HCC, the prognosis remains unsatisfactory, making it a serious challenge.[3] Therefore, a deep understanding of the mechanisms underlying the occurrence and development of HCC is of great significance for improving the survival rate of patients with HCC.[4]
Aberrant activation of signaling pathways plays a crucial role in tumorigenesis and tumor progression. Cms1 ribosomal small subunit homolog (CMSS1) is a newly discovered tumor-associated gene that plays a vital role in cancer.[5] Ras homolog family member A (RhoA) guanosine triphosphate hydrolases (GTPase) is involved in cellular processes such as proliferation, migration, and transformation.[6,7] Yes-associated protein 1 (YAP1) is a critical transcription factor believed to be a key regulator of HCC.[8] Aberrant activation of RhoA GTPase and YAP1 has been strongly associated with the malignant progression of HCC.[9-11] However, the regulatory role of CMSS1 in RhoA GTPase and YAP1 and its mechanism of action in HCC are not yet clear.
The main objective of this study is to investigate the mechanism of action of CMSS1 in HCC. Functional experiments, including overexpression and silencing of CMSS1, were conducted, and their effects on HCC cell proliferation and colony formation ability were evaluated. Further experiments assessed whether CMSS1 promotes the malignant progression of HCC by activating the RhoA GTPase/YAP1 signaling pathway. A deep understanding of the mechanism of action of CMSS1 in HCC will provide new insights into the early diagnosis and treatment of HCC and contribute to improved survival rates and quality of life for patients.
MATERIAL AND METHODS
Data analysis using Gene Expression Profiling Interactive Analysis (GEPIA)
Data analysis was performed using the “Expression Analysis - Boxplot” module of GEPIA2 (http://gepia2.cancer-pku.cn/#index) to obtain the differential expression data between the tumor tissues and corresponding normal tissues in the GTEx database. The criteria for analysis were set as “P < 0.01, log2FC < 1” and “tumors with no normal tissue controls available.”
Cell culture
Frozen liver cancer cells (Beyotime, Shanghai, China) and human normal liver cells LO2 (iCell-h054, Cellverse, Shanghai, China) were retrieved from liquid nitrogen and cultured in Roswell Park Memorial Institute 1640 medium (C0893, Beyotime, Shanghai, China) containing 10% fetal bovine serum (A5669701, Gibco, Big Island, New York, USA) incubated at 37°C with 5% CO2. Cells with a viability rate of over 95% were selected for further experiments. The cells were washed twice with phosphate-buffered saline (PBS) and then digested with trypsin (40101ES25, Yeasen, Shanghai, China). After digestion, 4 mL of Dulbecco’s Modified Eagle Medium (11885084, Gibco, Big Island, New York, USA) was added to terminate the trypsin digestion. The cells were thoroughly pipetted to achieve a single-cell suspension, and the cell count was determined. The cells used in this study underwent mycoplasma detection, and the results indicated the absence of mycoplasma contamination. All cell lines were authenticated through short tandem repeat (STR) analysis, confirming their identity.
Liver cancer cells: PLC/PRF/5 (C6732), Bel-7402 (C6109), HePG2 (C6346), and SMMC-7721 (C6865).
Cell transfection
Bel-7402 and PLC/PRF/5 cells were transfected using a lipofectamine transfection reagent (18324010, Thermo Fisher Scientific, Waltham, MA, USA). The cells were divided into groups: small interfering (si)-NC group (transfected with scrambled negative control), siCMSS1 1#, and siCMSS1 2# (Cat. AM16708, Thermo Fisher Scientific, Waltham, MA, USA); Vector, overexpressing (OE)-CMSS1, OE-CMSS1+siRhoA, and OE-CMSS1+siYAP1. After 48 h of transfection, the cells from each group were collected for further analysis. The sequence of the siRNA was as follows: siCMSS1 1#_: 5’-TACCCGTGATGTTCTG C-3’; siCMSS1_2#: 5’-TCGAGACCTGAGCTGA AA-3’; si-NC: GCCTGTGATGTGCTGC; siRhoA: AGCGAAGGCTTGTA GTAGCCC; siYAP1: CCACCAAGC TAGATAAAGA. All targeted sequences were synthesized by GenePharma (Suzhou, China).
5-ethynyl-2'- deoxyuridine (EdU) assay
The cells were cultured on the lid of a 6-well plate with a density of 1 × 10⁵ cells per well and incubated with EdU solution (BS975, Biosharp Life Sciences, Hefei, Anhui, China) with a concentration of 10 μmol/L for 2 h. After that, the sample was stained for 30 min with 4’,6-diamino-2-phenylindole (DAPI, C0065, Solarbio, Beijing, China), fixed for 15 min at room temperature with 4% paraformaldehyde, and then penetrated with 0.5% Triton X-100 (IT9100, Solarbio, Beijing, China) for 10 min. After washing with PBS (P1010, Solarbio, Beijing, China) and sealing with glycerin, observation was performed using a fluorescence microscope (CX41-32RFL, Olympus Corporation, Tokyo, Japan). The EdU incorporation rate was calculated as follows: EdU positive rate (%) = (number of EdU positive cells/total number of cells) × 100%.
Quantitative real-time polymerase chain reaction
Total RNA was extracted using Trizol reagent (R0011, Beyotime, Shanghai, China). Using the Reverse Transcription System Kit (4366597, Thermo Scientific, Wilmington, Massachusetts, USA), total RNA was used to create the first strand of complementary DNA. The QuantStudioTM5 Real-Time Polymerase Chain Reaction (PCR) System (Thermo Scientific, Waltham, MA, USA) was used to detect the messenger RNA (mRNA) levels, and KAPA SYBR FAST UNI quantitative PCR Kits (#KK4601, Kapa Biosystems, Boston, MA, USA) were used to quantify them. Adjust reaction solution to 20 μL according to manufacturer’s instructions. The primers used were as follows: Yap1: 5’-GAACTCGGCTTC AGGTCCTC-3’ (F), 5’-GGTTCATGGCAAAACGAGGG-3’ (R); RhoA: 5’-AACATACCCATGGCCAACCT-3’ (F), 5’-AGCGAAGGG TTGTAGTAGCCC-3 (R); CMSS1: GCCAATGATTT GACTCACA GTCT (F), CTGAATGCTGTCAT CGACCTAAT (R); GAPDH: AGAAGGCTGGGG CTCATTTG (F), GCAGGAGGCATTGCTGATGA (R). TAZ. TGCT TCTGGACCAGTGAGTG (F), CTGGTAGA CGCCATCTCCTC (R). The relative mRNA expression was calculated using the 2-ΔΔCT method.
Western blot
Protein extraction was performed using radioimmunoprecipitation assay lysis (P0013B, Beyotime, Shanghai, China) buffer containing phenylmethanesulfonyl fluoride. Proteins were separated by sodium dodecyl sulfate polyacrylamide gel electrophoresis, transferred onto polyvinylidene fluoride membranes, blocked with 5% skim milk for 2 h, and incubated with primary antibodies. The antibodies used in this study were as follows: Anti-CMSS1 (1:1000, PA5-60138, Thermo Fisher, Waltham, Massachusetts, USA), Anti-Yap1 (1:1000, 46189, Thermo Fisher, Waltham, Massachusetts, USA), Anti-E-cad (1:1000, 47650, Thermo Fisher, Waltham, Massachusetts, USA), Anti-Vimentin (1:1000, 11883, Thermo Fisher, Waltham, Massachusetts, USA), N-cadherin (1:1000, 19486, Thermo Fisher, Waltham, Massachusetts, USA), TAZ (1:1000, 703032, Thermo Fisher, Waltham, Massachusetts, USA), P84 (1:1000, 23261, Thermo Fisher, Waltham, Massachusetts, USA), and Anti-GAPDH (1:1000, ab8245, Abcam, MA, USA). Goat antirabbit immunoglobulin G (IgG) (1:4000, ab6721, Abcam, MA, USA) and goat antimouse IgG (1:8000, ab205719, Abcam, MA, USA) were used as secondary antibodies. Proteins were visualized using an enhanced chemiluminescence detection system (Tanon-4600, Beijing Junyi Oriental Electrophoresis Equipment Co., Ltd, Beijing, China). The levels were determined using ImageJ software (Version: 1.8.0, National Institutes of Health, Bethesda, MD, USA).
Colony formation assay
The liver cancer cells from each group were seeded at a density of 100 cells per well in a six-well plate. After 2 weeks of incubation, the cells were fixed with methanol for 15 min. Crystal violet (C0121, Beyotime Biotechnology, Shanghai, China) staining was performed for 30 min, and colonies with more than 50 cells were counted under a low-power microscope (BX53, Olympus, Tokyo, Japan).
Flow cytometry
Cells from each group were washed twice with precooled PBS. Then, 500 μL of binding buffer was added and mixed well. Cells were stained with fluorescein isothiocyanate (FITC)/PI kits (40302ES50, Yeasen, Shanghai, China). The excitation spectrum of FITC is 488 nm, and the emission spectrum of FITC is 525 nm. Cell apoptosis rate was measured using a flow cytometer (FACS Aria III, BD Biosciences, Franklin, New Jersey, USA) and analyzed using FlowJo software (Version: 1.8.0, BD Biosciences, Franklin, New Jersey, USA).
Transwell assay
Cells in logarithmic growth phase were seeded in a six-well plate with Transwell inserts of 8.0 μm pore size. After 24 h, the cells were transfected and treated. After 8 h, the medium was changed and the cells were digested with trypsin. Approximately 4 × 10⁴ cells were added to each Transwell insert. The difference between the invasion assay and migration assay was that the Transwell inserts for invasion assay were precoated with 0.3 mg/mL Matrigel (354230, Corning Incorporated, Corning, NY, USA). The Transwell inserts were allowed to solidify in a 37°C incubator for 3–4 h before further experiments. After 24 h, the cells were fixed with 4% paraformaldehyde and stained with 0.1% crystal violet for 20 min. Cotton swabs were used to remove cells on the upper surface of the Transwell inserts. Three random fields were selected and photographed at ×200 magnification for cell counting analysis.
Immunofluorescence
Cell suspensions were seeded in a 24-well plate. Cells were fixed, incubated with 0.1% Triton X-100 for 15 min, blocked with 5% bovine serum albumin at 37°C for 1 h, and underwent another round of PBS washing. YAP1 antibody (1:300, ab205270, Abcam, MA, USA) was added and incubated overnight at 4°C. Secondary antibody (1:800, Sheep Anti-Rabbit IgG, 1:1000, ab6747, Abcam, MA, USA) was added and incubated. DAPI staining was performed for 30 min, followed by washing with PBS. The stained slides were evaluated by two experienced pathologists. The stained slides were observed, and the images were captured using a fluorescence microscope (DM3000, Leica, Wetzlar, Germany).
Cell counting kit-8 (CCK-8) assay
Approximately 5000 cells were seeded in a 96-well plate, and 100 μL 10% CCK-8 (BS350A, Biosharp Life Sciences, Hefei, Anhui, China) was added to each well. After incubation for 48 h, the absorbance (optical density) was measured at 450 nm using a microplate reader (iD5, Molecular Devices, Sunnyvale, CA, USA).
Statistical analysis
Statistical analysis was performed using Statistical Package for the Social Sciences 24.0 software (24.0, IBM, Corporation, New York City, NY, USA). Data were presented as mean ± standard deviation. Analysis of variance was used for comparisons among multiple groups, and t-tests were used for comparisons between two groups. P < 0.05 was considered statistically significant.
RESULTS
CMSS1 is overexpressed in HCC
CMSS1 expression was higher in HCC tissues (P < 0.05) [Figure 1a]. Using quantitative real-time PCR to detect CMSS1 in different HCC cell lines revealed differences in CMSS1 expression levels among different cell lines. Specifically, CMSS1 expression was lowest in the LO2 cell line and highest in the PLC/PRF/5 cell line (P < 0.001) [Figure 1b]. Using Western blot to detect the protein levels of CMSS1 in different HCC cell lines revealed a consistent trend with CMSS1 mRNA levels (P < 0.001) [Figure 1c and d].
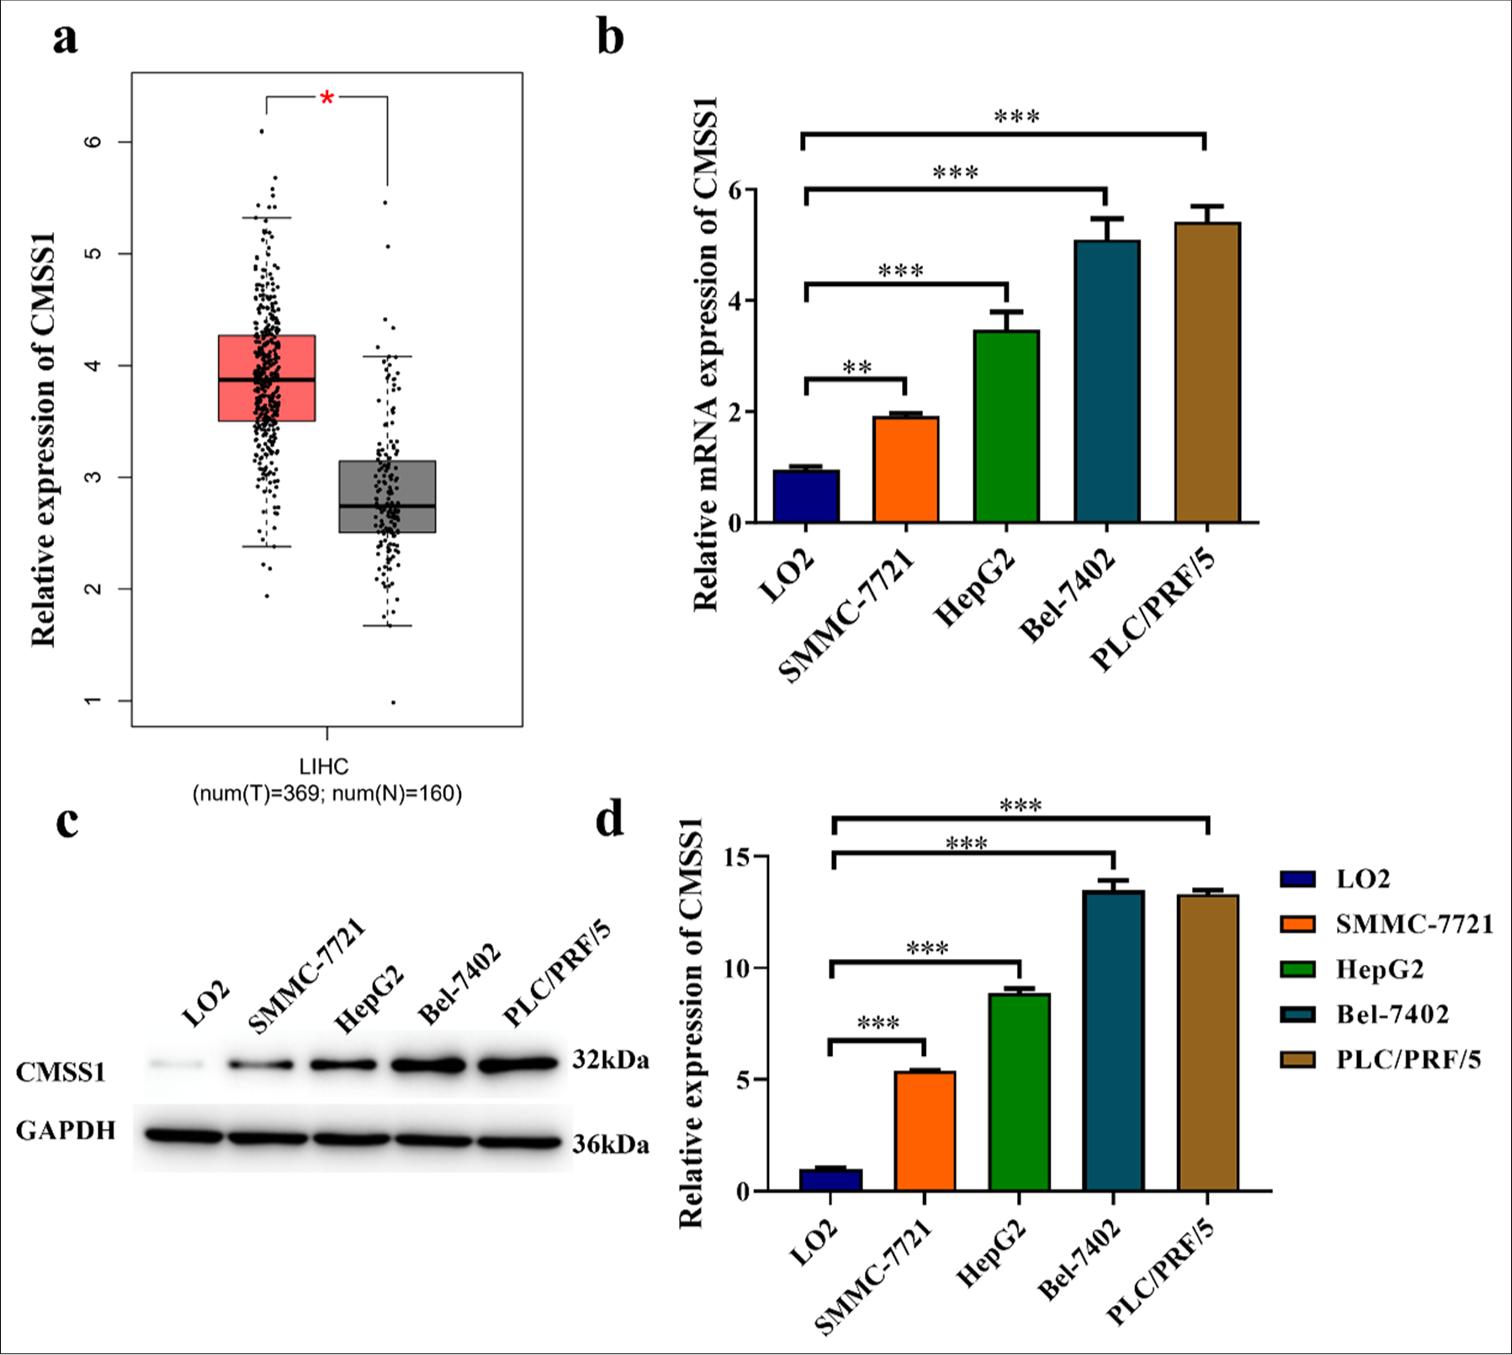
- CMSS1 is overexpressed in HCC. (a) mRNA levels of CMSS1 in HCC and normal tissues, (b-d) mRNA (b) and Protein (c and d) levels of CMSS1 in liver cancer cells and normal liver cells. n = 3. ✶P < 0.05, ✶✶P < 0.01, and ✶✶✶P < 0.001. T: Tumor, N: Normal, LIHC: Liver hepatocellular carcinoma, CMSS1: Cms1 ribosomal small subunit homolog, HCC: Hepatocellular carcinoma, mRNA: Messenger RNA.
CMSS1 promotes proliferation and inhibits apoptosis of HCC in vitro
The efficiency of CMSS1 siRNA was validated. In the siCMSS1 1# and siCMSS1 2# groups, CMSS1 were reduced (P < 0.01) [Figure 2a-c], indicating that CMSS1 siRNA effectively inhibits the expression of CMSS1 gene. The colony formation assay results showed that in both cell lines, the siNC group had the highest number of colonies, whereas the siCMSS1 1# and siCMSS1 2# groups had fewer colonies (P < 0.01) [Figure 2d and e]. This outcome suggested that the use of CMSS1 siRNA can inhibit the proliferative ability of HCC cells. The EdU assay is a commonly used method for detecting cell proliferation and assessing DNA synthesis activity. [Figure 2f-h] shows that in both cell lines, the siNC group had the highest number of EdU-positive cells, whereas the siCMSS1 1# and siCMSS1 2# groups had fewer EdU-positive cells (P < 0.001). This finding further supported the inhibitory effect of CMSS1 siRNA on the proliferation of HCC cells. [Figure 2i and j] shows that in both cell lines, the siNC group had the lowest apoptosis rate, whereas the siCMSS1 1# and siCMSS1 2# groups had higher apoptosis rates (P < 0.05).
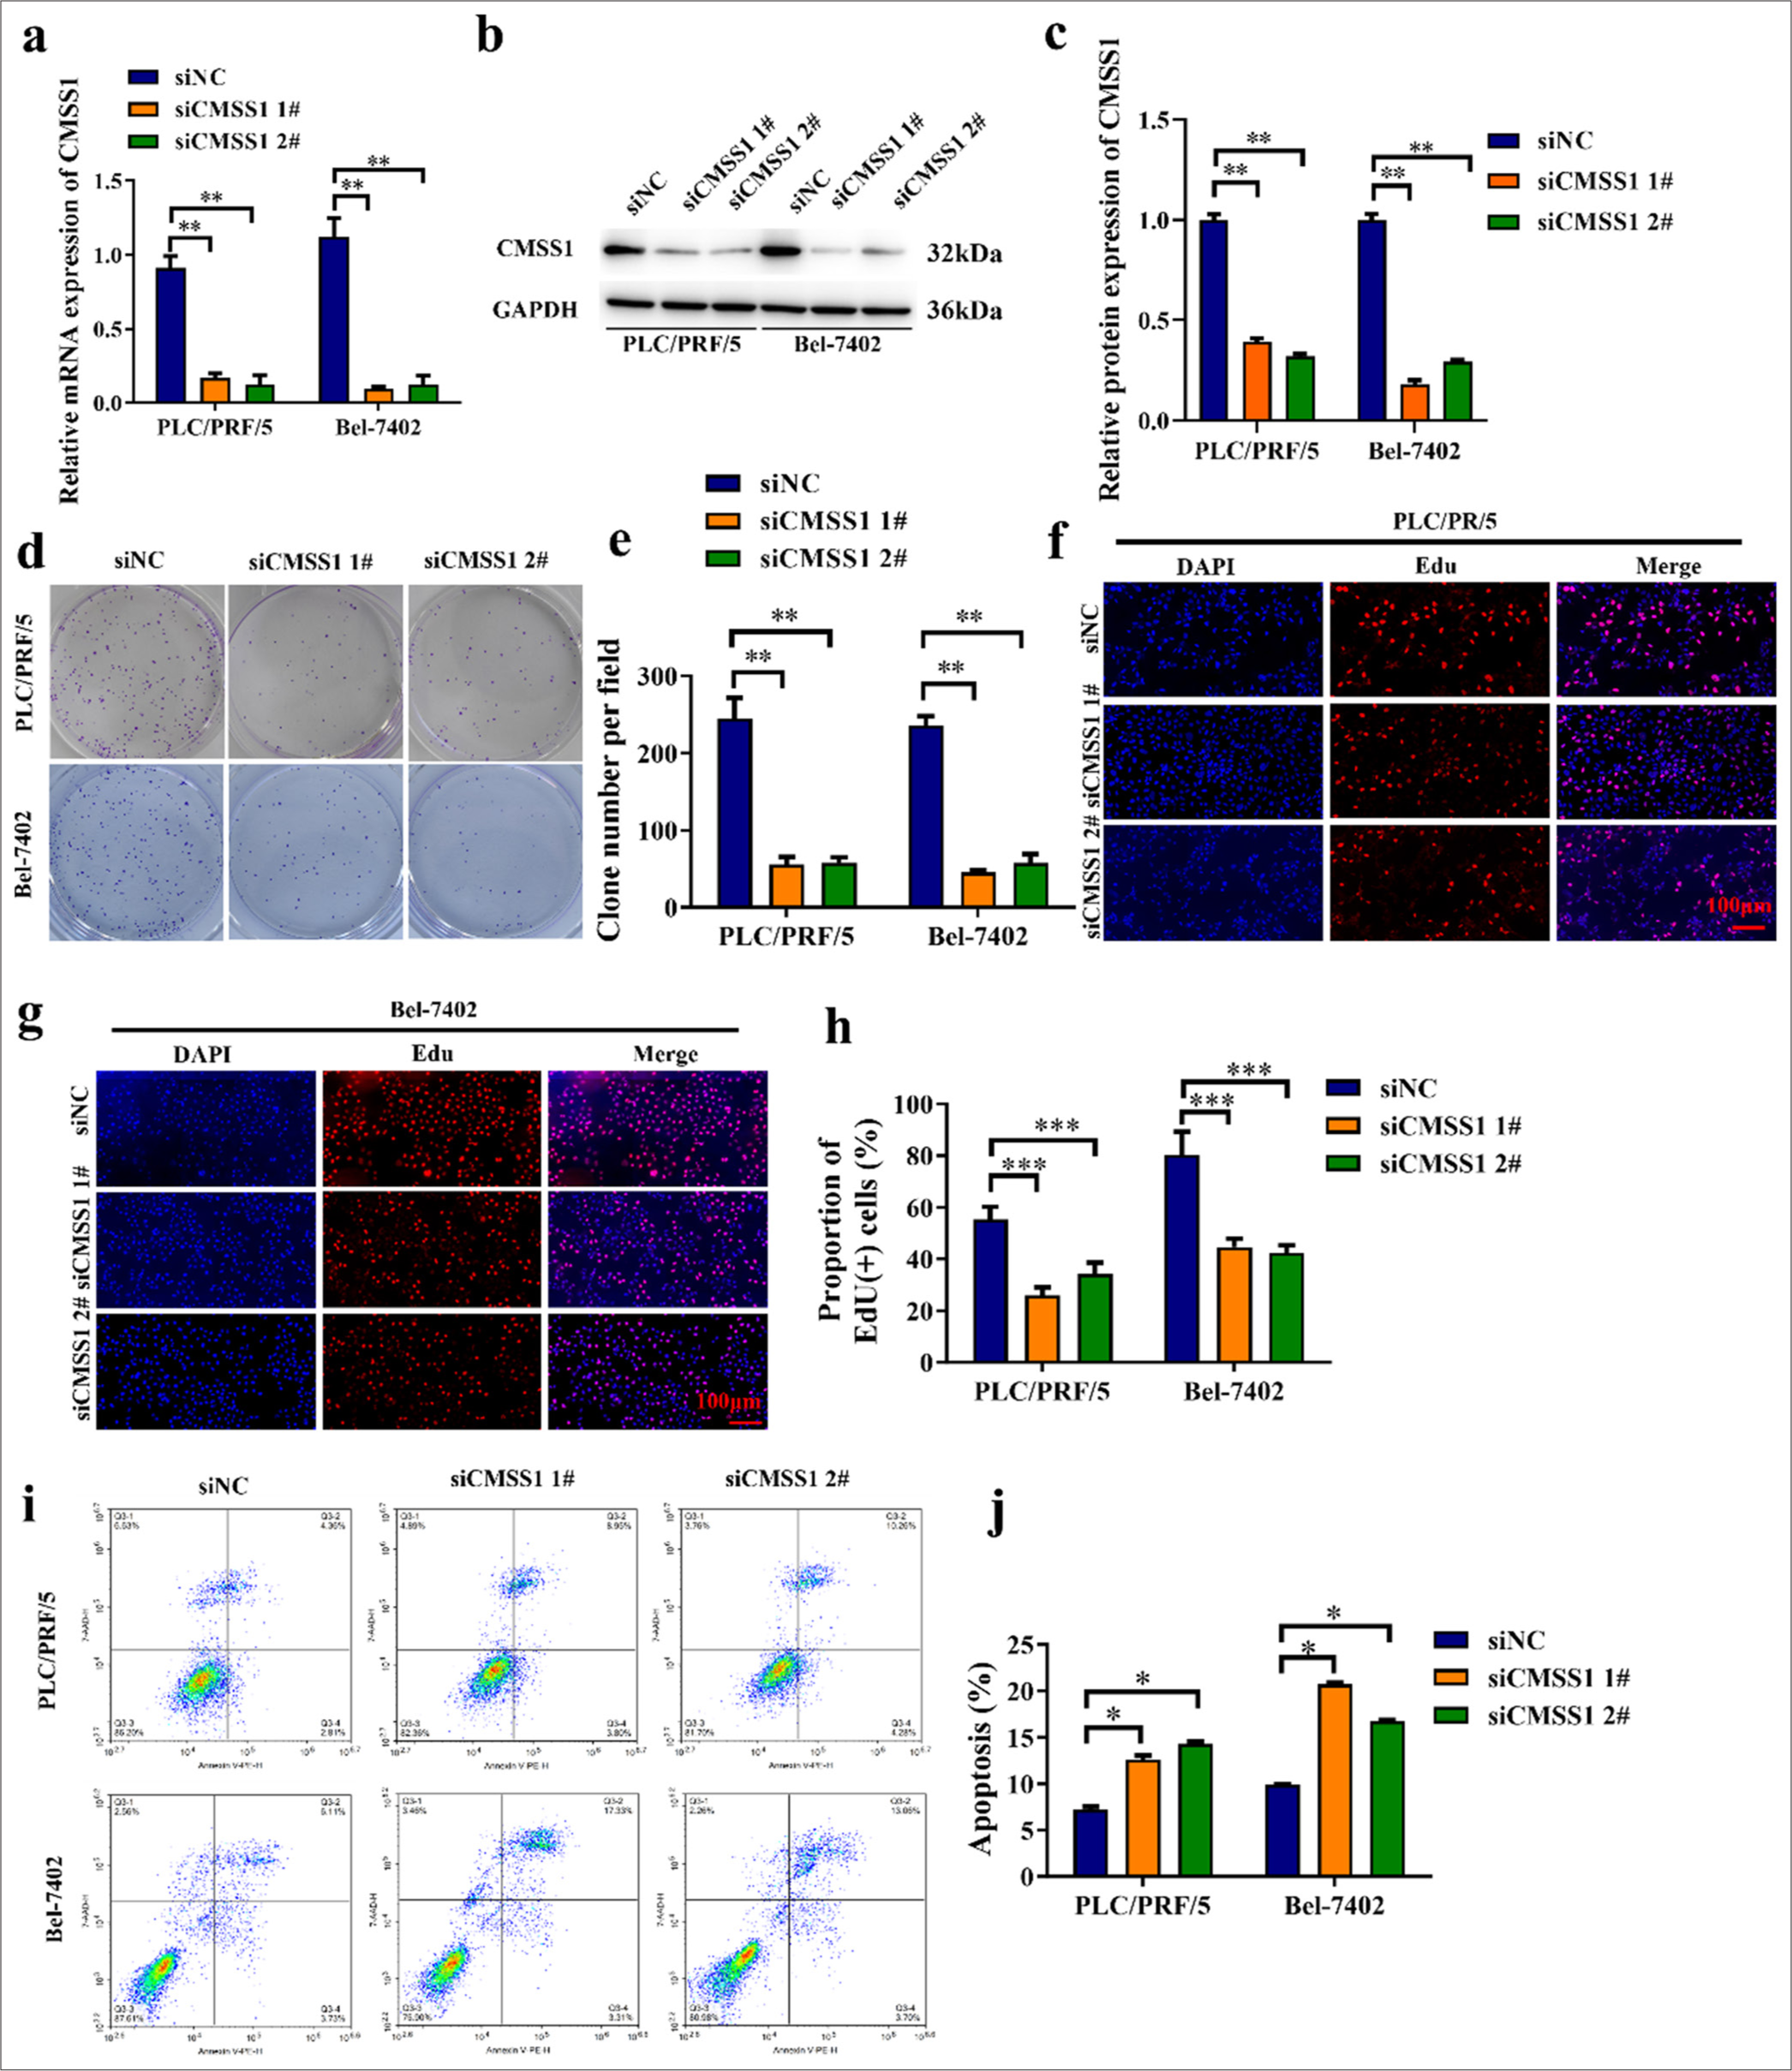
- CMSS1 promotes proliferation and inhibits apoptosis in HCC in vitro. (a) Efficiency of CMSS1 siRNA confirmed by qRT-PCR, (b and c) Efficiency of CMSS1 siRNA confirmed by immunoblotting, (d and e) Colony formation assay after silencing CMSS1, (f-h) EdU assay after silencing CMSS1, (i and j) Flow cytometry analysis showing that CMSS1 overexpression increases apoptosis rate whereas CMSS1 deficiency decreases apoptosis rate. n = 3. ✶P < 0.05, ✶✶P < 0.01, ✶✶✶P < 0.001. CMSS1: Cms1 ribosomal small subunit homolog, HCC: Hepatocellular carcinoma, siRNA: Small interfering RNA.
CMSS1 promotes the metastasis of HCC
Invasion is the process by which tumor cells spread and invade surrounding tissues, and it is a crucial step in tumor metastasis. Figures 3a and b show that in the siNC group, the number of invading cells was the highest, whereas in the siCMSS1 1# and siCMSS1 2# groups, the number was reduced (P < 0.01). This result indicated that the invasive ability of cells with silenced CMSS1 expression is inhibited. The E-cadherin level was lower in the siNC group, whereas N-cadherin and Vimentin were higher. By contrast, in the siCMSS1 1# and siCMSS1 2# groups, E-cadherin was increased, whereas N-cadherin and Vimentin were decreased (P < 0.01) [Figure 3c-f]. This outcome indicated that silencing CMSS1 expression can inhibit epithelial–mesenchymal transition (EMT), thereby suppressing the metastatic ability of tumor cells.
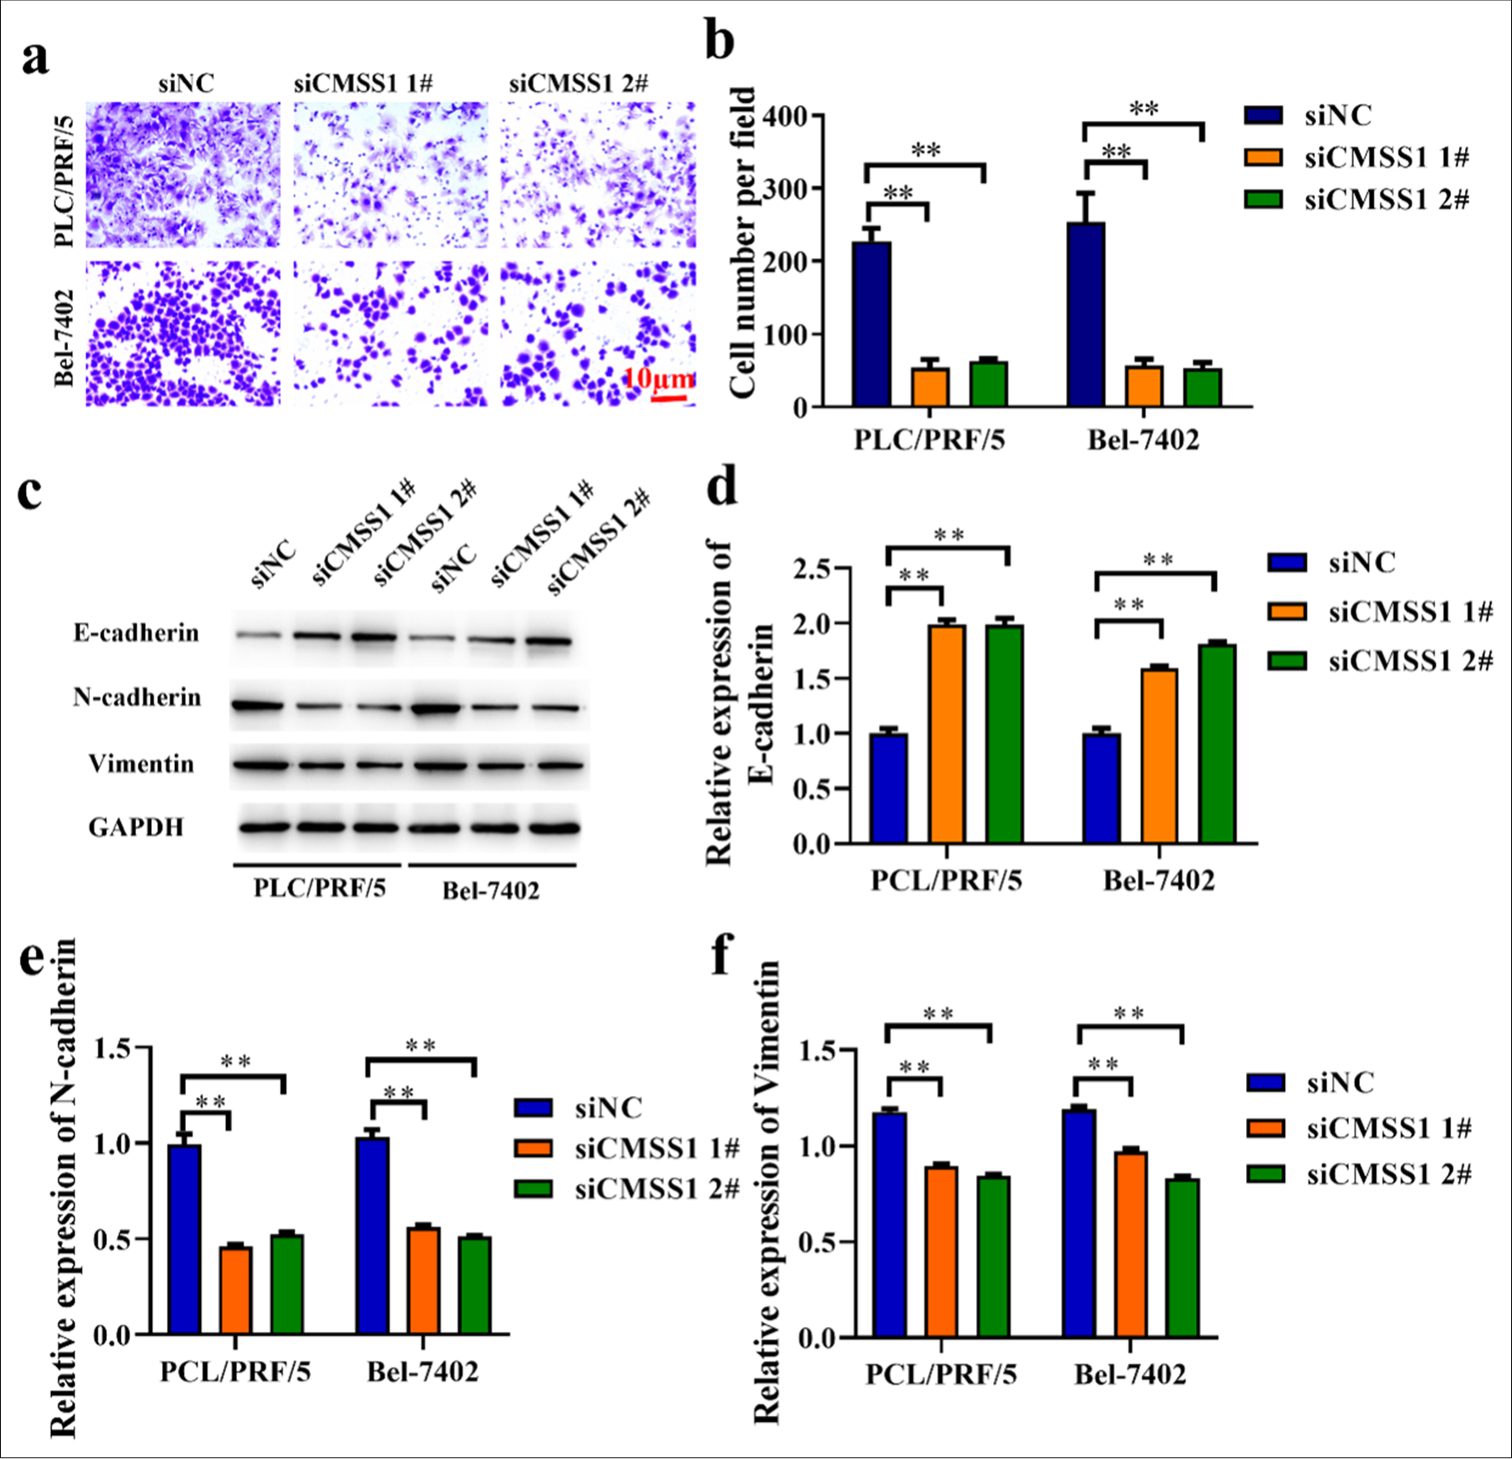
- CMSS1 promotes metastasis in HCC. (a and b) Inhibition of PCL/PRF/5 and Bel-7402 cells invasion by silencing CMSS1 expression. (c-f) Expression of EMT-related genes in PCL/PRF/5 and Bel-7402cells evaluated by Western blot after silencing CMSS1. n = 3. ✶✶P < 0.01. CMSS1: Cms1 ribosomal small subunit homolog, HCC: Hepatocellular carcinoma.
CMSS1 promotes YAP1 nuclear translocation
The transfection efficiency was evaluated by comparing CMSS1 in cells transfected with CMSS1 gene expression vector (Vector) and cells OE-CMSS1 gene. The experimental results showed that CMSS1 was low, whereas in the OECMSS1 group, CMSS1 was high (P < 0.01) [Figure 4a]. The effect of CMSS1 on YAP1 and PDZ-binding motif (TAZ) nuclear translocation was studied by detecting YAP1 and TAZ in nuclear extracts. The results showed that in the Vector group, YAP1 and TAZ were low, whereas in the OECMSS1 group, YAP1 and TAZ were increased (P < 0.001) [Figure 4b and c]. This result indicated that the overexpression of CMSS1 can increase YAP1 nuclear translocation and can regulate gene expression in the nucleus. Immunofluorescence analysis was performed. The experimental results showed that in the Vector group, CMSS1 in the nucleus was low, whereas in the OE-CMSS1 group, CMSS1 in the nucleus was increased (P < 0.01) [Figure 4d and e]. This result suggested that the overexpression of CMSS1 can promote YAP1 nuclear localization.
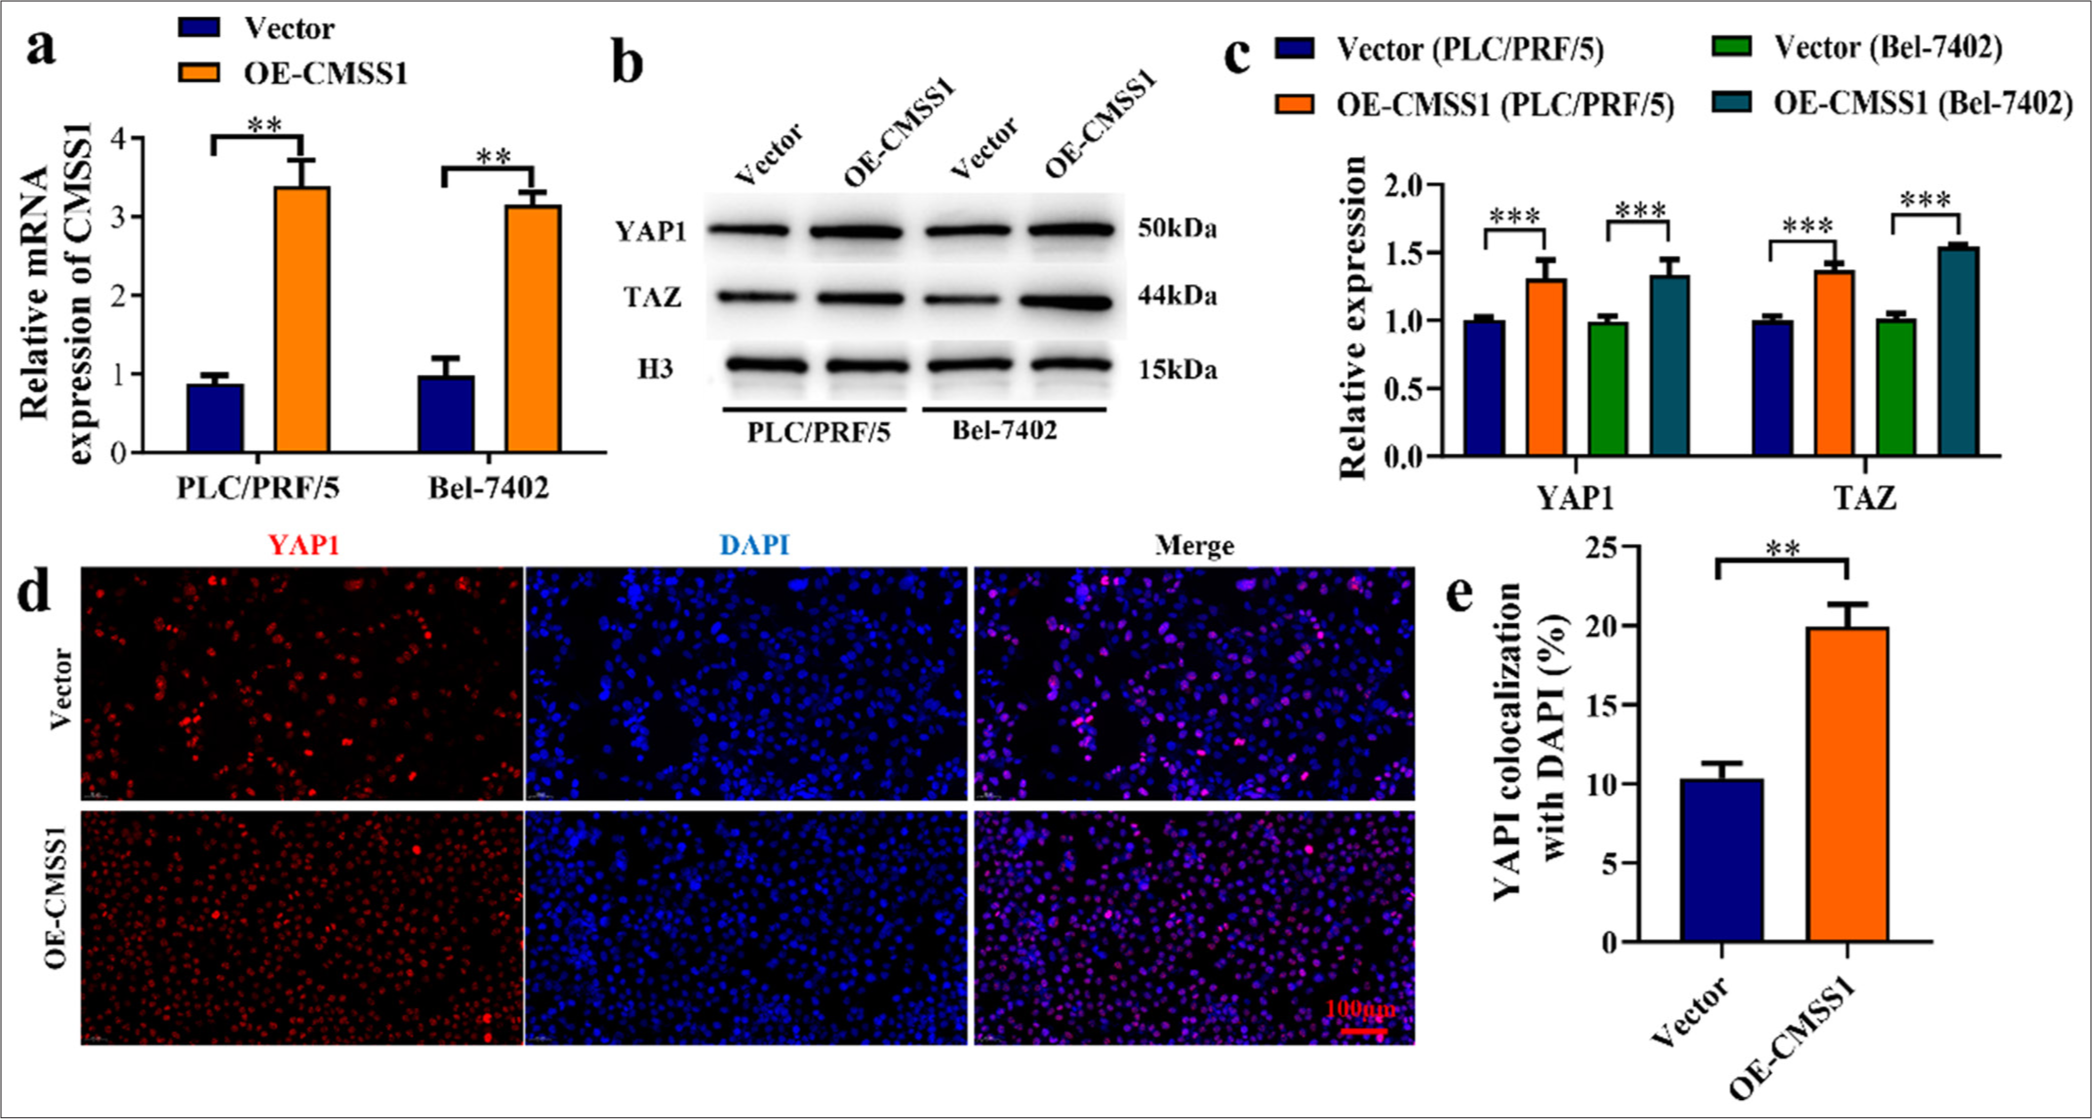
- CMSS1 promotes YAP1 nuclear translocation. (a) Transfection efficiency of CMSS1, (b and c) CMSS1 overexpression increases YAP1 and TAZ nuclear translocation, (d) Quantification of YAP1 nuclear localization after overexpression of CMSS1, (e) Immunofluorescence analysis after overexpression of CMSS1. n = 3. ✶✶P < 0.01, ✶✶✶P < 0.001. CMSS1: Cms1 ribosomal small subunit homolog, YAP1: Yes-associated protein 1.
CMSS1 promotes YAP1 signaling pathway activation through RhoA
Furthermore, the role of CMSS1 in promoting the YAP1 signaling pathway through RhoA activation was investigated. Figure 5a shows that RhoA was increased, whereas in the Vector group, RhoA was low (P < 0.01). This finding indicated that the overexpression of CMSS1 can increase RhoA. The efficiency of siRhoA transfection was confirmed by detecting RhoA mRNA expression levels in the siRhoA group, which showed lower expression compared with the control si-NC group, indicating successful transfection of RhoA-specific siRNA (P < 0.001) [Figure 5b and c]. Moreover, inhibiting RhoA reduces YAP1 and TAZ nuclear translocation. Using RhoA-specific si-RNA (siRhoA) to inhibit the expression of RhoA, the nuclear translocation of YAP1 and TAZ was detected. The experimental results showed that in the OECMSS1 group, after inhibiting RhoA, the level of YAP1 and TAZ nuclear translocation was decreased (P < 0.001) [Figure 5d-f]. This outcome suggested that RhoA plays a vital role in CMSS1-mediated YAP1 nuclear translocation.
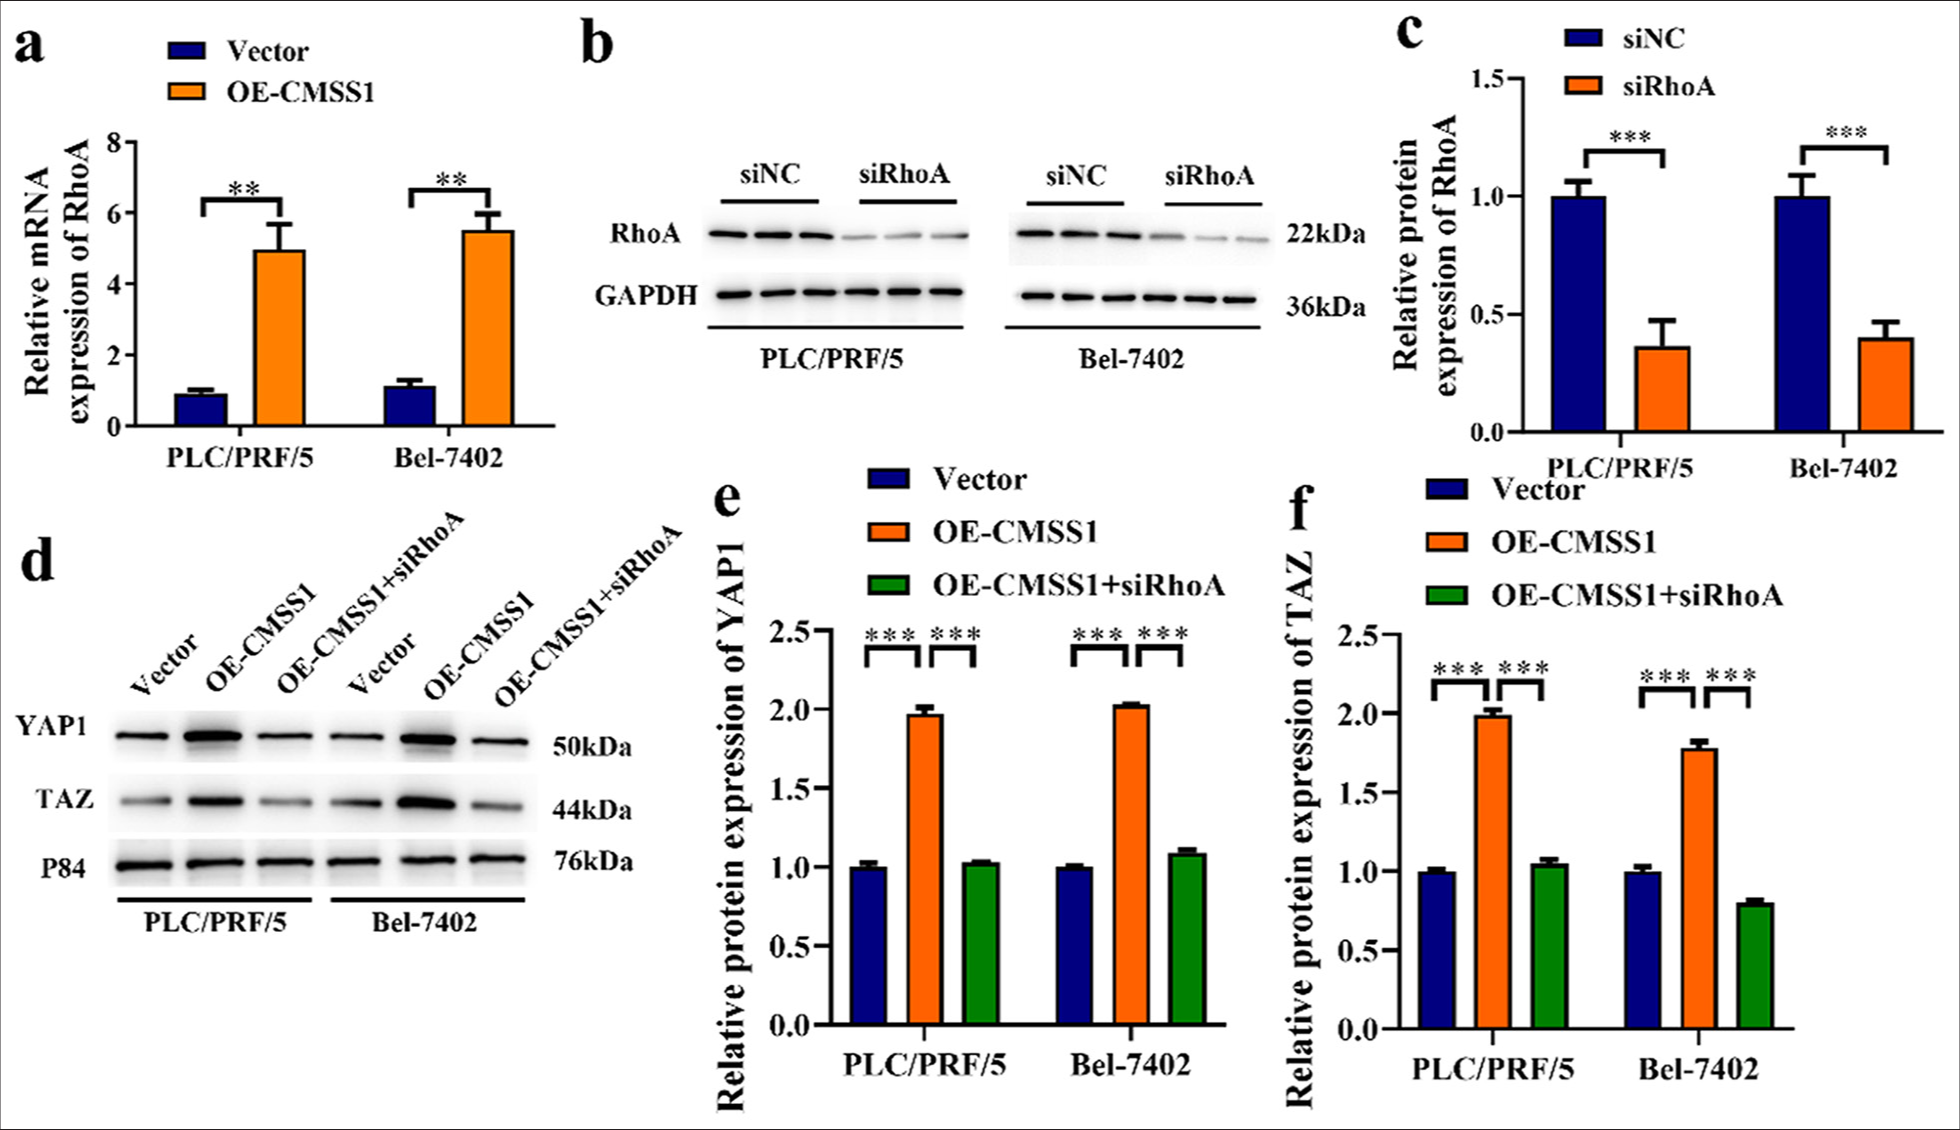
- CMSS1 promotes YAP1 signaling pathway activation through RhoA. (a) Overexpression of CMSS1 increases RhoA expression levels. (b and c) Western blot strip and protein level of RhoA after overexpression of CMSS1, (d-f) Silencing RhoA inhibits YAP1 and TAZ nuclear translocation by reducing the Overexpression of CMSS1. n = 3. ✶✶P < 0.01, ✶✶✶P < 0.001. CMSS1: Cms1 ribosomal small subunit homolog, YAP1: Yes-associated protein 1, RhoA: Ras homolog family member A.
Silencing YAP1 reverses CMSS1-mediated HCC progression
YAP1 transfection efficiency analysis confirmed that the transfection was successful in the silenced YAP1 group (siYAP1), and the YAP1 expression level of siYAP1 was lower (P < 0.001) [Figure 6a-c]. Figures 6d and e show that the overexpression CMSS1 increased cell proliferation ability, whereas in the OE-CMSS1+siYAP1 group, cell proliferation ability was decreased (P < 0.01). This result revealed that silencing YAP1 can reverse CMSS1-mediated HCC progression. The results from the colony formation assays in two different cell lines indicated that OE-CMSS1 significantly enhances colony formation in both cell lines. However, silencing YAP with siRNA markedly reduces colony formation compared with the cells OE-CMSS1 (P < 0.01) [Figure 6f and g]. In the OE-CMSS1 group, the proportion of EdU-positive cells was increased, whereas in the OE-CMSS1+siYAP1 group, the proportion of EdU-positive cells was decreased (P < 0.01) [Figure 6h and i]. In the OE-CMSS1+siYAP1 group, CMSS1, YAP1, and RhoA mRNA expression decreased (P < 0.01) [Figure 6j].
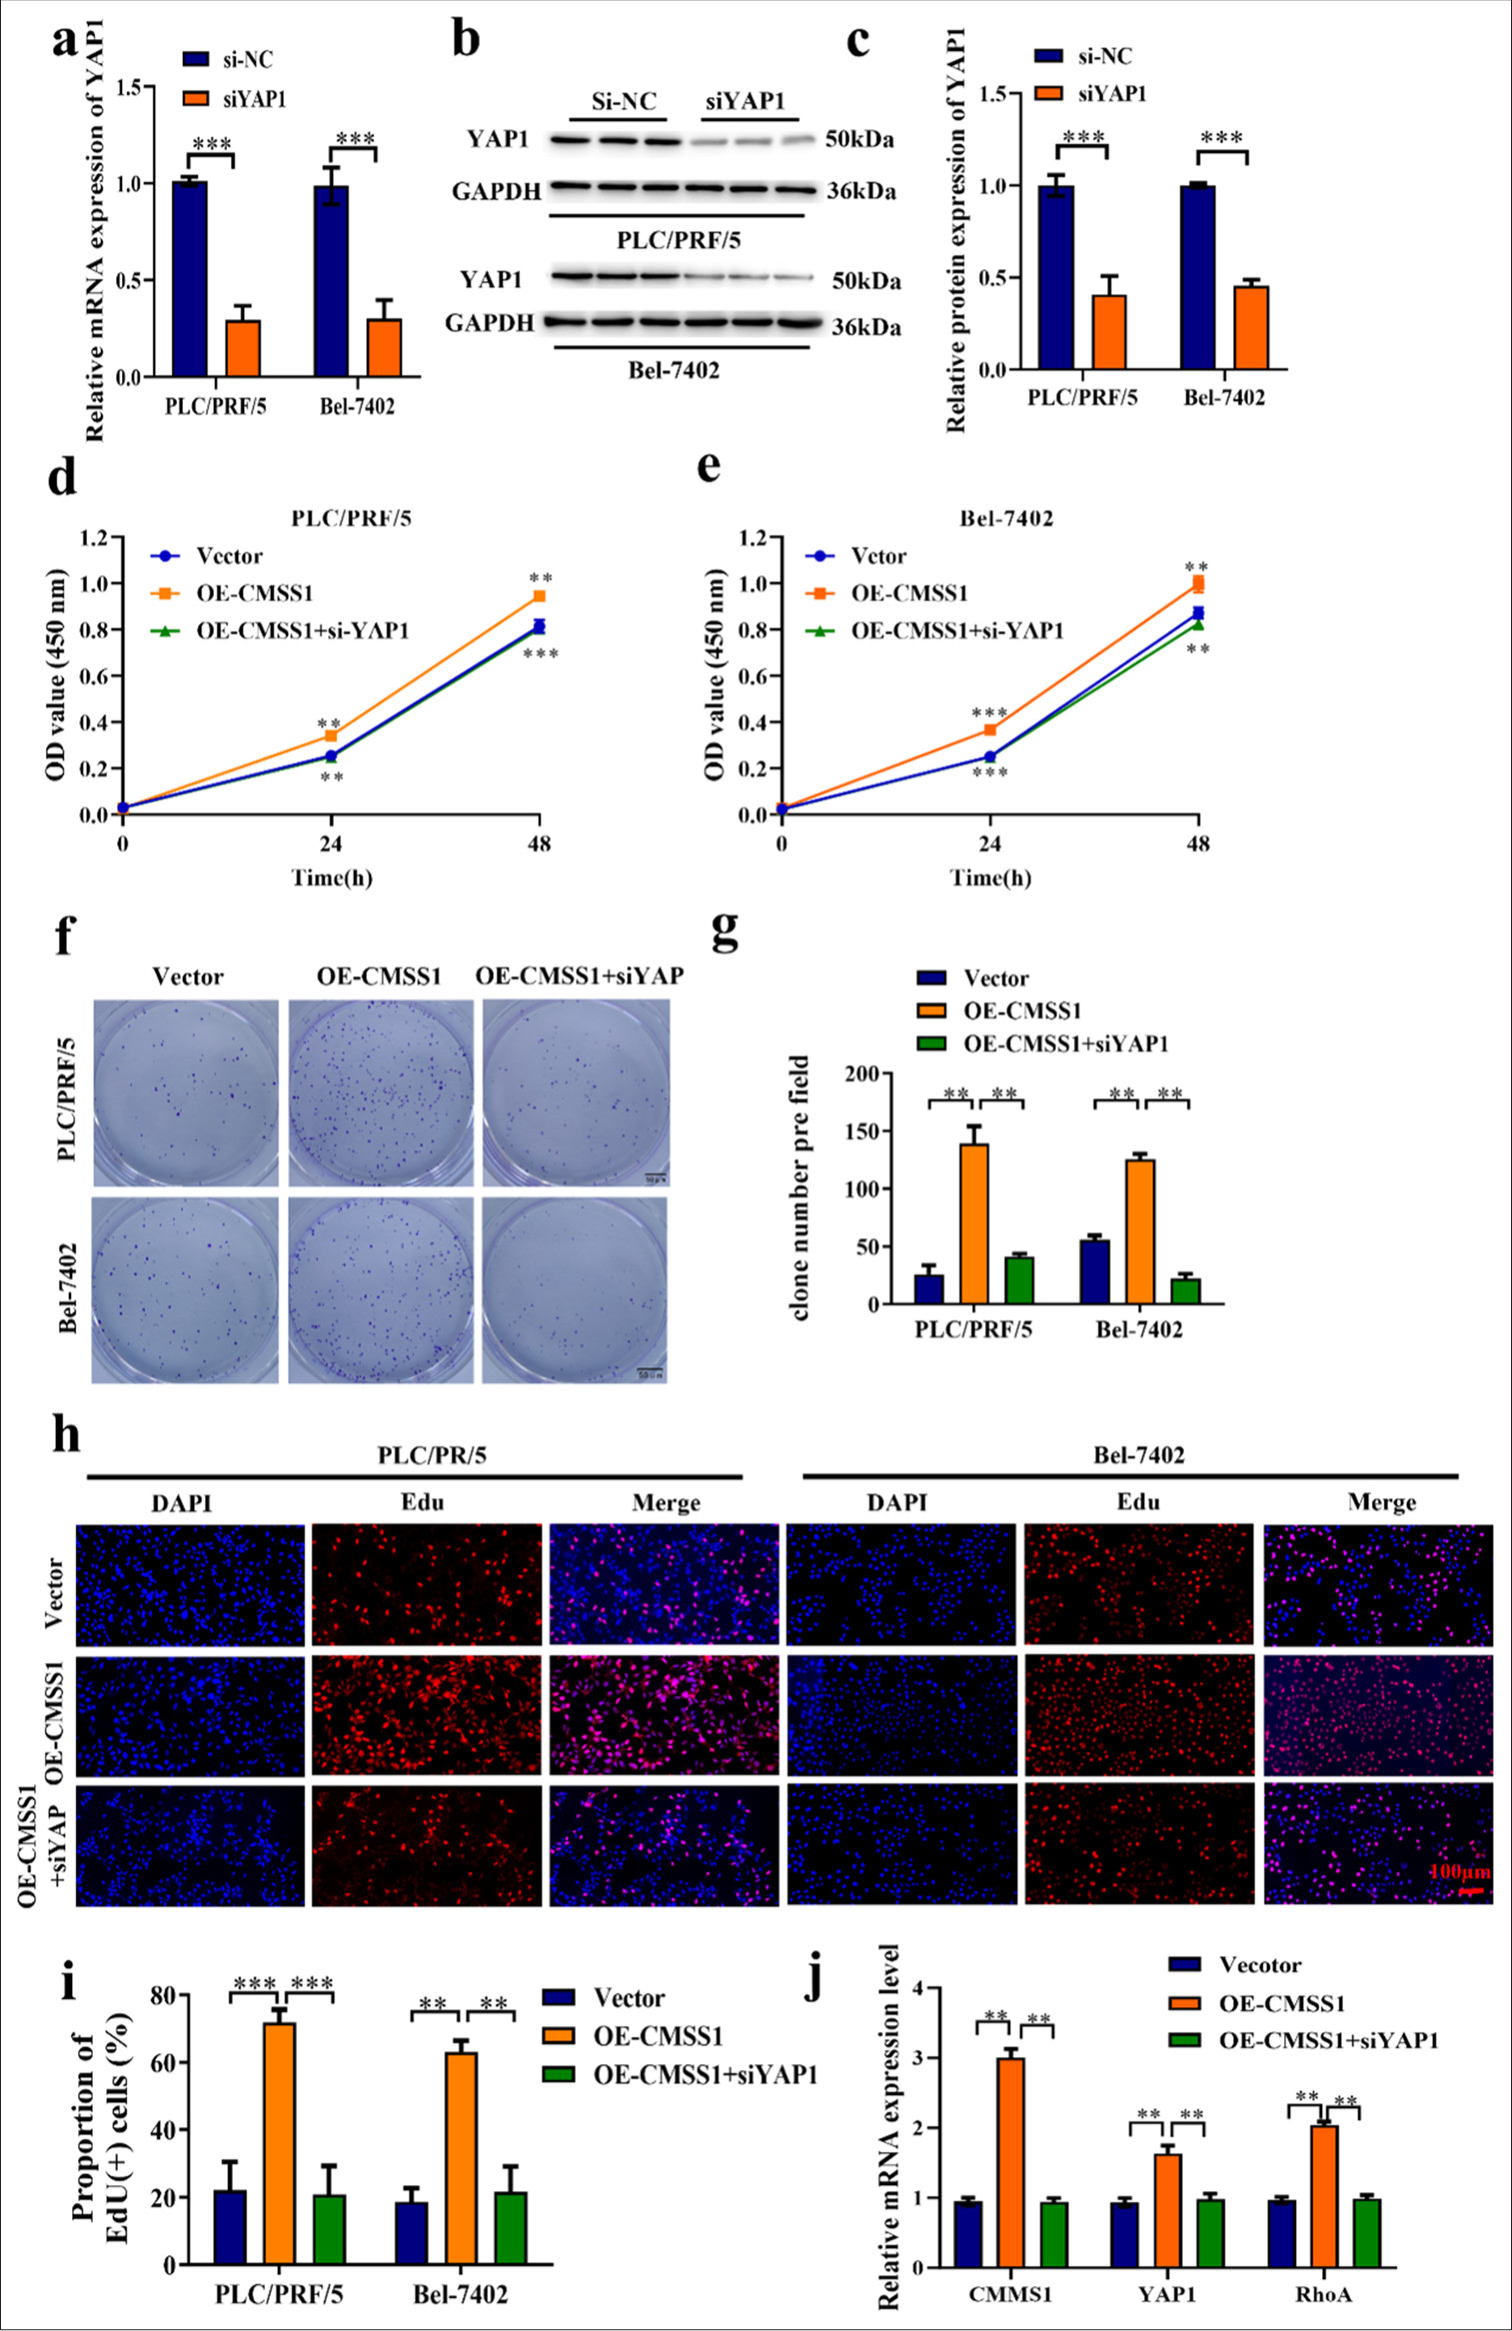
- Silencing YAP1 reverses CMSS1-mediated HCC progression. (a) Transfection efficiency of siYAP1, (b) Western blot strip and protein level of YAP1 after silencing YAP1, (c) Relative quantification of YAP1 protein expression after silencing YAP1, (d and e) CCK-8 assay after silencing YAP1, (f and g) Colony formation assay after silencing YAP1, (h and i) EdU analysis after silencing YAP1, (j) Silencing YAP1 inhibits CMSS1 and RhoA mRNA expression. n = 3, ✶✶P < 0.01, ✶✶✶P < 0.001. CMSS1: Cms1 ribosomal small subunit homolog, YAP1: Yes-associated protein 1, RhoA: Ras homolog family member A, HCC: Hepatocellular carcinoma.
DISCUSSION
During the development of HCC, the pathways of many growth factor receptors or their cytoplasmic intermediates and pathways important for cell differentiation are altered.[12] In human HCC, the genome of the genomic site of YAP is amplified.[13] In addition, the activity of YAP and TAZ increases.[14,15] The structures and functions of YAP and TAZ, two downstream effectors of the Hippo pathway, are identical.[16] Their study showed that the drugs synergistically and complementarily promote cancer progression, and YAP/TAZ may be a target for cancer treatment.[17] In addition, regulation of cytoskeleton and cell adhesion through activation of RhoA GTPase promotes hepatocellular cancer cell movement.[18] Our results also supported this. First, this study found that CMSS1 is overexpressed in HCC. Moreover, CMSS1 promotes the EMT of hepatocellular cancer cells, while silencing CMSS1 inhibits the proliferation and colony-forming ability of hepatocellular cancer cells. Subsequently, by silencing and OE-CMSS1, CMSS1 promotes the proliferation and growth of HCC cells by activating RhoA GTPase/YAP1. The prevention, early detection, and treatment of HCC depend greatly on a thorough understanding of the mechanisms behind its occurrence and progression.[19,20] The role of CMSS1 in promoting the malignant progression of HCC through the activation of the RhoA GTPase/YAP1 signaling pathway was studied. The results of this investigation have significant therapeutic ramifications for understanding the mechanisms underlying HCC and for discovering novel targets and approaches for treatment.
The results revealed the vital role and activation mechanism of CMSS1 in HCC and provided new insights into the occurrence and development of HCC. First, as a potential therapeutic target, CMSS1 can provide new strategies for the treatment of HCC. Inhibiting the expression of CMSS1 or interfering with its interaction with the RhoA GTPase/YAP1 signaling pathway may effectively inhibit the malignant progression of HCC. Second, this study provided new clues for further research on the mechanism of occurrence and development of HCC. Future studies can explore the interaction of CMSS1 with other signaling pathways and its role in the HCC microenvironment to understand the mechanisms of occurrence and development of HCC fully. In addition, further research on the clinical significance of CMSS1, such as analyzing the relationship between CMSS1 in patients with HCC and the clinical characteristics, can evaluate its value as a prognostic indicator. Finally, this study only used HCC experiments and HCC tissues. In future studies, more sample types, such as mouse xenosuppressive tumor models, will be used to prove our conclusions further. In summary, this study provided an important theoretical and practical basis for further research on the mechanism of occurrence and development of HCC and the development of new treatment strategies.
CONCLUSION
This study revealed a novel mechanism of how CMSS1 promotes the malignant progression of HCC through the activation of the RhoA GTPase/YAP1 pathway. Future studies can further investigate the interaction of CMSS1 with other signaling pathways and its role in the HCC microenvironment to provide more information for the treatment and prognosis assessment of HCC.
AVAILABILITY OF DATA AND MATERIALS
The data that support the findings of this study are available from the corresponding author upon reasonable request.
ABBREVIATIONS
CCK-8, cell counting kit-8.
CMSS1, cms1 ribosomal small subunit homolog
DAPI, 4’,6-diamino-2-phenylindole
EdU; 5-ethynyl-2’-deoxyuridine
GEPIA; Gene Expression Profiling Interactive Analysis
GTPase, guanosine triphosphate hydrolases
HCC, hepatocellular carcinoma
mRNA, messenger RNA
PBS, phosphate-buffered saline
PCR, Polymerase Chain Reaction
RhoA, ras homolog family member A
STR, short tandem repeat
YAP1, yes-associated protein 1
AUTHOR CONTRIBUTIONS
YZ: The idea or design of the study; SJY and AYW: Analyzing data and drafting the research paper; BZW and XL: Analysis and interpretation of data. All authors read and approved the final manuscript. All authors have participated sufficiently in the work and agreed to be accountable for all aspects of the work.
ETHICS APPROVAL AND CONSENT TO PARTICIPATE
Ethical approval and consent to participate is not required as this study does not involve animal or human experiments.
CONFLICT OF INTEREST
The authors declare no conflict of interest.
EDITORIAL/PEER REVIEW
To ensure the integrity and highest quality of CytoJournal publications, the review process of this manuscript was conducted under a double-blind model (authors are blinded for reviewers and vice versa) through an automatic online system.
FUNDING
Not applicable.
References
- New advances in the diagnosis and management of hepatocellular carcinoma. BMJ. 2020;371:m3544.
- [CrossRef] [PubMed] [Google Scholar]
- Epidemiology of hepatocellular carcinoma. Hepatology. 2021;73(Suppl 1):4-13.
- [CrossRef] [PubMed] [Google Scholar]
- Advances in immunotherapy for hepatocellular carcinoma. Nat Rev Gastroenterol Hepatol. 2021;18:525-43.
- [CrossRef] [PubMed] [Google Scholar]
- Epidemiology and surveillance for hepatocellular carcinoma: New trends. J Hepatol. 2020;72:250-61.
- [CrossRef] [PubMed] [Google Scholar]
- Prognostic value and gene regulatory network of CMSS1 in hepatocellular carcinoma. Cancer Biomark. 2024;39:361-70.
- [CrossRef] [PubMed] [Google Scholar]
- PLAGL2 promotes bladder cancer progression via RACGAP1/RhoA GTPase/YAP1 signaling. Cell Death Dis. 2023;14:433.
- [CrossRef] [PubMed] [Google Scholar]
- Regulation of RhoA GTPase and novel target proteins for ROCK. Small GTPases. 2020;11:95-102.
- [CrossRef] [PubMed] [Google Scholar]
- SIX4 promotes hepatocellular carcinoma metastasis through upregulating YAP1 and c-MET. Oncogene. 2020;39:7279-95.
- [CrossRef] [PubMed] [Google Scholar]
- Fluid shear stress induces cell migration via RhoA-YAP1-autophagy pathway in liver cancer stem cells. Cell Adh Migr. 2022;16:94-106.
- [CrossRef] [PubMed] [Google Scholar]
- NPFFR2 contributes to the malignancy of hepatocellular carcinoma development by activating RhoA/YAP signaling. Cancers. 2022;14:5850.
- [CrossRef] [PubMed] [Google Scholar]
- MITF promotes cell growth, migration and invasion in clear cell renal cell carcinoma by activating the RhoA/YAP signal pathway. Cancers (Basel). 2021;13:2920.
- [CrossRef] [PubMed] [Google Scholar]
- Signaling pathways in hepatocellular carcinoma. Adv Cancer Res. 2021;149:63-101.
- [CrossRef] [PubMed] [Google Scholar]
- Transforming properties of YAP, a candidate oncogene on the chromosome 11q22 amplicon. Proc Natl Acad Sci U S A. 2006;103:12405-10.
- [CrossRef] [PubMed] [Google Scholar]
- Activation of β-catenin and Yap1 in human hepatoblastoma and induction of hepatocarcinogenesis in mice. Gastroenterology. 2014;147:690-701.
- [CrossRef] [PubMed] [Google Scholar]
- The Ets transcription factor GABP is a component of the hippo pathway essential for growth and antioxidant defense. Cell Rep. 2013;3:1663-77.
- [CrossRef] [PubMed] [Google Scholar]
- Hippo-YAP/TAZ signalling in organ regeneration and regenerative medicine. Nat Rev Mol Cell Biol. 2019;20:211-26.
- [CrossRef] [PubMed] [Google Scholar]
- An imbalance in TAZ and YAP expression in hepatocellular carcinoma confers cancer stem cell-like behaviors contributing to disease progression. Cancer Res. 2015;75:4985-97.
- [CrossRef] [PubMed] [Google Scholar]
- Septin11 promotes hepatocellular carcinoma cell motility by activating RhoA to regulate cytoskeleton and cell adhesion. Cell Death Dis. 2023;14:280.
- [CrossRef] [PubMed] [Google Scholar]
- Hepatocellular carcinoma (HCC) in Egypt: A comprehensive overview. J Egypt Natl Cancer Inst. 2020;32:1-11.
- [CrossRef] [PubMed] [Google Scholar]
- Epidemiology and risk-stratification of NAFLD-associated HCC. J Hepatol. 2021;75:1476-84.
- [CrossRef] [PubMed] [Google Scholar]


