


Translate this page into:
Comparison of FNA-based conventional cytology specimens and digital image analysis in assessment of pancreatic lesions
 MD, Amirhossein Jafarian1MD, Mohammadreza Farzanehfar3MD, Hassan Mehrad Majd4PHD, Alireza Sedghian5BCS, Mansoureh Dehghani6MD

*Corresponding author: Mona Ariamanesh, Department of Pathology, Neyshabur University of Medical Sciences, Neyshabur, Iran. ariamanesh.mona@gmail.com
-
Received: ,
Accepted: ,
How to cite this article: Khozeymeh F, Ariamanesh M, Mohamadian Roshan N, Jafarian A, Farzanehfar M, Mehrad Majd H et al. Comparison of FNA-based conventional cytology specimens and digital image analysis in assessment of pancreatic lesions. CytoJournal 2023;20:39.
Abstract
Objectives:
Endoscopic ultrasound-guided fine-needle aspiration (EUS-FNA) is one of the most important diagnostic tools for investigation of suspected pancreatic masses, although the interpretation of the results is controversial. In recent decades, digital image analysis (DIA) has been considered in pathology. The aim of this study was to assess the DIA in the evaluation of EUS-FNA based cytopathological specimens of pancreatic masses and comparing it with conventional cytology analysis by pathologist.
Material and Methods:
This study was performed using cytological slides related to EUS-FNA samples of pancreatic lesions. The digital images were prepared and then analyzed by ImageJ software. Factors such as perimeter, circularity, area, minimum, maximum, mean, median of gray value, and integrated chromatin density of cell nucleus were extracted by software ImageJ and sensitivity, specificity, and cutoff point were evaluated in the diagnosis of malignant and benign lesions.
Results:
In this retrospective study, 115 cytology samples were examined. Each specimen was reviewed by a pathologist and 150 images were prepared from the benign and malignant lesions and then analyzed by ImageJ software and a cut point was established by SPSS 26. The cutoff points for perimeter, integrated density, and the sum of three factors of perimeter, integrated density, and circularity to differentiate between malignant and benign lesions were reported to be 204.56, 131953, and 24643077, respectively. At this cutting point, the accuracy of estimation is based on the factors of perimeter, integrated density, and the sum of the three factors of perimeter, integrated density, and circularity were 92%, 92%, and 94%, respectively.
Conclusion:
The results of this study showed that digital analysis of images has a high accuracy in diagnosing malignant and benign lesions in the cytology of EUS-FNA in patients with suspected pancreatic malignancy and by obtaining cutoff points by software output factors; digital imaging can be used to differentiate between benign and malignant pancreatic tumors.
Keywords
Endoscopic ultrasound-guided fine needle aspiration
Cytology
Digital image analysis

INTRODUCTION
One of the most advanced methods in assessment of pancreatic lesions is endoscopic ultrasound-guided fine-needle aspiration (EUS-FNA).[1] EUS-FNA is not only the first diagnostic method, but also is often the only step to achieving the diagnosis of pancreatic lesions.[2] It is a rapid, sensitive, specific, and cost-effective method with a minimum rate of side effects.[3,4]
However, on the other hand, there are some disadvantages. In addition to challenges in sampling, diagnostic precision is one of the most important issues of this process. Cytology specimens sometimes could have diminished diagnostic precision, not only due to inadequacy of the sample, but also in terms of determining the exact tumor’s type.[5,6]
Founded in 2009, the digital pathology association is a nonprofit organization of pathologists, scientists, technologists, and industry representatives. This forum addresses the advancements in the field of digital pathology. In the overall workflow of digital pathology and tissue image analysis, the pathologist plays an important role to ensure the value and quality of the data produced.[7]
By introduction of digital pathology, new aspects of its clinical and non-clinical applications in cytopathology studies have been identified every day. Digital image analysis (DIA) enhances cytopathologists’ ability to identify, quantify, and classify the pathology specimens.[8] Formerly, image analysis has mostly been applied to surgical pathology specimens. However, these methods are also applicable to a variety of cytology specimens, such as smears, cell blocks, and other liquid-based samples.[9] Due to the increasing use of DIA in pathology, it is important that specialists in this field get familiar with these methods and related technologies, its applications, and the limitations of this method. The capabilities of this method caused DIA to be used in cytology examinations and the role of these evaluations in the decision-making process becomes more prominent.[10-12]
Quantitative image analysis (QIA)
Some image analysis methods work by quantifying the areas of color reception. The approach used in these processes is often referred to as QIA or computational image analysis. These image algorithms quantify pixels, usually within a region of interest (ROI). Analyzes can be performed on human-selected ROI or automatically performed on whole-slide images. Sophisticated algorithms are even capable of segmenting the selected region to identify the ROI. The results of the investigations carried out regarding image analysis have shown that these investigations have often been associated with similar, repeatable, and in some cases more accurate results than the manual examination of samples.[13] The possible reason for this increase in accuracy is the significant reduction of intra and interobserver disagreements in evaluation by image analysis.
MATERIAL AND METHODS
This retrospective and cross-sectional study was conducted during 2018–2019 in the Pathology Department of Qaem Teaching Hospital affiliated to Mashhad University of Medical Sciences (MUMS) and Mehr Hospital in Mashhad, Iran. The study protocol has been approved on April 4, 2019, in the organizational ethics committee of MUMS by number 5675T and code IR. MUMS. Medical. REC.1399.173. Our study was conducted on archived pathology blocks and smears of the patients and no intervention was performed on patients.
Equipment used
An Olympus CX31 microscope, a 12 megapixel camera, and F1/6–26 mm wide were used to prepare digital images.
ImageJ software was used for image analysis. This software is available for free in both Web-based and Stand-alone forms in the online database https://imagej.nih.gov/ij/download.html and https://imagej.net
Study population
This study was conducted using cytology slides related to pancreatic EUS-FNA samples available in the archive of Pathology Department of Qaem Teaching Hospital and Mehr Hospital of Mashhad. The studied population included cytology slides related to benign and malignant pancreatic lesions.
Inclusion criteria
The following criteria were included in the study:
Age more than 18 years
Suspicion of the pancreatic malignancy (presence of a mass in the patient’s imaging records).
Exclusion criteria
The following criteria were excluded from the study:
Low quality slides
Absence of cell cluster that contains individual cells
Impaired focus on the nucleus
Slides in which nuclear details are not clear for various reasons
Absence of definite diagnosis in the samples.
Cytology slides related to EUS-FNA pancreas samples of patients were extracted from the archive of Pathology Department of Ghaem and Mehr hospitals. Then, every slide was checked for quality and inappropriate ones were removed. Cytology slides were re-examined by a pathologist and evaluated for pathological diagnosis based on Papanicolaou reporting system.
The pathologist’s diagnosis was considered as gold standard
The image preparing consisted of two groups of benign and malignant and not other categories
Collected information including patient profiles, diagnoses, and images of cytology slides was uploaded in access database. The cytology images prepared from the FNA-EUS of the pancreas, which were previously evaluated by the pathologist in terms of being benign or malignant, were re-evaluated by the image processing software (ImagJ). The pictures were taken using a microscope equipped with a digital camera and in magnifications of 10, 20, and 40 with JPEG image format at a resolution of 2000 × 3000 pixels and with a color depth of 24 bits and from several different areas of the slide surface. Finally, the images obtained by 400 magnifications were selected for analysis by the software [Figures 1 and 2].
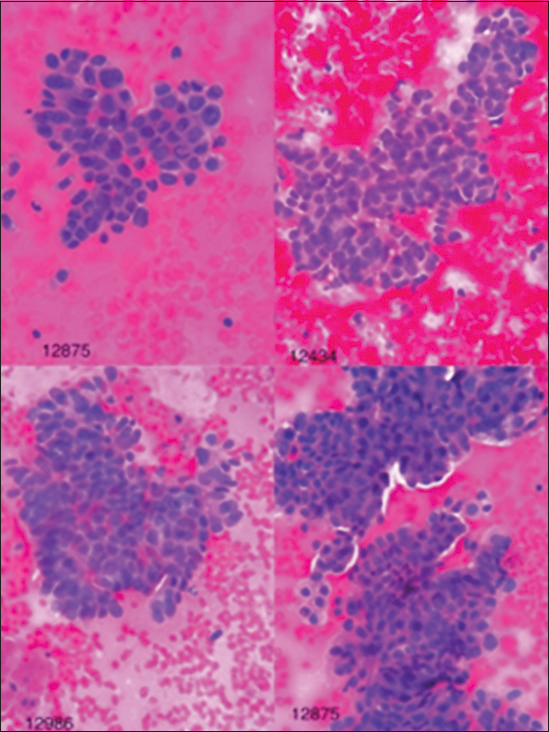
- Images of malignant lesions in hematoxylin and eosin staining with ×40 magnification.
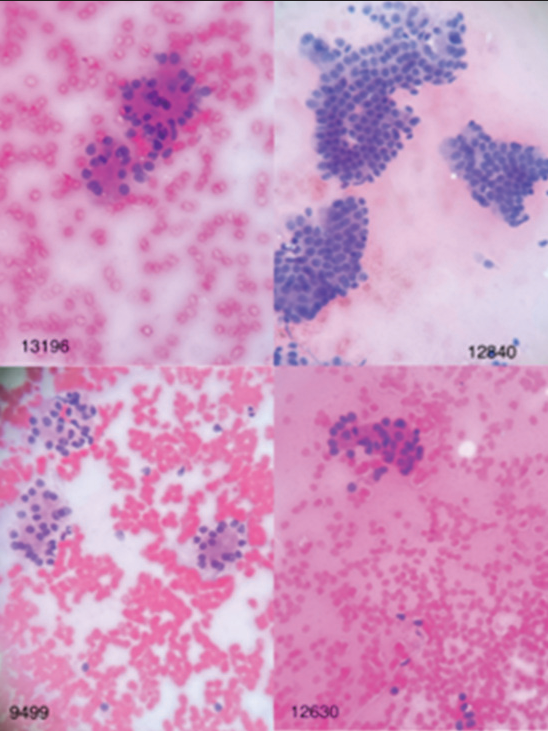
- Images of benign lesions in hematoxylin and eosin staining with ×40 magnification.
Image analysis was performed through software (ImagJ) taking into account the factors of nuclear environment, degree of nuclear roundness, nuclear area, and amount of gray color in the cell (darkness). Furthermore, the integrity of nuclear chromatin density was calculated. It is necessary to explain that the perimeter of the cell nucleus is in pixels, and the more it is, is a sign of a large cell, and the closer the roundness of the nucleus is to one, the more it is a sign of the roundness of the nucleus, and the closer it is to zero, is a sign that the nuclear shape is further away from being round. On the other hand, the area of the cell nucleus is in pixels, and the more it is, the greater the cell surface is, and the closer the gray color of the cell (darkness) is to 255, the more it is a sign of hypochromasia of the cell nucleus, and the closer it is to zero, the sign of hyperchromasia of the cell nucleus. The integrity of nuclear chromatin condensation reflects the state of nuclear size along with its chromasia. The maximum, minimum, and average values for the gray color of the cell (darkness) have also been calculated because different parts of the nucleus may have different chromasia, these values can be helpful and the greater the difference between the maximum and minimum is the sign of chromatin density.
In conventional cytology, the pathologist uses the criteria of nuclear size, nuclear hyperchromasia, and irregular nuclear margin to distinguish between benign and malignant lesions. According to the importance of the criteria mentioned in diagnosis of malignancy in conventional cytology samples, the factors of the nuclear environment, equivalent to the size of the nucleus and the roundness level of the nucleus, equivalent to the irregularity of the cell nucleus margin and the integrity of the chromatin density of the nucleus, and equivalent to level of hyperchromasia were investigated in DIA in our study.
ImageJ software was used for image analysis. The following are the steps of working with this software:
Finding appropriate cell cluster
In this step, we select clusters in which, the cell and nucleus details are clear without artifacts, the cells which are placed separately and do not overlap, and the focus is exactly on the nucleus.
Pre-process
At this stage, the image defects due to insufficient focus, low resolution of the sensor, insufficient optics of lenses, and other factors are corrected.
Segmentation
Before the analytic step, the desired cells are selected so that the software performs the analysis process on that areas.
Image analysis variables extraction step
After selecting the cells, we analyze the image based on the desired variables. Through the mentioned software, the image analysis factors including the circumference of the cell nucleus, the degree of roundness of the nucleus, the area of the cell nucleus, the maximum, minimum, average, and median of the gray color of the cell, the integrity of the chromatin density of the nucleus were used and the results of the image analysis of the samples were compared with the data reported by the pathologist.
Classification stage
In this step, the data extracted in the previous stages were analyzed by SPSS 26 software, Finally, the factors of cell nucleus environment, integrity of nuclear chromatin density, and the third factor, which is the product of the parameters of roundness of the nucleus, cell nucleus environment, and integrity of chromatin density of the nucleus and is presented as “sum of three factors” in statistical analysis and rock curve (ROC) was used. In the analyses of the proposed factors, sensitivity, specificity, accuracy, and cutoff point were determined, and according to the optimal cutoff point determined (above the value of the cutoff point is malignant and below the value is benign), the lesions were divided into two groups of malignant tumors and benign tumors [Figure 3].
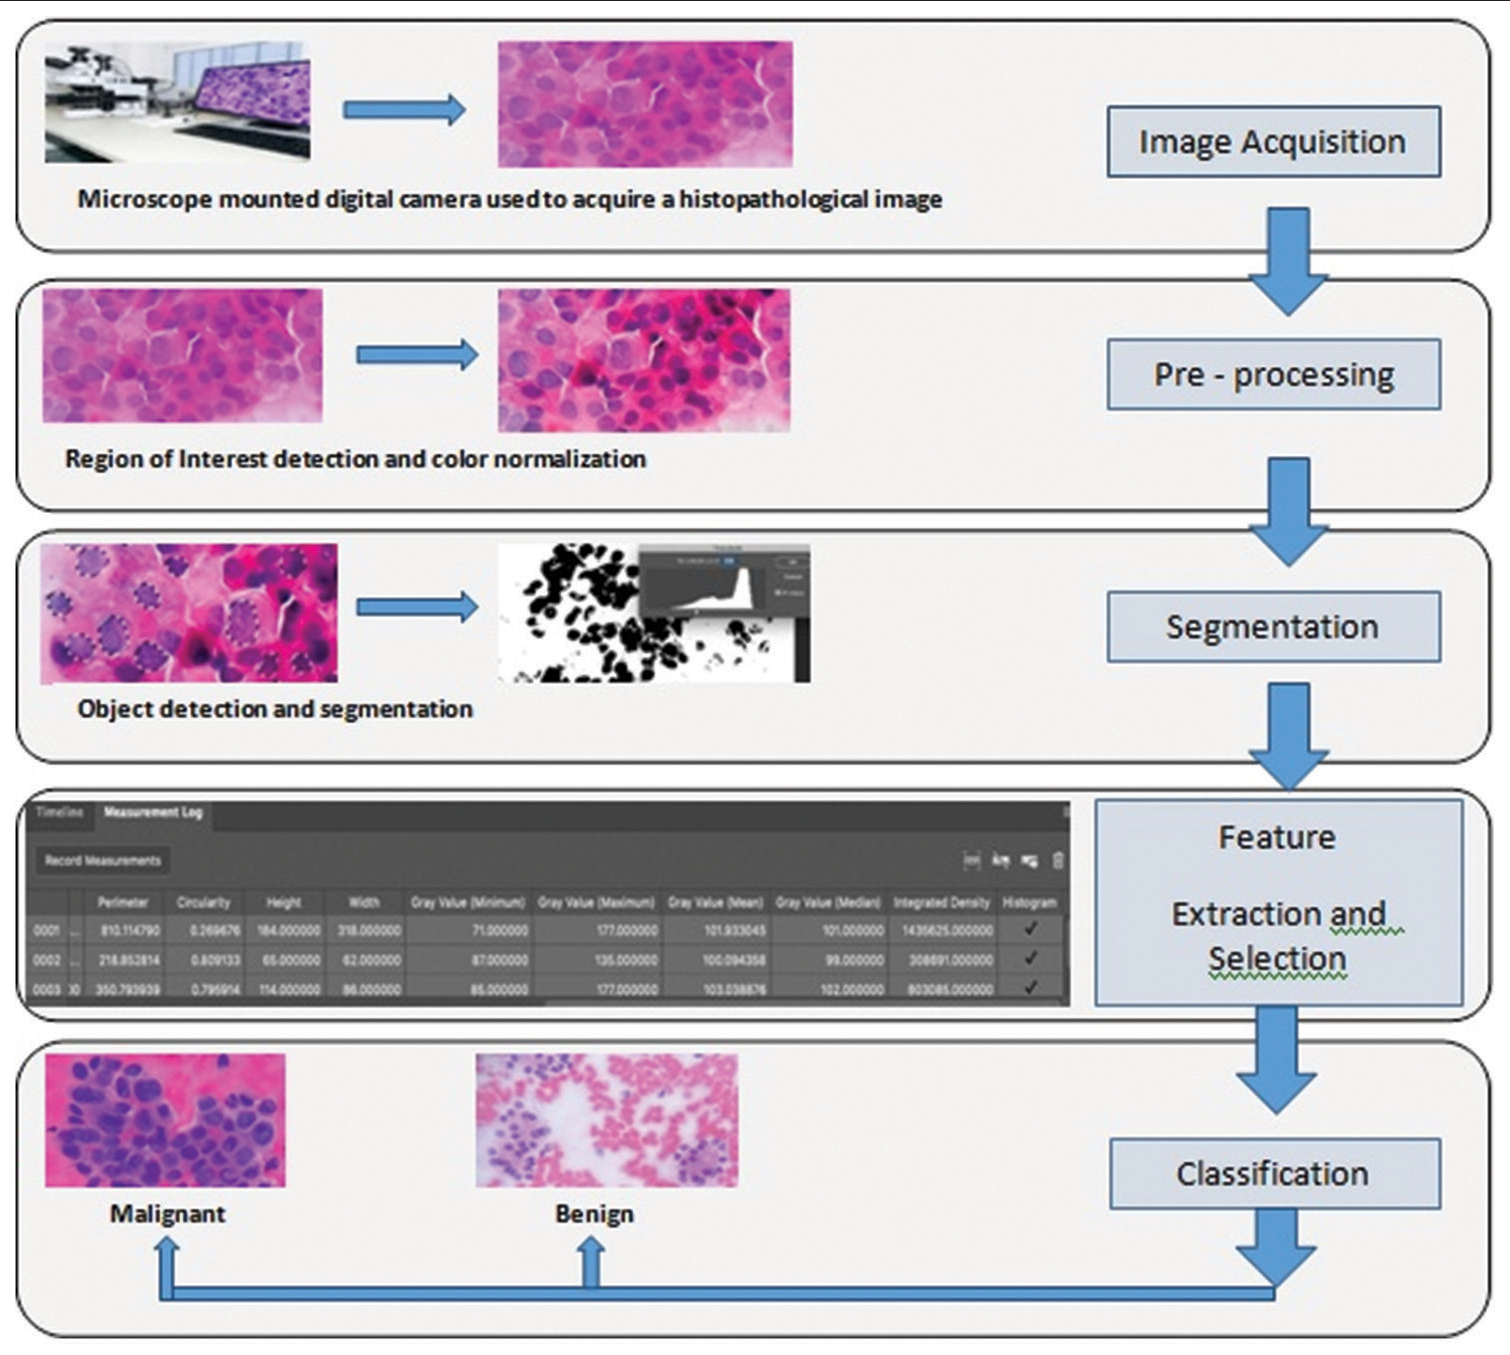
- Schematic image of cytology digital image analysis steps.
RESULTS
In this study, 115 cytology images of patients with pancreatic lesions were examined and diagnosed based on Papanicolaou reporting system, which has been shown in Table 1 in more details.
| Number | Percentage | |
|---|---|---|
| Age (years) | ||
| 1–29 | 5 | 4.7 |
| 30–40 | 7 | 6 |
| 40–50 | 12 | 11.4 |
| 50–60 | 34 | 29.5 |
| 60–70 | 27 | 23.4 |
| 70–80 | 22 | 19.1 |
| 80–90 | 8 | 6.9 |
| Gender | ||
| Male | 64 | 55.6 |
| Female | 51 | 44.4 |
| Diagnostic category | ||
| Non-diagnostic | 4 | 3.5 |
| Negative for malignancy | 27 | 23.5 |
| Atypical | 7 | 6.1 |
| Neoplastic | 16 | 13.9 |
| Suspicious for malignancy | 3 | 2.6 |
| Positive for malignancy | 58 | 50.4 |
In our study, several images of pancreatic tumoral cells prepared from FNA-EUS-based cytology were analyzed, which were previously evaluated by the pathologist, and finally 150 tumoral cells including 60 benign cells and 90 malignant cells were subjected to DIA using ImageJ image processing software. In some malignant samples where there were several types of clusters, image analysis was performed on all different clusters to increase the accuracy. By ImageJ software, the factors of the environment of the cell nucleus, the degree of roundness of the nucleus, the area of the cell nucleus, the amount of gray color of the cell, and the integrity of the chromatin density of the nucleus were measured. The results of data analysis using SPSS 26 software and t-test are presented in Table 2 and analysis with ROC curve is presented in Table 3 and Figure 4.
| Benign (n=63) | Malignant (n=90) | P-value | |
|---|---|---|---|
| Nuclear area | 1515+650 | 2938+1276 | <0.0001 |
| Nuclear environment | 148.33+34.16 | 212.01+45.45 | <0.0001 |
| Nuclear roundness | 0.82+0.03 | 0.79+0.05 | <0.0001 |
| Minimum grayness | 47.5+7.5 | 37.04+13.5 | <0.0001 |
| Maximum grayness | 116.48+19.56 | 119.14+27 | 0.504 |
| Average grayness | 67.25+9.93 | 65.51+19.79 | 0.523 |
| Medium grayness | 64.70 | 63.78 | 0.768 |
| Integrity of chromatin density | 104927+53326 | 201314+125165 | <0.0001 |
| Sum of three factors | 104927+53326 | 201314+125165 | <0.0001 |
| AUC | Variance | P-value | 95% CI (lower limit) | 95% CI (upper limit) | |
|---|---|---|---|---|---|
| Nuclear environmet | 0.876 | 0.027 | <0.0001 | 0.824 | 0.928 |
| Nuclear roundness | 0.261 | 0.040 | <0.0001 | 0.182 | 0.341 |
| Integrity of chromatin density | 0.769 | 0.037 | <0.0001 | 0.696 | 0.842 |
| Sum of three factors | 0.796 | 0.035 | <0.0001 | 0.728 | 0.865 |
ROC: Receiver operating characteristic, AUC: Area under the curve, CI: Confidence interval
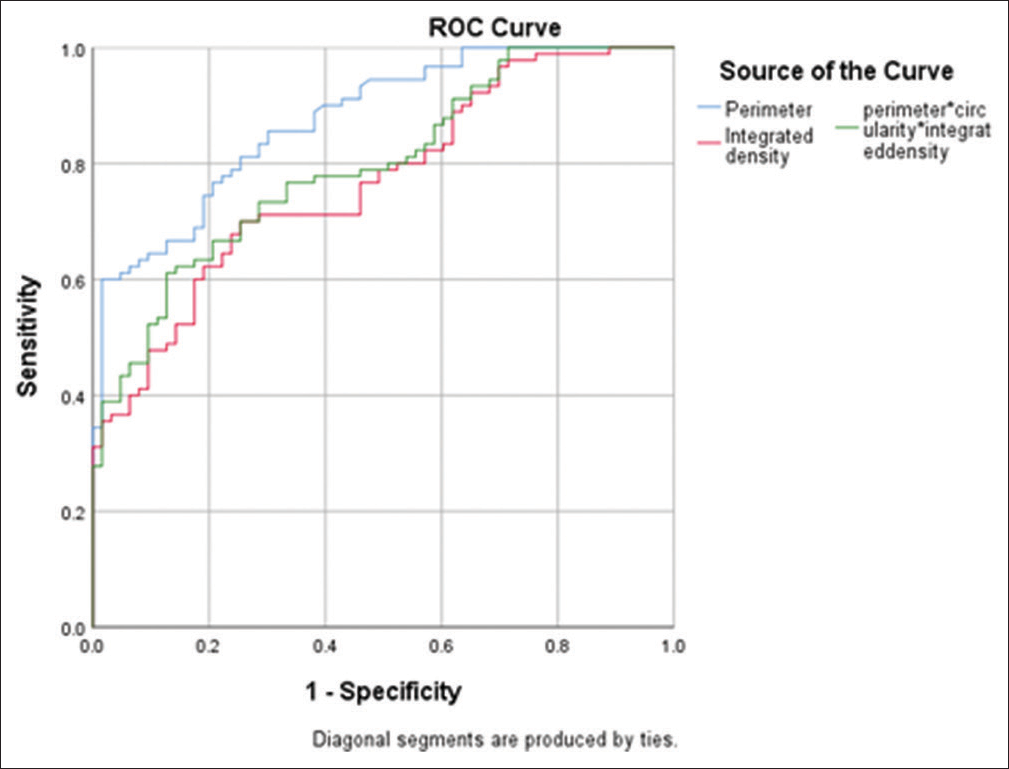
- Receiver operating characteristic curve in examining the cell nucleus environment, integrity of nuclear chromatin density and sum of three factors.
Then, the cut point for each of the studied factors was calculated by SPSS 26. According to Table 4, the cutoff point for cell nucleus circumference, nuclear chromatin density integrity, and the sum of three factors “cell nuclear periphery, nuclear roundness, and nuclear chromatin density integrity” to distinguish between benign and malignant lesions are 204/56, 131953, and 24643077, respectively. The sensitivity level for the mentioned parameters is 60, 70, and 61%, respectively, the specificity level is 98%, 75%, and 87%, respectively, and the accuracy level is 75%, 71%, and 71%, respectively, which poses sufficient power to distinguish benign and malignant lesions in FNA-EUS-based cytology images of pancreatic lesions.
| Variable | Cutoff point | Sensitivity (95% CI) | Specificity (95% CI) | Accuracy |
|---|---|---|---|---|
| Cell nucleus environment | 204.56 | 0.6 (0.497–0.695) | 0.984 (0.906–1) | 0.758 |
| Integrity of chromatin condensation | 131953 | 0.7 (0.598–0.785) | 0.746 (0.625–0.837) | 0.719 |
| Sum of three factors | 24643077 | 0.6 (0.508–0.705) | 0.873 (0.765–0.936) | 0.719 |
CI: Confidence interval
At the end, to testing the obtained results based on the three mentioned factors, 50 random samples (between the benign and malignant samples) diagnosed by the pathologist were used. According to Table 5, the results showed that the concordance between the pathologist’s diagnosis and the use of the cutoff point for the factors of cell nucleus environment, integrity of nuclear chromatin density and the sum of three factors “cell nucleus environment, degree of roundness of nucleus and integrity of nuclear chromatin density” are 92%, 92%, and 94%, respectively [Table 5 and Figure 5].
| Type of lesion | Pathologist’s diagnosis | The degree of agreement based on the cutting point of the cell nucleus environment with the pathologist’s opinion | The degree of agreement based on the integrity of nuclear chromatin chromatin density with the pathologist’s opinion | The degree of agreement based on sum of three factors with the pathologist’s opinion |
|---|---|---|---|---|
| Malignant | 30 | 27 | 28 | 28 |
| Benign | 20 | 19 | 18 | 19 |
| Agreement number | 50 | 46 | 46 | 47 |
| Agreement percentage | 92 | 92 | 94 |

- An algorithmic figure demonstrating a summary.
DISCUSSION
In this study, 115 cytology-based images were examined. After drawing the ROC curve using the data of the effective factors, a cutoff point was applied for each factor. The cutoff point for cell nuclear environment, nuclear chromatin density integrity and the sum of three factors of cell nuclear environment, nuclear roundness and nuclear chromatin density integrity for differentiating between benign and malignant lesions were reported as 204.56, 131953, and 24643077, respectively. The degree of concordance between the pathologist’s diagnosis and the use of the cut point of the factors of cell nucleus environment, nuclear chromatin density integrity, and the sum of three factors was 92%, 92%, and 94%, respectively, which indicates a high rate of concordance.
As we already know, despite the efficiency of EUS-FNA samples in the evaluation of pancreatic lesions, there are still some problems that make it difficult to make a definitive decision for patients in terms of intra and interobserver agreement (IOA). Mounzer et al. showed that the IOA for evaluating samples from EUS-FNA of patients with solid pancreatic lesions by four different cytopathologists was average, and therefore, a definitive diagnosis requires matching the pathological findings with the clinical findings.[14] These findings were also reported in the study of Marshall et al.[15] One of the methods that may be associated with the improvement of IOA is the use of DIA, which has been used in various aspects of pathology. DIA helps quantify formerly unmeasurable contents, and there for reducing disagreements and diagnostic errors. The results of the studies conducted on image analysis have shown that these studies have often been associated with similar, repeatable, and in some cases more accurate results than manual examination of samples.[13] Pantanowitz et al. first reviewed the role of digital imaging in cytopathology in 2009.[16] They described telecytology (examination of cytology samples by a remote pathologist), virtual microscopy (or whole-slide imaging), computerized Pap test screening for cervical cancer, online cytology, and cytometry performed on digital images.
The authors also concluded that automation is a crucial need, especially in the field of cytology, where expert technicians are not easily accessible and the workload is usually heavy. Since then, use of digital images for cytology examinations has developed in multiple aspects including implementation of quantitative analyzing and automated software, yet it is not routinely adopted by paraclinicians due to lack of access, complexity, and heterogeneity in criteria.[17,18] As noted by Montironi et al., the COVID-19 pandemic has accelerated the need for and application of digital pathology.[19] According to a study on the current state of digital cytopathology by Yao et al. in 2022, DIA was first used for cervical cancer screening.[20] Apart from Pap smears, this study highlights that this technique is used to check biomarkers, including the Ki-67 index in pancreatic cytological samples suspected of neuroendocrine tumors.[20,21] However, recently, a few studies have been conducted on the use of this method in diagnosing thyroid tumors based on cytological samples.[22,23] In most cases, the image analysis systems that have been used so far do not give the final diagnosis alone, but rather help the pathologist to speed up and facilitate the diagnosis.[20]
In one of the few studies conducted regarding the use of DIA in ESU-FNA pancreatic cytology examination, by Kong et al., by examining 142 patients suspected of pancreatic malignancy who underwent ESU-FNA, they demonstrated that the sensitivity of conventional examination, image analysis, and use of both in examining malignant lesions was 75%, 84%, and 92%, respectively, whereas the specificity was 85%, 80%, and 85%. Hence, it seems like the image analytic method, we have used was less sensitive comparing with using spectrophotometric principles. Furthermore, in patients diagnosed with adenocarcinoma, the sensitivity of conventional examination, image analysis, and the use of both were 84, 92, and 77%, respectively.[5] In their study, the digital analysis of images was done using spectrophotometric principles by examining deoxyribonucleic acid (DNA) content, chromatin distribution and nuclear shape, and Landing Medical High-Tech was the system used for image analysis, whereas, in the present study, the digital analysis of the images by ImageJ software and based on the measurement of the factors of the environment of the cell nucleus, the degree of roundness of the nucleus, the area of the cell nucleus, the maximum, minimum, average and median amount of the gray color of the cell, the integrity of the chromatin density of the nucleus that the multiplication of the cell surface was done in medium gray color (darkness). Web-based application was also used in another study which resulted high accuracy and sensitivity but low sensitivity.[24]
Other studies conducted in this field are related to the use of artificial intelligence in combination by other patient’s information, such as tumor markers serum level, imaging, and pathology information.
In a study performed by Levy et al., samples from 250 patients with suspected pancreatic malignancy, were examined using conventional cytology, DIA, or fluorescence in situ hybridization evaluation method, and the diagnostic value of each of these approaches was evaluated. In that study, samples with a maximum of 50 cells were examined by CAS 200 image analysis software in terms of optical density and the DNA ploidy status and malignancy was described based on the presence of a cell population colony in the histogram beyond the DNA index equal to 1.10. The sensitivity, specificity, positive predictive value, negative predictive value, and accuracy of DIA were 54, 94, 97, 46, and 69%, respectively, and totally its sensitivity and accuracy were significantly lower than conventional and fluorescence in situ hybridization (FISH) methods.[25] In another study of Levy et al., 39 patients suspected of pancreatic malignancy were examined using conventional cytology, DIA and FISH, and the diagnostic value of each approach was evaluated. For image analysis, samples with 50 cells with maximum nuclear atypia had been selected and analyzed by CAS 200 image analysis software. The results of DIA with FISH in examining malignant lesions had shown that its sensitivity, specificity, and accuracy were 97%, 100%, and 98%, respectively, which was significantly better than conventional examination.[26] Hence, it had shown using DIA in combination with other information could be much more sensitive and specific. This was also confirmed by the study of Kurita et al., in which the diagnostic value of artificial intelligence was investigated using deep learning analysis of cyst fluid cytology images in differentiating between benign and malignant pancreatic lesions. In designing that artificial intelligence, in addition to cytology characteristics, the information of serum markers cancer antigen 19-9 and carcinoembryonic antigen (CEA) as well as imaging information was also been used. By examining the data of 85 patients, it was found that the diagnostic value of artificial intelligence in predicting malignancy is very high with area under the curve equal to 0.966. Furthermore, the sensitivity, specificity, and accuracy of artificial intelligence in diagnosing malignant pancreatic lesions are 95.7%, 91.9%, and 92.9%, respectively, which proved the more efficiency of DIA when combined by paraclininical patients’ data.[9]
SUMMARY
Results of the present study demonstrated that the digital analysis of images has high accuracy in diagnosing malignant and benign lesions in the examination of cytology obtained from EUS-FNA in people suspected of pancreatic malignancy. Furthermore, by obtaining the cut point of the output factors of the DIA software, it is possible to differentiate between benign and malignant tumors of the pancreas.
Suggestions
In future studies, the cytology results obtained from the sampling could be analyzed simultaneously with digital analysis
It is also suggested that in future studies, validation of the results of digital analysis of images should be done to apply its results.
COMPETING INTEREST STATEMENT BY ALL AUTHORS
None of the authors have any conflicts of interest.
AUTHORSHIP STATEMENT BY ALL AUTHORS
Study concept and design, FK and NMR; Data collection, FK, MA, MD; Analysis and interpretation of data, AJ,AS, HMM; Drafting of the manuscript, MA and FK; Critical revision of the manuscript for important intellectual content, NMR, MF, AJ; Statistical analysis HMM. Preparation of article images, MD and MA. Computer software work, AS. Specimens, MF.
ETHICS STATEMENT BY ALL AUTHORS
The study design was approved by the Ethics Committee of Mashhad University of Medical Sciences (approval code:IR. MUMS.fm.REC.1399.173). The study was performed on archival pathological blocks and smears, and no patient intervention was performed.
LIST OF ABBREVIATIONS (IN ALPHABETIC ORDER)
CEA - Carcinoembryonic antigen
DIA - Digital image analysis
DNA - Deoxyribonucleic acid
EUS-FNA - Endoscopic ultrasound-guided fine-needle aspiration
FISH - Fluorescence in situ hybridization
IOA - Interobserver agreement
MUMS - Mashhad University of Medical Sciences
QIA - Quantitative image analysis
ROC - Rock curve
ROI - Region of interest
EDITORIAL/PEERREVIEW STATEMENT
To ensure the integrity and highest quality of CytoJournal publications, the review process of this manuscript was conducted under a double-blind model (the authors are blinded for reviewers and vice versa) through automatic online system.
References
- Endoscopic ultrasound-guided fine needle aspiration: From the past to the future. Endosc Ultrasound. 2013;2:77-85.
- [CrossRef] [PubMed] [Google Scholar]
- Computer-assisted cytologic diagnosis in pancreatic FNA: An application of neural networks to image analysis. Cancer Cytopathol. 2017;125:926-33.
- [CrossRef] [PubMed] [Google Scholar]
- Endoscopic ultrasonography with fine-needle aspiration for histological diagnosis of solid pancreatic masses: A meta-analysis of diagnostic accuracy studies. BMC Gastroenterol. 2016;16:108.
- [CrossRef] [PubMed] [Google Scholar]
- The usefulness of liquid-based cytology for endoscopic ultrasound-guided tissue acquisition of solid pancreatic masses. Front Med. 2022;9:943792.
- [CrossRef] [PubMed] [Google Scholar]
- A prospective comparison of conventional cytology and digital image analysis for the identification of pancreatic malignancy in patients undergoing EUS-FNA. Endosc Ultrasound. 2019;8:269-76.
- [CrossRef] [PubMed] [Google Scholar]
- Diagnostic challenges in the gray-zone lesions of fine-needle aspiration cytology. CytoJournal. 2021;18:23.
- [CrossRef] [PubMed] [Google Scholar]
- Digital images and the future of digital pathology. J Pathol Inform. 2010;1:15.
- [CrossRef] [PubMed] [Google Scholar]
- Utility of CD8 score by automated quantitative image analysis in head and neck squamous cell carcinoma. Oral Oncol. 2018;86:278-87.
- [CrossRef] [PubMed] [Google Scholar]
- Diagnostic ability of artificial intelligence using deep learning analysis of cyst fluid in differentiating malignant from benign pancreatic cystic lesions. Sci Rep. 2019;9:6893.
- [CrossRef] [PubMed] [Google Scholar]
- Image analysis of HER2 immunohistochemical staining: Reproducibility and concordance with fluorescence in situ hybridization of a laboratory-validated scoring technique. Am J Clin Pathol. 2012;137:270-6.
- [CrossRef] [PubMed] [Google Scholar]
- Digital image analysis outperforms manual biomarker assessment in breast cancer. Mod Pathol. 2016;29:318-29.
- [CrossRef] [PubMed] [Google Scholar]
- Interobserver agreement among cytopathologists in the evaluation of pancreatic endoscopic ultrasound-guided fine needle aspiration cytology specimens. Endosc Int Open. 2016;4:E812-9.
- [CrossRef] [PubMed] [Google Scholar]
- Suboptimal agreement among cytopathologists in diagnosis of malignancy based on endoscopic ultrasound needle aspirates of solid pancreatic lesions: A validation study. Clin Gastroenterol Hepatol. 2018;16:1114-22.e2.
- [CrossRef] [PubMed] [Google Scholar]
- The impact of digital imaging in the field of cytopathology. Cytojournal. 2009;6:6.
- [CrossRef] [PubMed] [Google Scholar]
- Developing image analysis methods for digital pathology. J Pathol. 2022;257:391-402.
- [CrossRef] [PubMed] [Google Scholar]
- Relevance of the College of American Pathologists guideline for validating whole slide imaging for diagnostic purposes to cytopathology. Cytopathology. 2023;34:5-14.
- [CrossRef] [PubMed] [Google Scholar]
- Lesson from the COVID-19 pandemic: Pathologists need to build their confidence on working in a digital microscopy environment. Virchows Archiv. 2021;479:227-9.
- [CrossRef] [PubMed] [Google Scholar]
- Current applications and challenges of digital pathology in cytopathology. Hum Pathol Rep. 2022;28:300634.
- [CrossRef] [Google Scholar]
- Accuracy of grading pancreatic neuroendocrine neoplasms with Ki-67 index in fine-needle aspiration cellblock material. Cytopathology. 2019;30:187-93.
- [CrossRef] [PubMed] [Google Scholar]
- Impact of image analysis and artificial intelligence in thyroid pathology, with particular reference to cytological aspects. Cytopathology. 2020;31:432-44.
- [CrossRef] [PubMed] [Google Scholar]
- Computer-assisted image analysis of cytological specimens clarify the correlation between nuclear size and intranuclear cytoplasmic inclusions regardless of BRAFV600E mutation in papillary thyroid carcinoma. Cytopathology. 2021;32:718-31.
- [CrossRef] [PubMed] [Google Scholar]
- Accuracy of digital image analysis (DIA) of borderline human epidermal growth factor receptor (HER2) immunohistochemistry in invasive ductal carcinoma. Int J Cancer Manag. 2020;13:e101179.
- [CrossRef] [Google Scholar]
- Comparison of methods to detect neoplasia in patients undergoing endoscopic ultrasound-guided fine-needle aspiration. Gastroenterology. 2012;142:1112-21.e2.
- [CrossRef] [PubMed] [Google Scholar]
- Preliminary experience comparing routine cytology results with the composite results of digital image analysis and fluorescence in situ hybridization in patients undergoing EUS-guided FNA. Gastrointest Endosc. 2007;66:483-90.
- [CrossRef] [PubMed] [Google Scholar]