


Translate this page into:
Computer-assisted scatter plot analysis of cell and nuclear areas distinguishes urothelial carcinoma in urine cytology specimens
 MD, PhD, Kazuhiro Suzuki3MD, PhD, Masanao Saio1,MD, PhD

*Corresponding author: Masanao Saio, Laboratory of Histopathology and Cytopathology, Department of Laboratory Sciences, Gunma University Graduate School of Health Sciences, Japan saio@gunma-u.ac.jp
-
Received: ,
Accepted: ,
How to cite this article: Hoshino C, Kobayashi S, Nishijima Y, Arai S, Suzuki K, Saio M. Computer-assisted scatter plot analysis of cell and nuclear areas distinguishes urothelial carcinoma in urine cytology specimens. CytoJournal. 2025;22:12. doi: 10.25259/Cytojournal_213_2024
Abstract
Objective:
Image analysis in urine cytology typically focuses on individual cells, particularly nuclear features. This study aimed to analyze non-tumor and urothelial carcinoma cases by examining scatter plots of cell or cell cluster areas and the maximum nuclear area within them.
Material and Methods:
The study included 192 cases: 52 negative and 140 positive. Whole slide images were generated using a virtual slide scanner, and image analysis was conducted with cytological analysis software. Scatter plots were created for cells/cell cluster areas and the largest connected nuclear areas (scatter plot for cells/cell cluster), as well as for nuclear area and perimeter (scatter plot for nucleus).
Results:
In the scatter plot for the nucleus, significant differences were noted between cytology-negative and cytology-positive groups (P = 0.0134). However, when divided into cytology-negative, non-invasive, and invasive groups, a significant difference was only found between negative and non-invasive groups (P = 0.0281), not between negative and invasive groups (P = 0.1266). In the scatter plot for cell/cell cluster, plotting cell cluster area (X-axis) and maximum nuclear area (Y-axis) revealed three distribution patterns: horizontal (X-axis), vertical (Y-axis), and diagonal. Cytology-negative cases mainly showed horizontal patterns, while cytology-positive cases exhibited vertical patterns. In the non-tumor group, horizontal patterns were dominant, while vertical patterns were common in non-invasive and invasive tumor groups. The pTa low-grade group mainly showed diagonal patterns, whereas the pTa high-grade, pTis, and pTis + pTa groups predominantly showed vertical patterns. The percentage of cell/cell clusters in tumor-rich areas (along with Y-axis) was significantly higher in non-invasive and invasive tumors compared to non-tumor cases (P < 0.0001), although lower in invasive tumors compared to non-invasive ones (P = 0.0299). In addition, neutrophil-rich images were significantly more common in stromal and muscle invasion groups than in non-invasion groups.
Conclusion:
In urine cytology, cellular overlap and cluster density were key factors for distinguishing malignant from benign cells. This image analysis algorithm was useful in identifying malignant clusters with large, connected nuclear regions. The algorithm could potentially detect both invasive and early-stage tumors, highlighting the need for further development of such tools for routine diagnosis.
Keywords
Computer-assisted image analysis
Cytology
Papanicolaou staining
Urine
Urothelial carcinoma

INTRODUCTION
Urine cytology is a simple, non-invasive test commonly used for the early detection of urothelial malignancies and for monitoring patients following urothelial carcinoma surgery.[1,2] While urine cytology typically has high specificity, its sensitivity is often low.[3] Reported sensitivity rates are 77% for muscle-invasive urothelial carcinoma, 59% for high-grade non-muscle-invasive urothelial carcinoma, and 33% for low-grade non-muscle-invasive urothelial carcinoma.[4] For noninvasive cancers, especially pTa lesions, cytology sensitivity remains low.[5] As a result, despite significant differences in treatment approaches between non-invasive and invasive carcinomas,[2] their diagnosis currently relies on histological evaluation.
In recent years, image analysis and machine learning have been increasingly used to differentiate normal urothelial cells from high-grade urothelial carcinoma (HGUC)[6] and to identify high-grade and atypical urothelial cells in urine cytology specimens.[7] These methods have also been applied to assess the risk of urothelial carcinoma recurrence based on nuclear morphology in histological specimens[8] and to predict recurrence in non-muscle-invasive urothelial carcinoma by combining clinical and histological data.[9] Many studies have emphasized nuclear morphology, particularly nuclear area, perimeter, maximum diameter, and minimum diameter. Sakumo et al. reported that the nuclear area and the nuclear-cytoplasmic (N/C) ratio could help distinguish reactive urothelial cells and reactive tubular epithelial cells from HGUC.[10] Yamamoto et al. examined non-invasive follicular thyroid neoplasm with papillary-like nuclear features (NIFTP), follicular carcinoma, and papillary thyroid carcinoma follicular subtype using parameters such as nuclear area and perimeter.[11] Unlike image analysis, routine cytological evaluation by human experts also considers cell clusters for cellular overlap, density, and loose cell adhesion, in addition to nuclear morphology.[12,13] There is a disparity between the indices used in image analysis and those employed by human evaluators. Only one study by Levy et al. has focused on analyzing cell clusters in cytological specimens, where they developed an automated tool for evaluating urothelial cell clusters.[14]
In this study, we explored the potential of incorporating “overlapping of cell clusters” and “cell density within clusters” into the image analysis algorithm. Using urine cytology, we visualized these features as scatter plots showing the area of cell clusters and the maximum connected nuclear area within them.
MATERIAL AND METHODS
Samples
This study was approved by the Ethical Review Committee for Medical Research Involving Human Subjects at Gunma University. A total of 192 urine cytology cases were included, consisting of 52 negative and 140 positive cases examined at Gunma University Hospital between January 01, 2011, and December 31, 2022. The sample collection methods included 164 voided urine samples (44 negative and 120 positive), 26 catheter urine samples (eight negative and 18 positive), and two bladder-washing urine samples (two positive). The negative cases included samples from nonneoplastic conditions or follow-up cases after transurethral resection of bladder tumors, collectively referred to as the negative group. The “malignant group” consisted of samples cytologically diagnosed as malignant due to clear cytological atypia or as “fairly conclusive of malignant” with a small number of clearly atypical cells. The “suspicious group” included cases with weak cellular atypia, diagnosed as “suspicious of malignancy.” The “positive group” comprised both the malignant and suspicious groups. For positive group selection, only cases confirmed as urothelial carcinoma through histopathological diagnosis through transurethral resection of bladder tumor (TURBT) or surgical bladder resection within 3 months of the cytological diagnosis were included in the study. Papanicolaou-stained specimens used for routine diagnostic purposes were analyzed in this study.
Ethical approval and research consent for secondary use of existing samples
The study was conducted in compliance with the World Medical Association Declaration of Helsinki, as revised in 2013.[15] It was approved by the Ethics Committee of Gunma University School of Medicine (approval no: HS2023-085). The requirement for informed consent was waived in accordance with the Ethics Guidelines for Medical and Health Research Involving Human Subjects set by the Japanese government (the Ministry of Education, Culture, Sports, Science, and Technology and the Ministry of Health, Labor, and Welfare). However, the purpose of the sample use was publicly disclosed to participants on the Gunma University Hospital website, and participants were provided with the opportunity to opt out, as per the aforementioned Ethics Guidelines.
Papanicolaou staining
The specimens were stained using the Tissue-Tek Prisma Plus Automated Slide Stainer (Sakura Finetek Japan Co., Ltd., Chuo-ku, Tokyo, Japan). The staining process was carried out as follows. The specimens were soaked in 70% ethanol for 30 s; followed by 50% ethanol for 30 s; distilled water for 30 s; Gill’s Hematoxylin IV (Sakura Finetek Japan Co., Ltd.) for 90 s; distilled water for 30 s; 0.5% HCl-70% ethanol for 30 s; distilled water for 5 min; 70%, 80%, and 95% ethanol consecutively for 30 s each; OG-6 (Muto Pure Chemicals Co. Ltd., Bunkyo-ku, Tokyo, Japan) for 5 min; 95% ethanol for 15 s; 0.5% 12 Tungusto (VI) phosphoric acid n-hydrate (FUJIFILM Wako Chemicals, Chuo-ku, Osaka, Japan), 0.5% acetic acid, and 95% ethanol for 30 s; 95% ethanol for 15 s; EA-50 (Muto Pure Chemicals Co. Ltd.) for 5 min; 95% ethanol for 30 s, followed by another 60 s; 100% ethanol for 60 s 4 times; and xylene for 60 s 3 times. Finally, the specimens were mounted.
Scanning images
Papanicolaou-stained specimens were scanned as whole slide images (WSI) at ×40 magnification using a virtual slide scanner (NanoZoomer-SQ Digital slide scanner, Hamamatsu Photonics, Hamamatsu, Japan). The NanoZoomer settings were observation lens at ×20, resolution of 0.75, scan mode at ×40, maximum capture size of 26 × 76 mm, pixel size of 0.23 μm/pixel, light source from a light-emitting diode, image storage format as joint photographic experts group, and focus mode set to manual. For each case, at least 1 cm × 1 cm of the stained specimen was captured.
Image analysis
Image analysis was conducted using virtual slide cytological image analysis software (e-Cyto2 V2.1, e-Path Co. Ltd., Japan). The virtual slide images were captured in VS-Auto mode at 0.23 μm/pixel and ×40 magnification. For the analysis, one or up to nine random areas of 0.2 cm × 0.15 cm within the WSI were selected to ensure at least 1000 nuclear areas were analyzed. Data were collected separately based on color tone: light green, eosin, and orange G. Since urothelial cells predominantly stained light green, the WSI was analyzed under the light green tone condition for each case. The analysis settings are summarized in Supplemental Table 1. The analysis provided the following data: The area of the cell or cell clusters (cell/cell cluster), the maximum nuclear area identified by the color tone of the nucleus within the cell/cell cluster, the ratio of the maximum nuclear area to the cell/cell cluster area, the total nuclear area when multiple nuclei were present, the ratio of the total nuclear area to the cell/cell cluster area, the number of nuclei within the cell/cell cluster, and the average nuclear area (if there were multiple nuclei). In addition, the nuclear area and perimeter were measured for further analysis. Alongside this data, the following metrics were also collected: nuclear circularity, long and short axes of the nucleus, long–short axis ratio, maximum and minimum nuclear diameters, average nuclear diameter, nuclear staining density, cluster circumference, cluster circularity, long and short axes of the cluster, long– short axis of the cluster, maximum and minimum cluster diameters, average cluster diameter, and cluster staining density. These data were saved as numerical values in Excel format for evaluation and further analysis.
Data evaluation and analysis
Scatter plots were generated from the collected data using the Excel chart function. The independent cell/cell cluster area data were plotted on the X-axis, while the maximum nuclear area for each cell/cell cluster was plotted on the Y-axis (scatter plot for cell/cell cluster). To assess the percentage of tumor cells/clusters within the total cell/cell cluster area, we examined the percentage of cells/clusters in the scatter plot area with cell/cell cluster areas of <2000 μm2 and maximum nuclear areas of >75 μm2. For nuclear analysis, a scatter plot was created for nuclear area and perimeter across all nuclear regions (scatter plot for nucleus), and the percentage of tumor cell nuclei-rich areas in the total area was determined by considering those with nuclear areas above 350 μm2 and nuclear perimeters over 100 μm.
Statistical analysis
Statistical analysis was conducted using JMP Pro version 17.2.0 software (SAS Japan, Tokyo, Japan). Pearson’s Chi-square test was employed to compare frequencies, Fisher’s exact test was used for 2-row × 2-column cross-tabulation, Dunnett’s test was utilized for comparing means within the control group, and Tukey–Kramer’s honestly significant difference test was applied to compare means across all groups. The positive rates for the high nuclear area and perimeter in the total cell nuclei, as well as the positive rates for the largest nuclear area within a high cell/cell aggregate-distributed area, were analyzed using Dunnett’s test and Tukey–Kramer’s honestly significant difference test. The comparison of scatter plot patterns was analyzed using Pearson’s Chi-square test. A confusion matrix showing the relationship between background neutrophil infiltration and tumor invasion depth was analyzed using Fisher’s exact test. A statistically significant difference was set at P = 0.05 or less.
RESULTS
Scatter plots of the morphology of the nuclear areas and nuclear perimeters were ineffective in distinguishing tumor samples from non-tumor samples in urinary cytology specimens
Table 1 presents the clinicopathological characteristics of the cases included in this study, while Table 2 details the clinical main complaints or diagnoses for the cytology-negative cases. The scatter plots for the nuclear area and nuclear perimeter were generated because these metrics are commonly used in the image analysis of cytological specimens.[10,16] The scatter plot for the nucleus was compared between the cytology-negative and cytology-positive groups [Figure 1]. The percentage of nuclei in the tumor-rich areas was significantly higher in the cytology-positive group compared to the negative group (P = 0.0134). When the positive group was divided into non-invasive and invasive tumor groups, a significant difference was observed between the non-tumor and noninvasive tumor groups (P = 0.0281). However, no significant difference was found between the non-tumor and invasive tumor groups (P = 0.1266). These findings indicate that while it is possible to distinguish between the cytology-negative and cytology-positive groups using the scatter plot for the nucleus, this method is not robust, as it fails to distinguish between the invasive tumor group and the non-tumor group.
| Cases (n=192) | Cytological diagnosis | ||||
|---|---|---|---|---|---|
| Negative | Suspicious | Positive | |||
| Negative | 52 | 52 (100) | |||
| Stage | |||||
| Muscle invasion (−) | pTa (low grade) | 4 | 1 (25) | 3 (75) | |
| pTa (high grade) | 15 | 6 (40) | 9 (60) | ||
| pTis | 21 | 7 (33) | 14 (67) | ||
| pTa+pTis | 15 | 6 (40) | 9 (60) | ||
| pT1 | 41 | 10 (24) | 31 (76) | ||
| Muscle invasion (+) | pT2 | 31 | 10 (32) | 21 (68) | |
| pT3 | 9 | 3 (33) | 6 (67) | ||
| pT4 | 4 | 1 (25) | 3 (75) |
The numbers outside the brackets indicate the number of cases, and the numbers inside the brackets indicate the proportion of cases in the row direction
| Main clinical complaints or diagnoses | Breakdown |
|---|---|
| No tumor history | 33 |
| Hematuria alone | 14 |
| Hydronephrosis | 5 |
| After kidney transplantation | 4 |
| Prostatic hyperplasia+hematuria | 3 |
| Overactive bladder | 1 |
| Essential thrombocytosis+hematuria | 1 |
| Frequent urination | 1 |
| Hemorrhagic cystitis+hematuria | 1 |
| Pyuria+overactive bladder | 1 |
| Chronic renal failure+pyonephrosis | 1 |
| Amyloidosis+hematuria | 1 |
| Tumor history | 19 |
| Suspected bladder cancer | 6 |
| Prostate cancer follow-up | 5 |
| Suspicious of ureteric cancer | 1 |
| Bladder cancer follow-up | 1 |
| Suspected renal pelvis cancer | 1 |
| Renal mass | 1 |
| Breast cancer, treatment | 1 |
| Stomach cancer, post-operative | 1 |
| Uterine cancer, post-operative | 1 |
| Cervical cancer | 1 |
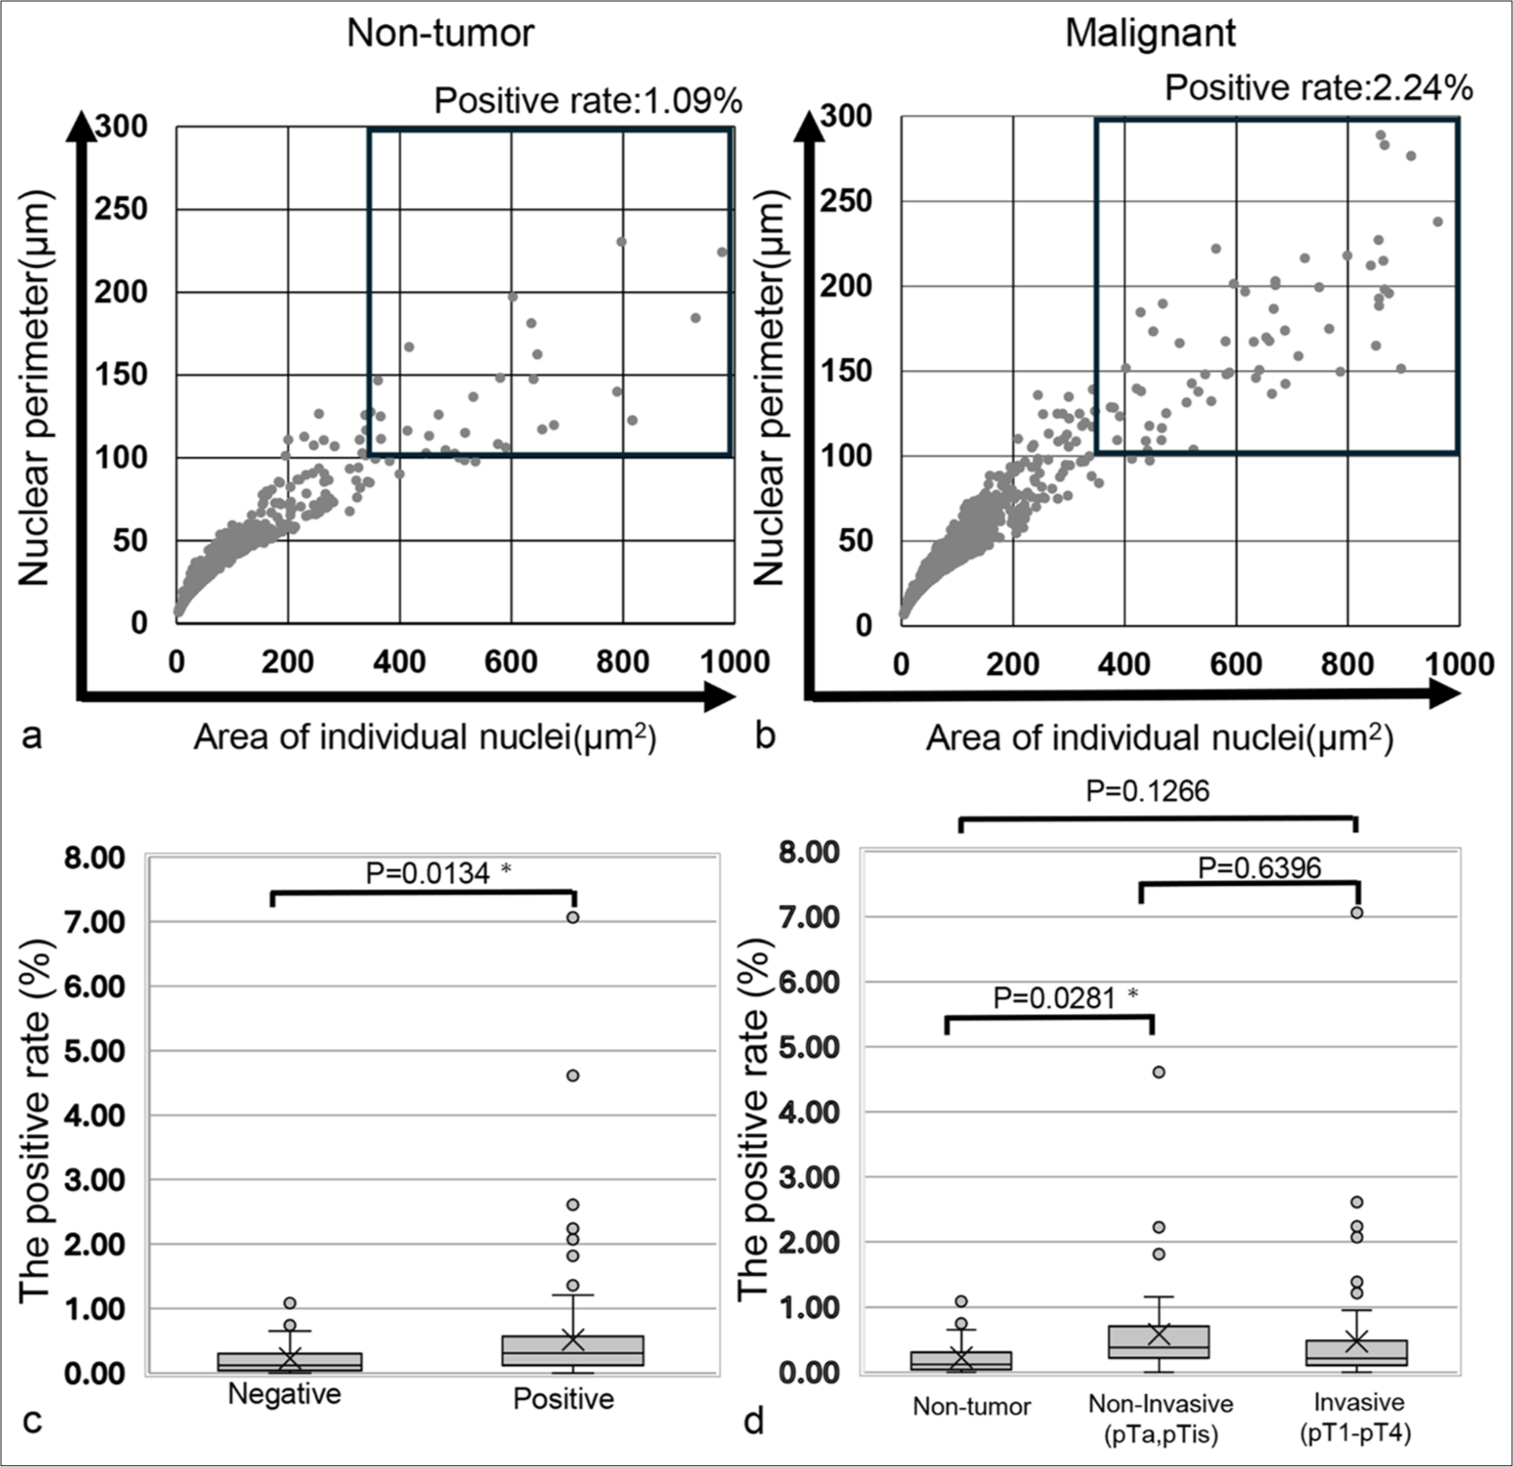
- Scatter plot representing the nuclear area and perimeter of the cells, along with a comparison of the positive rates for high nuclear area and perimeter in the total cell nuclei. (a) Scatter plot for a cytology-negative case (Case 43). (b) Scatter plot for a cytology-positive case (Case 190). (c) Comparison of the positive rates of high nuclear area and perimeter in total cell nuclei between cytology-negative and cytology-positive cases. (d) Comparison of the positive rates of high nuclear area and perimeter in total cell nuclei across cytology-negative cases, invasion-negative tumor cases, and invasion-positive tumor cases. The “X” marks the mean values in the box plot, while boxes with horizontal lines represent the medians with interquartile ranges. Error bars indicate maximum and minimum values, and circles represent outliers. P-values were determined using Dunnett’s analysis and the Tukey–Kramer test. ✶P < 0.05. Thus, the largest nuclear area/cellular area in b) is 9.22%, and the one in d) is 36.71%.
Scatter plots combining cells/cell cluster area and maximum nuclear area revealed distinct pattern differences between the cytology-negative and cytology-positive groups
The scatter plots for cell/cell clusters are presented in Figures 2 and 3. In the representative cell clusters of the cytology-negative group, the nuclei did not overlap, resulting in an occupancy rate of the maximum nuclear area within the cell/cell cluster of 9.22% [Figure 2a and b]. In contrast, the cytology-positive group exhibited high cellular density and a high N/C ratio, causing the nuclear area of individual tumor cells to be recognized as a connected nuclear area within the tumor cell cluster. Consequently, the occupancy rate of the maximum nuclear area within the tumor cell aggregate was 36.71% [Figure 2c and d]. For the scatter plot of cell area versus maximum nuclear area in the cytology-negative group, the plots were distributed along the X-axis (horizontal pattern). In the cytology-positive group, however, the plots were distributed along the Y-axis (vertical pattern). In addition, both groups displayed other plotting patterns, where the plots were distributed diagonally (diagonal pattern) [Figure 3]. A stacked bar graph illustrated the ratios of horizontal, vertical, and diagonal patterns among the non-tumor and malignancy groups [Figure 4a]. In the non-tumor group, the predominant plotting pattern was horizontal (57.7%), while the malignancy group primarily exhibited a vertical pattern (73.6%). A significant difference was found between the groups (P < 0.0001, Pearson’s Chi-square value: 104.481). The ratios of scatter plot patterns were then compared across the non-tumor, non-invasive, and invasive tumor groups [Figure 4b]. The non-tumor group mainly displayed a horizontal pattern (57.7%), whereas the noninvasive and invasive tumor groups predominantly showed vertical patterns (78.2% and 70.6%, respectively). Pearson’s Chi-square test indicated a significant difference among the three groups (P < 0.0001, and Pearson’s Chi-square value: 105.350). Moreover, differences in plot patterns within the non-invasive tumor group were examined. As shown in Figure 4c, the horizontal pattern was most common in the non-tumor group (57.7%), while the diagonal pattern was mainly observed in the pTa low-grade group (75%). The vertical pattern was predominantly seen in the pTa high-grade group, pTis group, and pTis + pTa group (68.8%, 81.0%, and 100%, respectively). This suggests that, despite differences in grade or invasion depth, the tumor groups exhibited distinct scatter plot patterns compared to the non-tumor group. Therefore, the scatter plot for cell/cell clusters could be useful not only in distinguishing the cytology-negative group from suspicious malignancy or malignancy groups but also in distinguishing early-stage cancer from the non-tumor group.
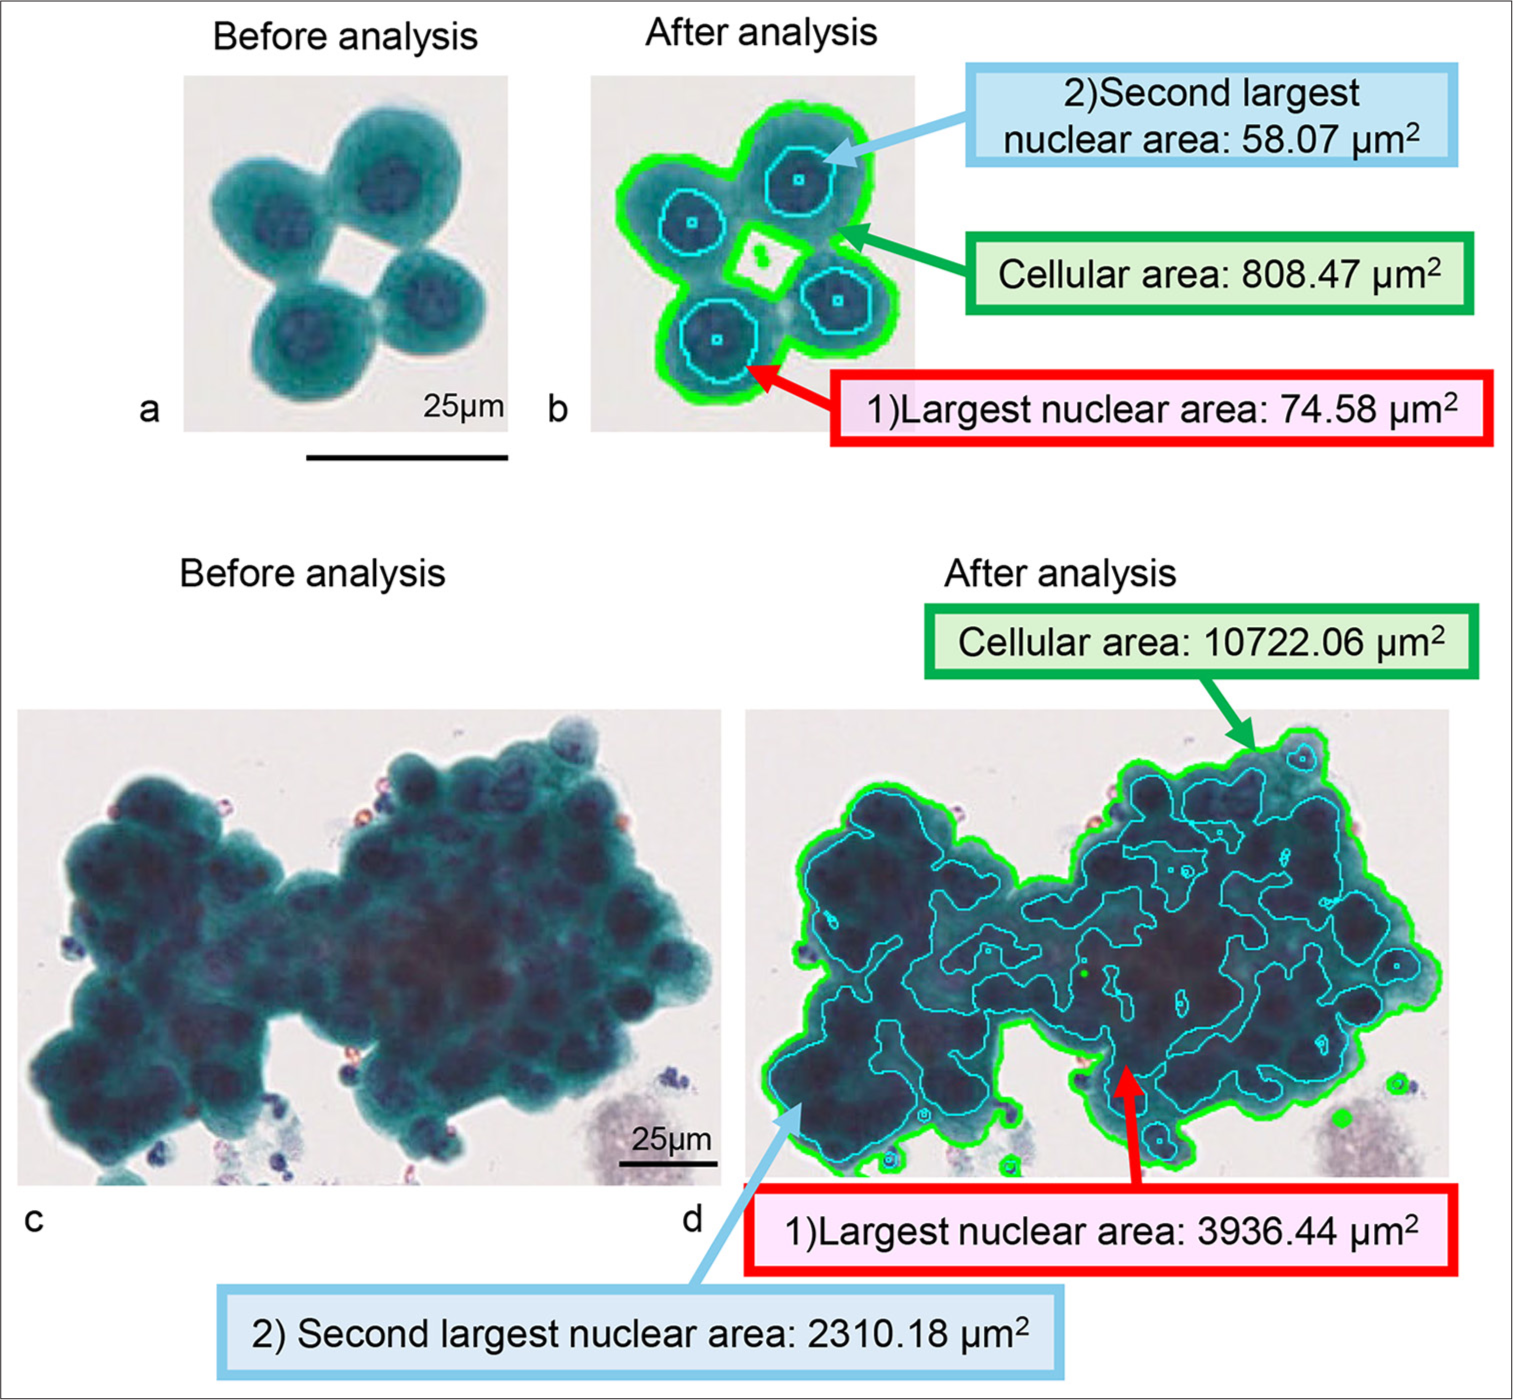
- Example of computer-assisted image analysis for normal urothelial cells and high-grade urothelial carcinoma (HGUC) cell clusters. (a and b) Normal urothelial cell cluster (Case 17). (c and d) HGUC case (Case 77). (a and c) show images before analysis, while (b and d) display images after analysis. The cellular area of the normal urothelial cell cluster in the analyzed image is outlined by the light green line, and the individually detectable nuclear areas are framed by the light blue line (b). The light green line outlines the cellular area of the carcinoma cell cluster in the analyzed image, and the individually detectable nuclear-connected area is framed by the light blue line (d). The actual cellular area data in (b and d) are highlighted with a green background and green line, while the largest nuclear area data in the cell cluster in (b and d) are highlighted with a red background and red arrow. The second-largest nuclear area data in the cell cluster in (b and d) are highlighted with a blue background and blue line. Thus, the largest nuclear area/cellular area in b) is 9.22%, and the one in d) is 36.71%.
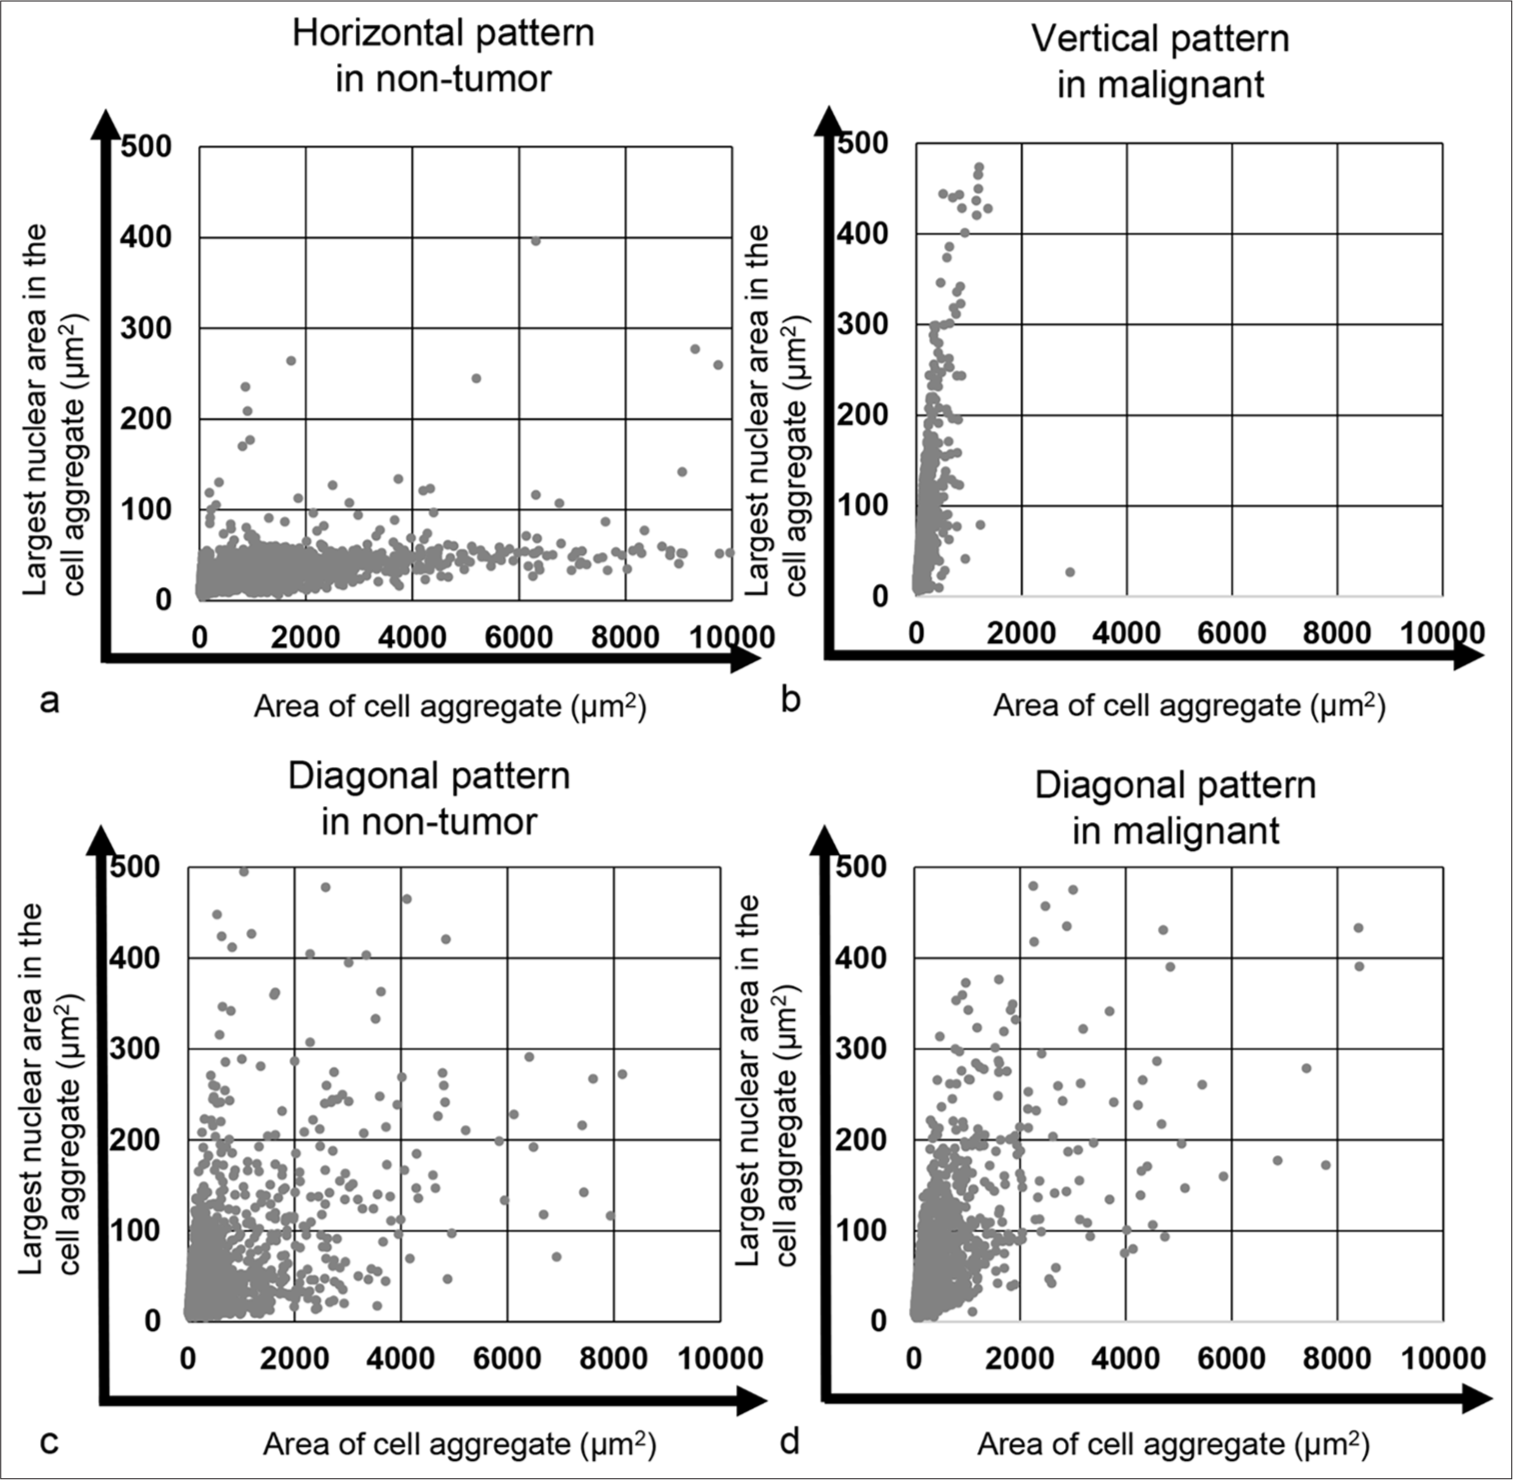
- Plot of the cell and cell aggregate areas alongside the largest nuclear area within the cell/cell aggregate. (a) Horizontal pattern observed in the cytology-negative case (Case 34) and (b) vertical pattern observed in the cytology-positive case (Case 190). (c) Diagonal pattern in the cytology-negative case (Case 1) and (d) diagonal pattern in the cytology-positive case (Case 181).
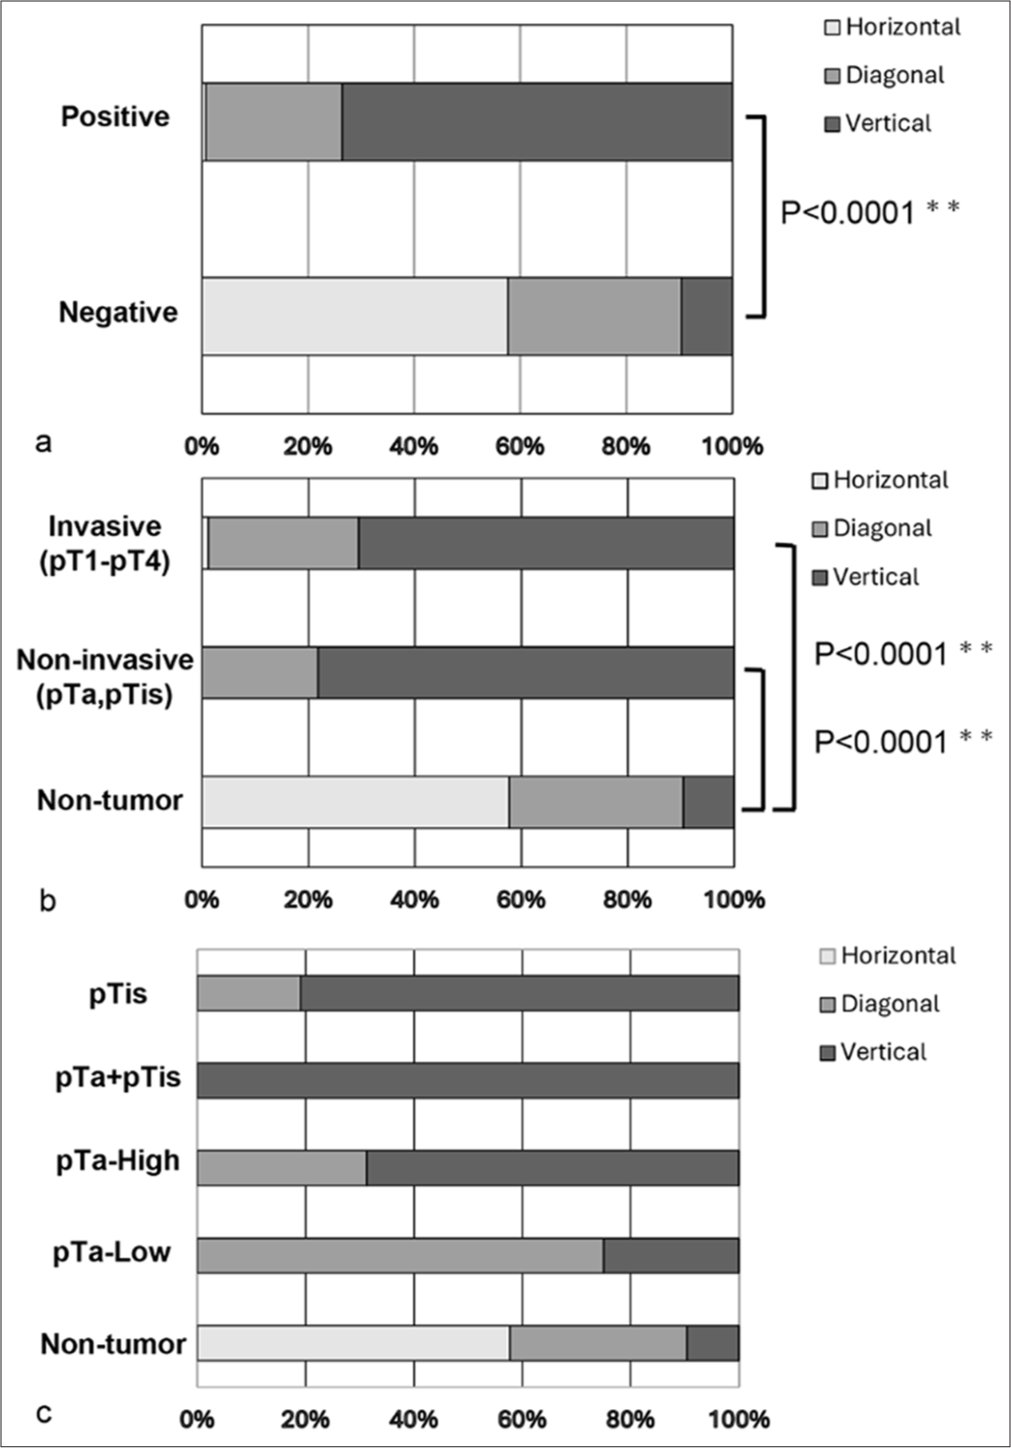
- A stacked bar chart illustrating the composition rates of each scatter plot pattern for the cell/cell aggregate areas and their largest independently detectable nuclear areas. (a) Comparison of scatter plot patterns based on cytological diagnosis. (b) Comparison of scatter plot patterns among the non-tumor, non-invasive, and invasive tumor cases. (c) Comparison of scatter plot patterns between non-tumor cases and non-invasive tumor categories. ✶✶P < 0.0001.
The percentage of cells/cell clusters in tumor-rich areas was significantly higher in the tumor group than the non-tumor group, but it was lower in the invasive tumor group than in the non-invasive tumor group
Since the predominant plotting pattern of the scatter plot for the tumor group was vertical, it was considered that tumor cells or cell clusters might be found in areas with a cell/cell cluster area of <2000 μm2 and a maximum nuclear area >75 μm2 (tumor-rich area), as cell/cell clusters were rarely observed in the scatter plot of the non-tumor group. Thus, we calculated the percentage of cell/cell clusters in the tumor-rich area [Figure 5a and b]. To verify the presence of tumor cells in this area, we examined whether tumor cells or tumor cell clusters were present in the tumor-rich area. As shown in Figure 5c, we confirmed that tumor cell clusters consisting of 10–20 tumor cells were located in the upper part of the tumor-rich area along the Y-axis [Figure 5c (a-c)]. In contrast, single tumor cells were found in the lower part of the tumor-rich area along the Y-axis [Figure 5c (d-f)]. This suggests that the area defined for the tumor cell or cell cluster-rich area was appropriately set. The percentage of cell/cell clusters in the tumor-rich area was analyzed for all samples [Figure 6]. The percentage of cell/cell clusters in the tumor-rich area for both the non-invasive tumor group (pTa, pTis) and the invasive tumor group (pT1–pT4) was higher than that of the non-tumor group. However, the percentage of cell/cell clusters in the tumor-rich area was significantly lower in the invasive tumor group compared to the noninvasive tumor group (P = 0.0299) [Figure 6a]. Moreover, the percentage of cell/cell clusters in the tumor-rich areas for both the non-muscle-invasive and muscle-invasive groups was greater than that of the non-tumor groups. While the muscle-invasive tumor group did not show statistically significant differences compared to the non-muscle-invasive tumor group, there was a tendency toward a difference (P = 0.0574) [Figure 6b]. These results suggest that the tumor group can be distinguished from the non-tumor group based on the percentage of cell/cell clusters in the tumor-rich areas, regardless of the depth of tumor invasion. However, the lower percentage of cell/cell clusters in the tumor-rich areas of the invasive tumor and muscle-invasive tumor groups indicates an underlying reason for this observation.
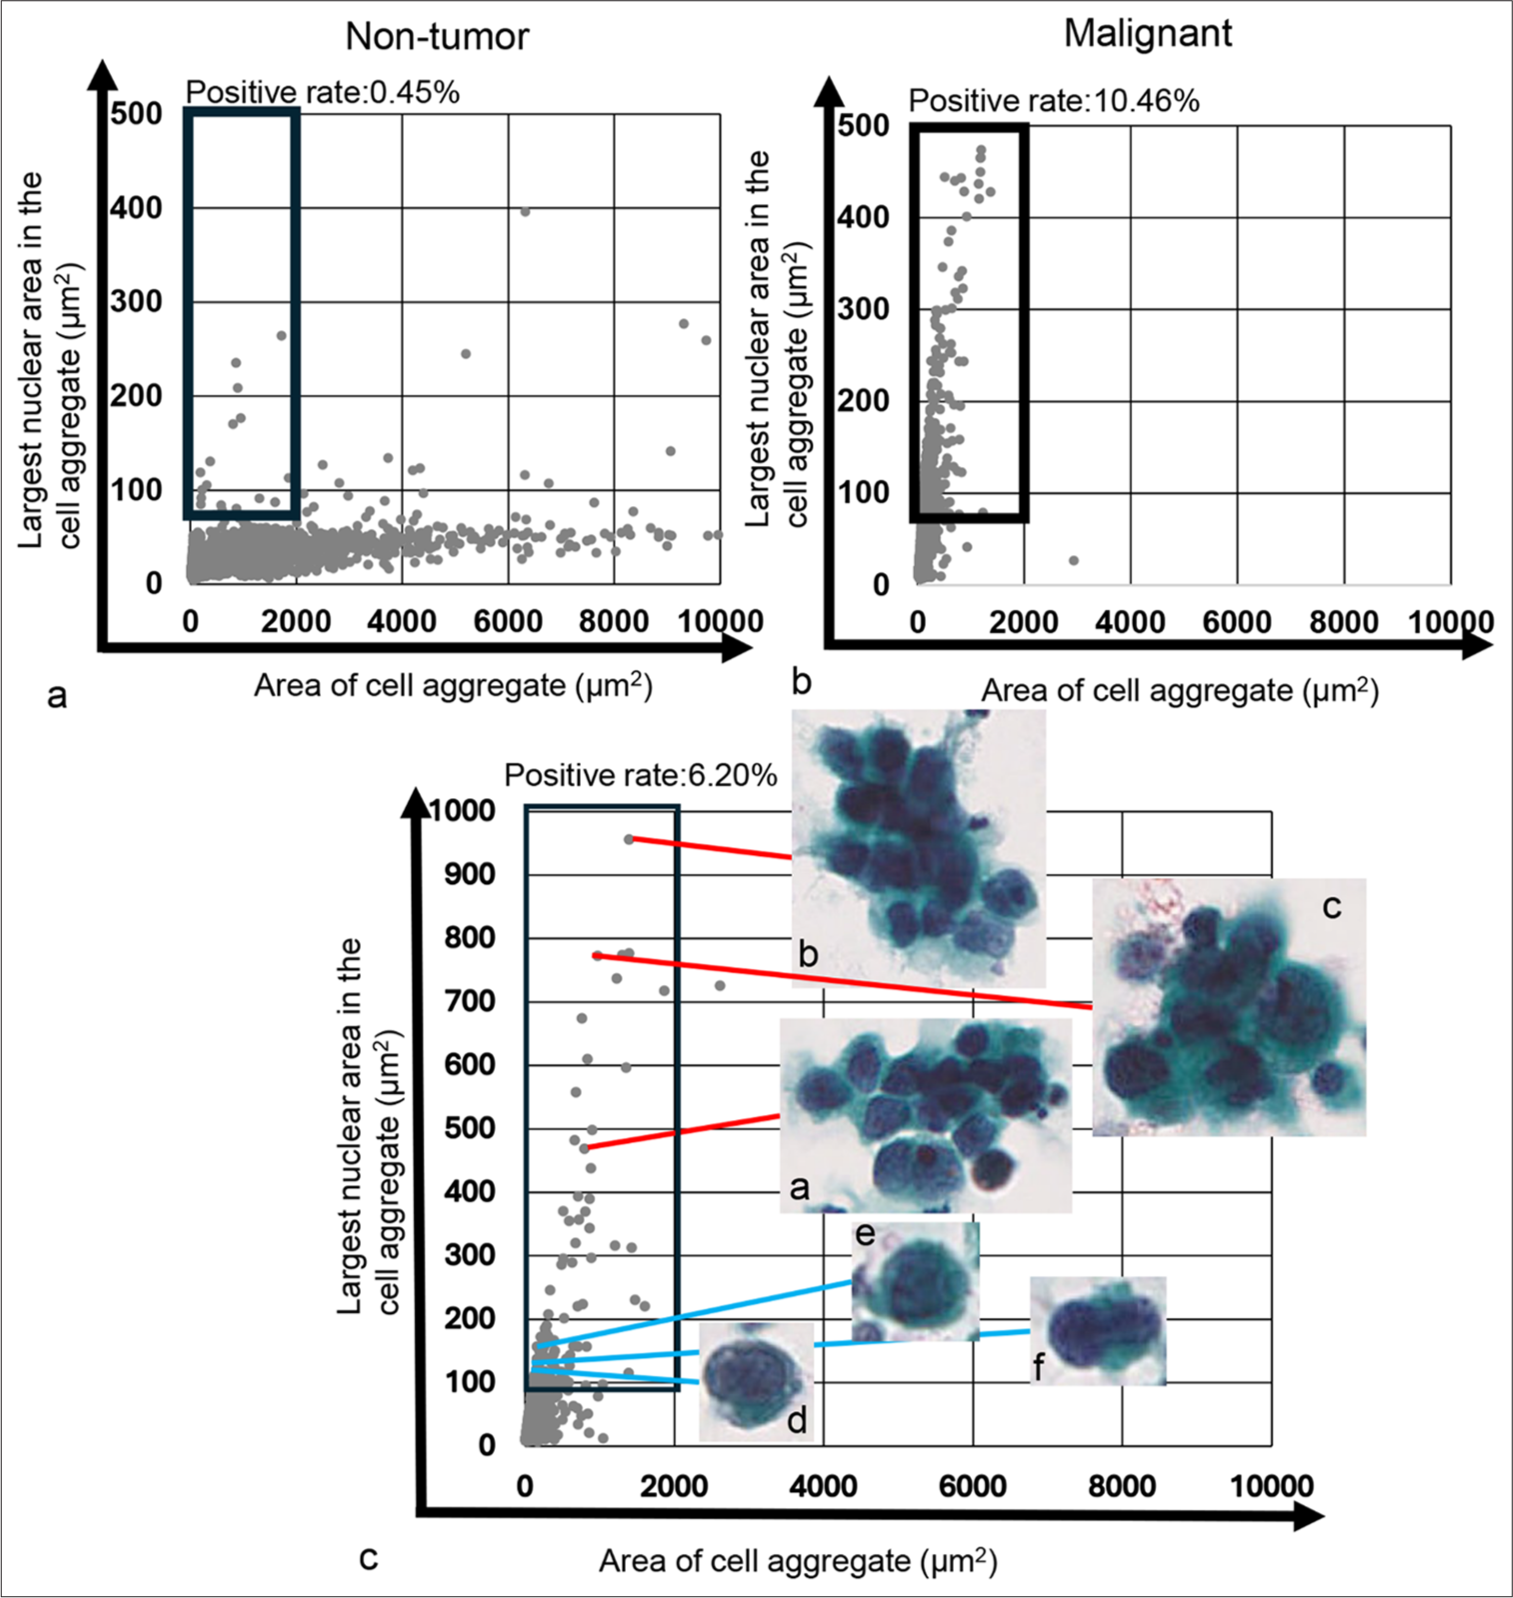
- Plot of the cell/cell aggregate area and their largest nuclear area within the cell/cell aggregate, alongside actual cell image in the tumor-dominant area. (a) Scatter plot for the cytology-negative case (Case 34). (b) Scatter plot for the cytology-positive case (Case 190). The thick black square lines in both (a and b) indicate the tumor-dominant area. (c) Magnified scatter plot (Case 111) showing the distribution of individual tumor cells and small to medium-sized tumor cell clusters in the tumor-dominant area. The red line denotes the area of small to medium-sized tumor cell clusters and representative images of those clusters, respectively. The blue line indicates areas of individual tumor cells and representative images of those cells. Each cell or cell cluster area and maximum nuclear area shown in Figure 5c (a-f) were as follows: 1507.77 μm2 and 465.60 μm2 (a), 1625.28 μm2 and 993.72 μm2 (b), 1390.41 μm2 and 776.52 μm2 (c), 155.85 μm2 and 113.65 μm2 (d), 243.18 μm2 and 158.49 μm2 (e), and 152.19 μm2 and 118.98 μm2 (f), respectively.
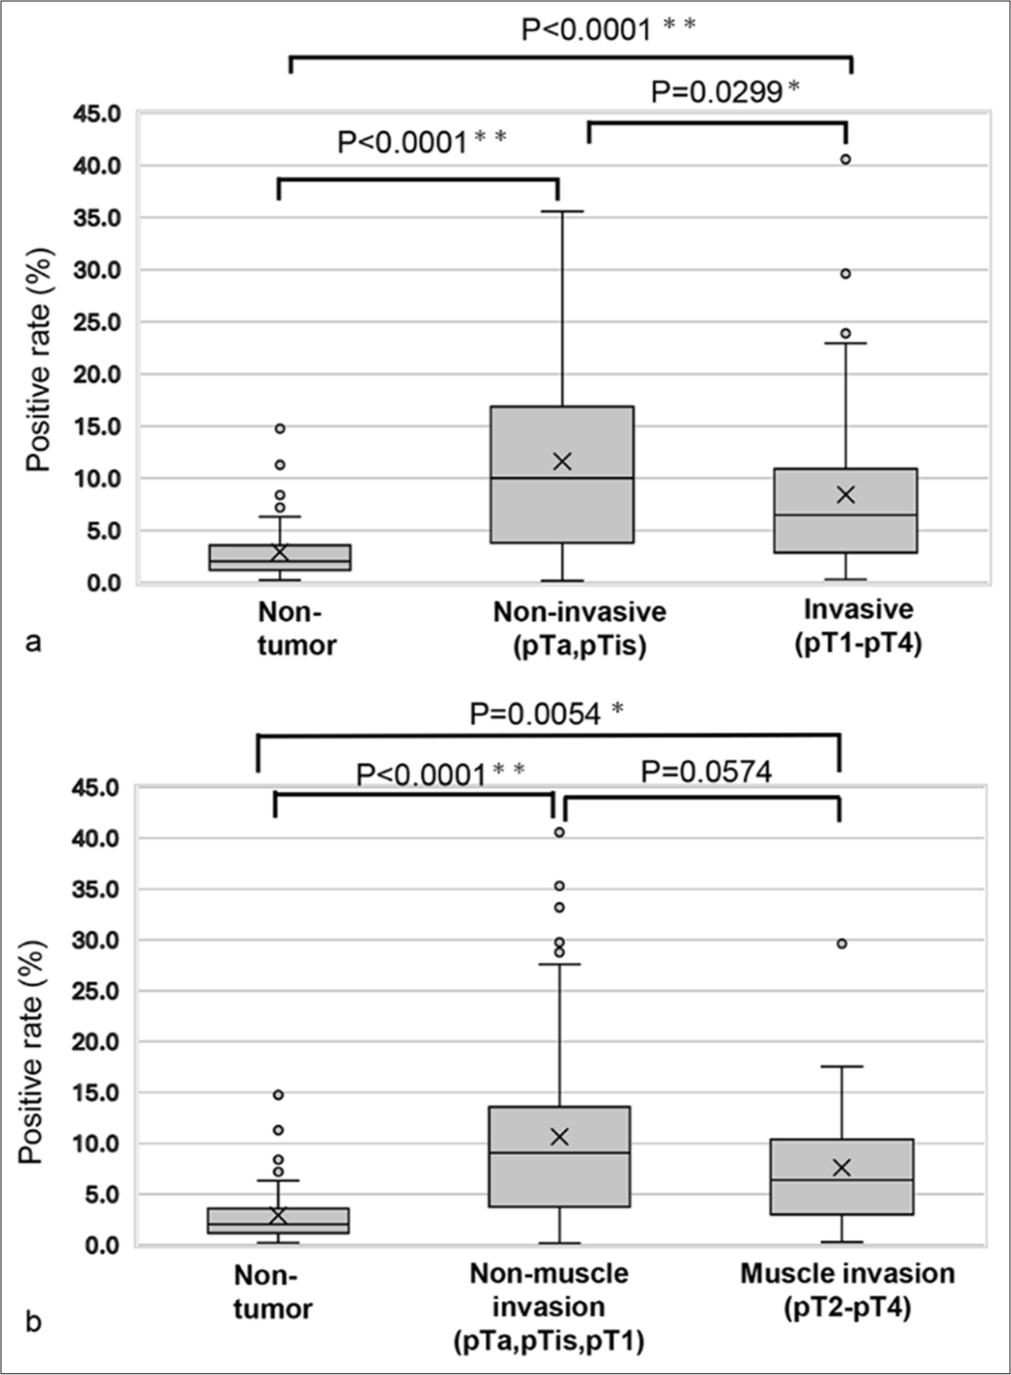
- Comparison of the positive rates for the largest nuclear area within a high cell/cell aggregate-distributed area. (a) Comparison among non-tumor, non-invasive, and invasive tumor cases. (b) Comparison between non-tumor cases, non-muscle-invasive tumor cases, and muscle-invasive tumor cases. “X” marks the mean values in the box plot, while boxes with horizontal lines indicate the medians with interquartile ranges. Error bars represent the maximum and minimum values, and circles denote outliers. P-values were calculated using the Tukey–Kramer test. ✶P < 0.05 and ✶✶P < 0.0001.
Neutrophil exudation was higher in the invasive tumor group compared to the non-invasive tumor group, and it was also greater in the muscle-invasive tumor group than in the non-muscle-invasive tumor group
We examined the virtual slide images of all cases for neutrophil exudation, with representative images of poor and rich neutrophil exudation, as shown in Figure 7. When comparing neutrophil exudation between the non-invasive tumor group (pTa and pTis) and the invasive tumor group (pT1–pT4), the background neutrophil exudation was significantly higher in the invasive tumor group (P = 0.0191, Pearson’s Chi-square value: 5.490) [Table 3]. Similarly, when comparing the non-muscle-invasive tumor group (pTa, pTis, and pT1) with the muscle-invasive tumor group (pT2–pT4), the background neutrophil exudation was significantly higher in the muscle-invasive tumor group (P = 0.0014, Pearson’s Chi-square value: 10.269) [Table 4]. These results suggest that the lower percentage of cell/cell clusters in tumor-rich areas of the invasive and muscle-invasive tumor groups, compared to the non-invasive and non-muscle-invasive group, may be attributed to neutrophil exudation into the urine.
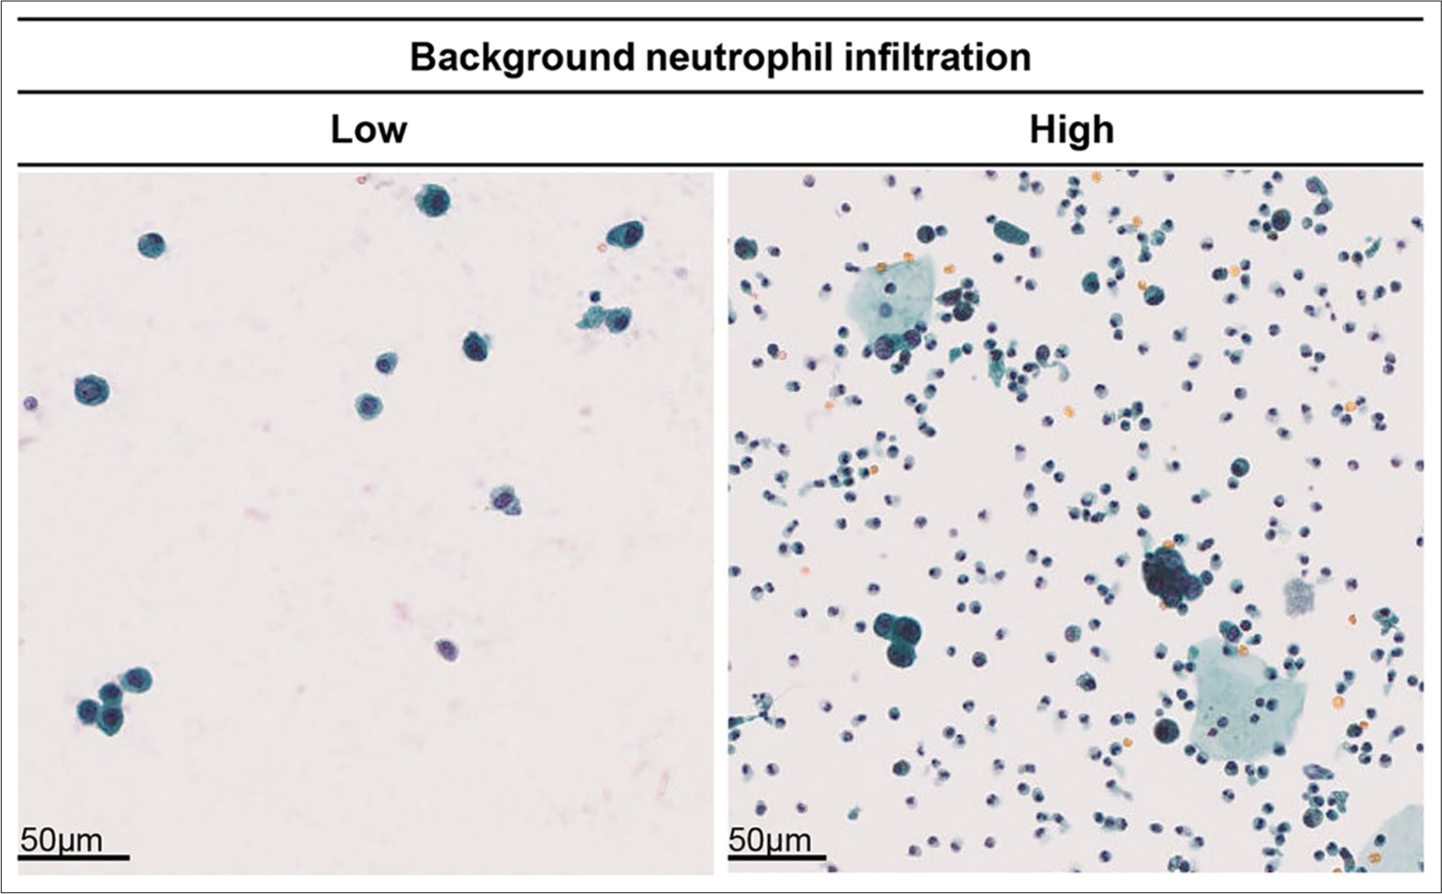
- Comparison of background neutrophil infiltration levels and tumor invasion depth. Left: Example of low background neutrophil infiltration (Case 123). Right: Example of high background neutrophil infiltration (Case 187).
| Depth of invasion | Background neutrophil infiltration | Chi-square | ||
|---|---|---|---|---|
| Low | High | P-value | ||
| Non-invasive (pTa, pTis) | 44 | 11 | 0.0191✶ | 5.490 |
| Invasive (pT1-pT4) | 52 | 33 | ||
P-value was calculated using Fisher’s exact test. ✶P<0.05
| Depth of invasion | Background neutrophil infiltration | Chi-square | ||
|---|---|---|---|---|
| Low | High | P-value | ||
| Muscle invasion (−) | 74 | 22 | 0.0014✶ | 10.269 |
| Muscle invasion (+) | 22 | 22 | ||
P-value was calculated using Fisher’s exact test. ✶P<0.05
The utility of scatter plot analysis in metachronous cancer
Finally, we attempted to determine whether scatter plot analysis could be utilized for metachronous cancer. As shown in Figure 8, two of our patients developed metachronous cancer: one 3 years and one 5 years after the initial TUR-Bt. The plot patterns for these patients were all vertical. Interestingly, among the cytologically suspicious cases, Case 73-year 1 and Case 103-year 5 had more tumor cells in the lowest part of the tumor-positive area than the cytologically malignant cases, Case 73-year 3 and Case 103-year 1. These findings suggest that the scatter plot pattern of metachronous tumor cells would be different from that of other tumor cells.
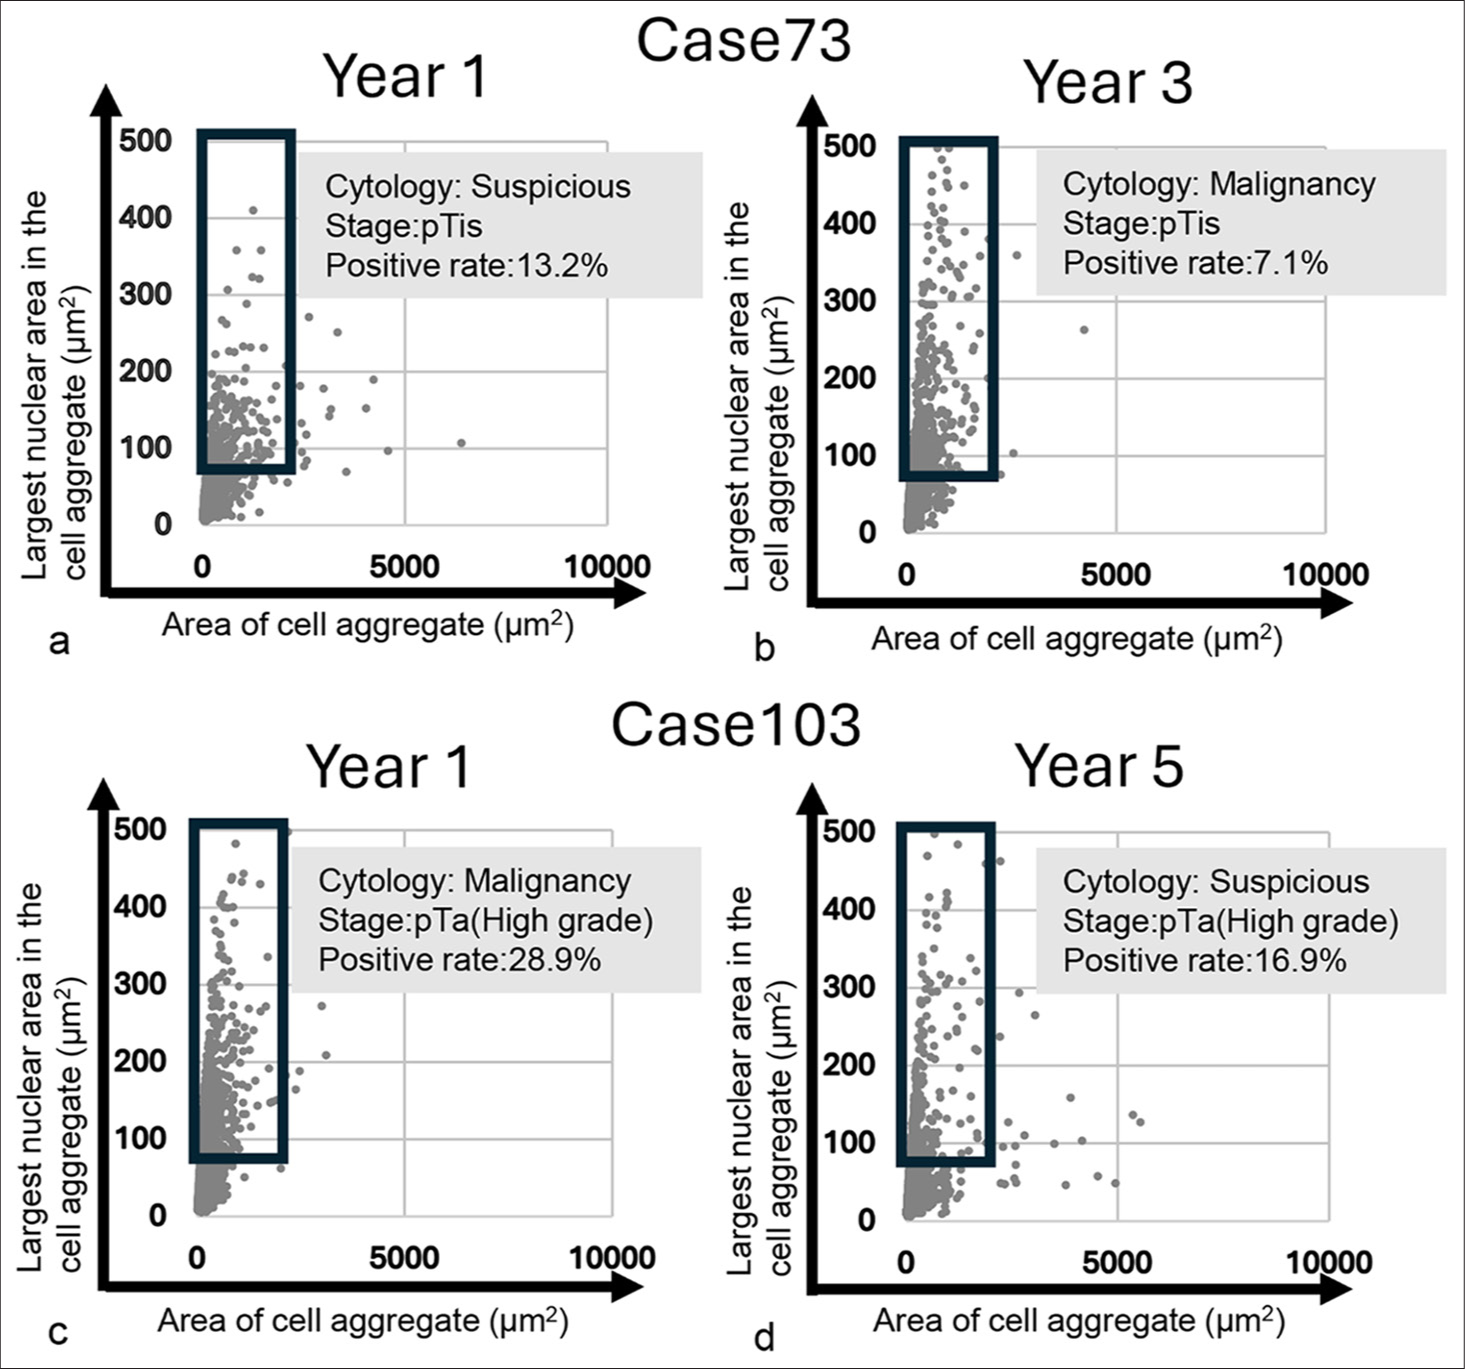
- Scatter plot of the area of cell/cell aggregate and their largest nuclear area in the cell/cell aggregate for metachronous tumor cases. (a and b) Scatter plot of initially developed tumor and secondary developed tumor in Case 73. (c and d) Scatter plot of initially developed tumor and secondarily developed tumor in Case 103.
DISCUSSION
The previous studies analyzing cytological specimens have primarily focused on nuclear morphology across various samples, including urothelial carcinoma,[10] pancreatic cancer,[17] bile duct cancer,[18] and thyroid cancer.[11,19] For example, Sakumo et al. found that the nuclear area, cell area, N/C ratio, and nuclear roundness were significantly higher in HGUC compared to reactive urothelial and tubular epithelial cells.[10] In addition, Poropatich et al. demonstrated that the nuclei of urothelial carcinoma in situ and HGUC were significantly larger than those in reactive urothelial cells.[20] Momeni-Boroujeni et al. reported significant differences in nuclear area and perimeter between benign and malignant cells in pancreatic cancer.[17] Collins and Weimholt compared the sizes of individual nuclei and the number of nuclei in bile duct cancer cell clusters, revealing a significant difference in nuclear area between cytologically atypical cases and those suspicious for malignancy.[18] Chain et al. also noted that the nuclear area was larger in papillary carcinoma and NIFTP compared to benign thyroid cells.[19] In this study, we focused on the cell/cell cluster area and their maximum nuclear area within the clusters, as we believed that tumor cell clusters exhibited cellular overlapping and higher density with an elevated N/C ratio. In examining cytological specimens, we consider various findings, including cellular overlap and density, as part of the diagnostic criteria in cytology.[12,21] As cells become malignant, their nuclei enlarge, leading to an increase in nuclear area and cell density. Accordingly, malignant cell clusters are irregularly overlapped compared to benign cell clusters. This finding provides an indicator with which to distinguish between benign and malignant lesions.[22] However, we did not find any studies that analyzed cytological specimens for overlapping cellular clusters by combining cellular and nuclear areas. In this study, we leveraged the observation that multiple overlapping nuclei in a tumor cell cluster are perceived as a single-nuclear color tone region. This is due to the ambiguous focus of the overlapping tumor cell clusters, which exhibit a high N/C ratio and high cellularity, resulting in the regional connection of nuclear areas. In addition, we could not locate any image analysis studies that applied an algorithm combining the cell/cell cluster area and the maximum nuclear area within those clusters. Therefore, our manuscript is unique and valuable, as our algorithm can distinguish between benign and malignant cell/cell clusters based on different scatter plot patterns. Regarding the use of the Z-stack function in image analysis, while it is commonly employed for analyzing cell images in WSI analysis,[3,16,23-25] many cytology image analyses do not utilize Z-stacks.[14] Thus, even though our study did not incorporate the Z-stack function, our research strategy remains relevant and effective.
In this study, we also explored the potential for detecting early-stage cancer by comparing low-grade tumors and high-grade tumors. The scatter plots indicate that many tumor groups (both non-invasive and invasive) did not exhibit the horizontal patterns seen in the non-tumor groups. This implies that urothelial carcinoma can be identified at an early stage in high-grade cases. In addition, our study is significant because our algorithm can detect cancer cells regardless of the depth of tumor invasion. We included only four cases of TURBT specimens with low-grade urothelial carcinoma, focusing on cases classified as “suspicious for malignancy,” “fairly conclusive of malignancy,” and “malignancy.” Future research will need to increase the number of low-grade pTa cases for further study. The scatter plot pattern for low-grade pTa cases is predominantly diagonal, in contrast to the vertical pattern seen in high-grade cases and the horizontal pattern exhibited by non-tumor groups. This indicates not only a difference in patterns between pTa low-grade and pTa high-grade groups but also a difference between pTa low-grade groups and non-tumor groups. Using the scatter plot patterns in this study, it may be possible to predict the presence of tumor components and whether they belong to the low-grade or high-grade groups. The sensitivity for detecting low-grade urothelial carcinoma in urine cytology is low.[26] Indeed, McCroskey et al. reported that the presence of papillary clusters with fibrovascular core was useful for diagnosing low-grade urothelial carcinoma from normal urothelial clusters, but the appearance of this feature was very low (two out of 98 cases).[12] In addition, they mentioned that there was no statistically significant difference between the low-grade urothelial carcinoma group and the negative control group for cellular features in multivariate analysis.[12] In addition, low-grade urothelial carcinoma shows low cellularity and appears as single scattered cells.[26] The formation of contiguous nuclear regions is influenced by cell density and cell clusters, which explains the fewer vertical patterns observed in the pTa low-grade group.
Finally, we consider the reasons for the significantly lower percentage of tumor-rich areas in the invasive tumor group (pT1-pT4) and the muscle-invasive tumor group (pT2-pT4) compared to the non-invasive and non-muscle-invasive groups. Previous reports have indicated that the number of background neutrophils in urine cytology specimens can serve as an indicator for evaluating the chromatin of tumor cells in urothelial carcinoma.[27] However, there are no reports that evaluate the number of background neutrophils in urine cytology specifically for urothelial carcinoma. Some studies have noted a correlation between muscle invasion in urothelial carcinoma and the number of neutrophils present in the tumor stroma of histological specimens.[28] In this study, we propose that the higher number of background neutrophils in urine samples from the invasive tumor group may be due to increased neutrophil infiltration in the stroma, with neutrophils exuding into the urine when tumor cells detach from the tissue. That means, based on our findings, it is possible to anticipate muscle invasion with the findings of increased background neutrophils in the cytological specimens.
SUMMARY
In this study, we introduced two factors not previously utilized in computer-assisted image analysis: cell clusters and the largest connected area of nuclei within those clusters. Our examination of scatter plots revealed that negative cytology cases typically exhibited a horizontal pattern along the cell cluster area axis, while tumor cases showed a vertical pattern along the axis of the largest nuclear area within the cell clusters. This distinction allows for the identification of tumors in urine samples using scatter plots. The algorithm applied in this study aligns with the methods used by cytopathologists and cytotechnologists in their daily practice, focusing on overlapping cell clusters, increased cell density, and a higher N/C ratio in tumor cell clusters. Although we analyzed ambiguous focus tumor cell clusters, we aimed to clarify the characteristics of malignant clusters with high cell density and overlapping clusters compared to normal cell clusters that appear sheet-like and flat. While such ambiguous focus areas are typically overlooked, our study offers valuable insights into how human-utilized algorithm can be integrated into computer-assisted image analysis for future cytological research.
ACKNOWLEDGMENT
Not applicable.
AVAILABILITY OF DATA AND MATERIALS
The data supporting the findings of this study are available from the corresponding author, MS, on reasonable request.
ABBREVIATIONS
HGUC: High-grade urothelial carcinoma
JPEG: Joint photographic experts group
N/C: Nuclear-cytoplasmic
NIFTP: Non-invasive follicular thyroid neoplasm with papillary-like nuclear features
TURBT: Transurethral resection of bladder tumor
WSI: Whole slide images
AUTHOR CONTRIBUTIONS
CH: Collected clinical data from hospital electrical records, obtained virtual slide scanner image data, performed computer-assisted image analysis, analyzed the resulting data, conducted statistical analysis, prepared figures and tables, and drafted the manuscript; MS: As the corresponding author, designed the experiments, performed computer-assisted image analysis, analyzed the data, conducted statistical analysis, prepared figures and tables, and wrote the manuscript; SK and YN: Performed the computer-assisted image analysis; SA and KS: Collected clinical data from the hospital’s electronic records and verified the data collected by CH.
ETHICS APPROVAL AND CONSENT TO PARTICIPATE
The research/study approved by the Institutional Review Board at Gunma University Ethical Review Board for Medical Research Involving Human Subjects, number HS2023-085, dated 2023/09/20. As the samples in this study were the secondary use of existing samples and it was difficult to obtain individual consent, the requirement for informed consent was waived in line with the Ethical Guidelines for Medical Research Involving Human Subjects, established by the Japanese government (Ministry of Education, Culture, Sports, Science and Technology and Ministry of Health, Labour and Welfare). Instead, the purpose of the use of the samples was disclosed to participants on the Gunma University Hospital website, and participants were provided with the opportunity to opt out, in accordance with the ethical guidelines.
CONFLICT OF INTEREST
The authors declare no conflict of interest.
EDITORIAL/PEER REVIEW
To ensure the integrity and highest quality of CytoJournal publications, the review process of this manuscript was conducted under a double-blind model (authors are blinded for reviewers and vice versa) through an automatic online system.
FUNDING: Not applicable.
References
- EAU guidelines on non-muscle-invasive urothelial carcinoma of the bladder, the 2011 update. Eur Urol. 2011;59:997-1008.
- [CrossRef] [PubMed] [Google Scholar]
- Bladder cancer, version 3.2020, NCCN clinical practice guidelines in oncology. J Natl Compr Canc Netw. 2020;18:329-54.
- [CrossRef] [PubMed] [Google Scholar]
- Artificial intelligence to improve cytology performances in bladder carcinoma detection: Results of the VisioCyt test. BJU Int. 2022;129:356-63.
- [CrossRef] [PubMed] [Google Scholar]
- A novel urine-based assay for bladder cancer diagnosis: Multi-institutional validation study. Eur Urol Focus. 2018;4:388-94.
- [CrossRef] [PubMed] [Google Scholar]
- Genomic profile of urine has high diagnostic sensitivity compared to cytology in non-invasive urothelial bladder cancer. Cancer Sci. 2019;110:3235-43.
- [CrossRef] [PubMed] [Google Scholar]
- Performance of an artificial intelligence algorithm for reporting urine cytopathology. Cancer Cytopathol. 2019;127:658-66.
- [CrossRef] [PubMed] [Google Scholar]
- A deep learning system to diagnose the malignant potential of urothelial carcinoma cells in cytology specimens. Cancer Cytopathol. 2021;129:984-95.
- [CrossRef] [PubMed] [Google Scholar]
- Morphometric analysis of nuclear symmetry in urothelial carcinoma for predicting tumor recurrence. Microsc Res Tech. 2021;84:2559-64.
- [CrossRef] [PubMed] [Google Scholar]
- Deep learning-based recurrence prediction in patients with non-muscle-invasive bladder cancer. Eur Urol Focus. 2022;8:165-72.
- [CrossRef] [PubMed] [Google Scholar]
- The usefulness of nuclear area in the diagnosis of high-grade urothelial carcinoma cells in voided urine cytology. Cytopathology. 2023;34:295-301.
- [CrossRef] [PubMed] [Google Scholar]
- Digital analyses of nuclear features can help discriminate among non-invasive follicular thyroid neoplasm with papillary-like nuclear features, papillary thyroid carcinoma follicular subtype, and follicular carcinoma in cytological specimens. Cytopathology. 2024;35:98-104.
- [CrossRef] [PubMed] [Google Scholar]
- Is a consistent cytologic diagnosis of low-grade urothelial carcinoma in instrumented urinary tract cytologic specimens possible? A comparison between cytomorphologic features of low-grade urothelial carcinoma and non-neoplastic changes shows extensive overlap, making a reliable diagnosis impossible. J Am Soc Cytopathol. 2015;4:90-7.
- [CrossRef] [PubMed] [Google Scholar]
- Cytomorphological characteristics of low-grade papillary urothelial carcinoma for differential diagnosis from benign papillary urothelial lesions: Logistic regression analysis in SurePath(™) liquid-based voided urine cytology. Cytopathology. 2016;27:83-90.
- [CrossRef] [PubMed] [Google Scholar]
- Uncovering additional predictors of urothelial carcinoma from voided urothelial cell clusters through a deep learning-based image preprocessing technique. Cancer Cytopathol. 2023;131:19-29.
- [CrossRef] [PubMed] [Google Scholar]
- WMA Declaration of Helsinki - Ethical Principles for Medical Research Involving Human Participants. Available from: https://www.wma.net/policies-post/wma-declaration-of-helsinki [Last accessed on 2024 Oct 29]
- [Google Scholar]
- Nuclear membrane irregularity in high-grade urothelial carcinoma cells can be measured by using circularity and solidity as morphometric shape definitions in digital image analysis of urinary tract cytology specimens. Cancer Cytopathol. 2023;131:351-9.
- [CrossRef] [PubMed] [Google Scholar]
- Computer-assisted cytologic diagnosis in pancreatic FNA: An application of neural networks to image analysis. Cancer Cytopathol. 2017;125:926-33.
- [CrossRef] [PubMed] [Google Scholar]
- Whole slide image with image analysis of atypical bile duct brushing: Quantitative features predictive of malignancy. J Pathol Inform. 2015;6:47.
- [CrossRef] [PubMed] [Google Scholar]
- Digital image-assisted quantitative nuclear analysis improves diagnostic accuracy of thyroid fine-needle aspiration cytology. Cancer Cytopathol. 2019;127:501-13.
- [CrossRef] [PubMed] [Google Scholar]
- Nuclear size measurement for distinguishing urothelial carcinomas from reactive urothelium on tissue sections. Diagn Pathol. 2016;11:57.
- [CrossRef] [PubMed] [Google Scholar]
- Cytomorphologic features as predictors of aggressiveness in patients with pT1 papillary thyroid carcinoma: A retrospective study of associations with clinicopathological parameters in 226 fine-needle aspirates. Gland Surg. 2021;10:319-27.
- [CrossRef] [PubMed] [Google Scholar]
- Bile cytology: A new scoring system for improving diagnostic accuracy. Diagn Cytopathol. 2019;47:641-7.
- [CrossRef] [PubMed] [Google Scholar]
- An ancillary method in urine cytology: Nucleolar/nuclear volume ratio for discrimination between benign and malignant urothelial cells. Diagn Cytopathol. 2016;44:483-91.
- [CrossRef] [PubMed] [Google Scholar]
- Digital image analysis supports a nuclear-to-cytoplasmic ratio cutoff value below 0.7 for positive for high-grade urothelial carcinoma and suspicious for high-grade urothelial carcinoma in urine cytology specimens. Cancer Cytopathol. 2019;127:120-4.
- [CrossRef] [PubMed] [Google Scholar]
- Use of machine learning-based software for the screening of thyroid cytopathology whole slide images. Arch Pathol Lab Med. 2022;146:872-8.
- [CrossRef] [PubMed] [Google Scholar]
- Is diagnosis of low-grade urothelial carcinoma possible in urine cytology? J Cytol. 2021;38:64-8.
- [CrossRef] [PubMed] [Google Scholar]
- Digital image analysis of high-grade urothelial carcinoma in urine cytology confirms chromasia heterogeneity and reveals a subset with hypochromatic nuclei and another with extremely dark or “India ink” nuclei. Cancer Cytopathol. 2022;130:363-9.
- [CrossRef] [PubMed] [Google Scholar]
- Tumorinfiltrating neutrophils predict benefit from adjuvant chemotherapy in patients with muscle invasive bladder cancer. Oncoimmunology. 2017;6:e1293211.
- [CrossRef] [PubMed] [Google Scholar]