


Translate this page into:
The Papanicolaou Society of Cytopathology guidelines for respiratory cytology: Reproducibility of categories among observers
*Corresponding author
-
Received: ,
Accepted: ,
This is an open access journal, and articles are distributed under the terms of the Creative Commons Attribution-NonCommercial-ShareAlike 4.0 License, which allows others to remix, tweak, and build upon the work non-commercially, as long as appropriate credit is given and the new creations are licensed under the identical terms.
This article was originally published by Medknow Publications & Media Pvt Ltd and was migrated to Scientific Scholar after the change of Publisher.
Abstract
Introduction:
The Papanicolaou Society of Cytopathology (PSC) has developed a set of guidelines for reporting respiratory cytology. While the malignancy risk for each category is known, the interobserver reproducibility of these diagnostic categories has not been well described.
Methods:
Fifty-five cytologic specimens obtained by fine needle aspiration from the pulmonary nodules were independently reviewed by four board-certified cytopathologists and assigned to the diagnostic categories described by the PSC guidelines for respiratory specimens. Statistical analysis for diagnostic accuracy was performed for absolute agreement and chance-corrected agreement (kappa). Differences in frequency of distribution of diagnoses between raters were assessed using the Kruskal–Wallis test.
Results:
No significant differences in distribution of scores by raters were observed. On average, the absolute agreement was 49.5% and the chance-corrected agreement (kappa) was 20%. 34.5% of interrater comparisons were in full agreement, and total lack of agreement between the four categories was found in 3% of cases. Combining the “suspicious for malignancy” category with the “malignant” category did not significantly alter interrater agreement statistics.
Conclusions:
The PSC categories showed only fair reproducibility among four cytopathologists. Agreement between raters was at best fair and did not improve significantly when the categories “suspicious for malignancy” and “malignant” were combined. The most common source of disagreement appeared to be between the categories “suspicious” and “malignant.”
Keywords
Endobronchial ultrasound guided
fine needle aspirates
lung
Papanicolaou Society of Cytopathology guidelines
reproducibility
respiratory cytology

INTRODUCTION
The Papanicolaou Society of Cytopathology (PSC) published guidelines for nomenclature and categorization of respiratory cytology samples in 2016. These guidelines proposed a six-category system for the diagnosis of cytologic samples obtained from the respiratory tract. Categories utilized were nondiagnostic, negative (for malignancy), atypical, neoplastic, suspicious for malignancy, and positive for malignancy. Considerable controversy existed between committee members as to the need for and appropriateness of an atypical category. Despite the varying opinions regarding the value of an “atypical” category, it was included in the final recommendations for diagnostic nomenclature.[1] As with the previously published PSC recommendations for terminology in categorization of pancreaticobiliary cytology specimens,[2] and the reporting system for thyroid cytology,[3456] the PSC categories used for pulmonary cytology appear to usefully stratify risk of malignancy.[7] The categories used for the PSC respiratory guidelines appear to effectively stratify the risk of malignancy for nondiagnostic (40%), negative (24%), atypical (54%), neoplastic (unknown%), suspicious for malignancy (82%), and malignant (87%) categories.[7] The malignancy risks for the categories negative (for malignancy), atypical, and suspicious for malignancy are substantially different for each of the categories with approximately 30% difference in malignancy risk between each of the first three categories. This establishes a progressive risk of malignancy as one moves from negative to suspicious for malignancy. This progression of risk appears to validate the value of these categories for estimating risk of malignancy and for aiding a clinician in determining the nature of follow-up after a cytologic diagnosis is categorized according to the PSC system.
Despite the apparent success of the categorization system in separating cytologic specimens into clinically useful categories, little data exist as to the reproducibility of the PSC pulmonary categories. In addition, the categories “suspicious for malignancy” and “malignant” showed little difference in estimated risk of malignancy (82% vs. 87%).[7] While the data presented by Layfield et al.[7] did not investigate the cause for this modest difference in malignancy risk, a possible explanation is poor interobserver reproducibility in assigning specimens to the “suspicious for malignancy” or “malignant” categories. To assess reproducibility of the PSC diagnostic categories for respiratory cytology, we investigated the overall interobserver reproducibility in a series of 55 endobronchial ultrasound-guided fine needle aspirates (EBUS-FNAs) of the pulmonary nodules. In particular, we compared the interobserver agreement when the categories of suspicious and malignant were kept separate or combined. Herein, we report the results of that study.
METHODS
The protocol for the present study was reviewed by the University of Missouri Institutional Review Board and designated as exempt. The study also meets the standards of the Declaration of Helsinki Protocol. The study population consists of 55 consecutive specimens obtained by EBUS-FNA of the pulmonary nodules over a 1-year period (July 2014 to June 2015). All pulmonary FNA cases obtained during this time period were performed by EBUS. Cases were not specifically selected by any of the reviewers, and hence, all reviewers were blinded as to original diagnosis. The specimens were classified according to the PSC guidelines for standardized terminology for respiratory cytology.[1] Histologic follow-up was obtained in 44 of 55 cases (four wedge biopsies, two lobectomies, three node biopsies, 22 transbronchial biopsies, and 13 endobronchial biopsies). Classification was performed by review of Diff-Quik- and Papanicolaou-stained material. Immunohistochemical preparations were not reviewed for this study. For statistical analysis of diagnostic accuracy, the surgical pathology diagnosis was used as the “gold standard” (44/55 cases). For clinical follow-up only cases, the consensus cytological diagnosis was used as the “gold standard” diagnosis. The consensus diagnosis was determined by the most frequent diagnosis (mode) provided by the raters. The slides associated with each specimen were mailed to the reviewing cytopathologists. Each specimen was reviewed independently by four board-certified cytopathologists unaware of the previous diagnosis or the opinions of the other cytopathologists involved in this study. The cytopathologists have between 5 and 30 years experience in pulmonary cytology. The raters were not supplied with clinical history or imaging findings other than the presence of a discrete pulmonary nodule. Each cytopathologist was instructed to review the material and assign it to one of the categories described in the standardized terminology for respiratory cytology proposed by the PSC.[1] All cases were obtained from the files of the Department of Pathology and Anatomical Sciences, University of Missouri, and the Department of Pathology and Laboratory Medicine of the University of North Carolina, Chapel Hill.
Statistical analysis
Agreement was assessed between all pairs of raters using both absolute agreement and chance-corrected agreement (Cohen's kappa[8910]). Chance-corrected agreement was calculated using a weighting scheme which awarded full credit for complete agreement and 50% credit for disagreements that differed by one diagnostic category [Table 1]. No credit was given for disagreements that were >1 diagnostic category. Differences in frequency distributions of diagnoses between raters were assessed using the Kruskal–Wallis test. Agreement statistics were performed with and without the suspicious category (i.e., suspicious and malignant kept as separate categories or combined into a single category) to determine if agreement improved when the indeterminate category of “suspicious for malignancy” was dropped from the scheme.

Diagnostic accuracy was assessed by comparing cytologic diagnoses against final diagnoses. Analysis of accuracy requires a 2 × 2 classification. To that end, cytologic diagnosis of suspicious was classified as malignant. Cytologic diagnoses of atypical and neoplastic were classified as negative for malignancy. Cytologic diagnoses of nondiagnostic were excluded. We calculated the sensitivity, specificity, area under the receiver operating characteristic curve, positive predictive value, and negative predictive value for each individual rater and for all raters.
Statistical calculations were performed using Stata 14 (Stata Corp LLC, College Station, TX, USA). We followed the Guidelines for Reporting Reliability and Agreement Studies.[910]
RESULTS
There were 55 cases. Cytologic diagnoses were distributed as follows: 1 (1.8%) nondiagnostic, 13 (23.6%) negative for malignancy, 11 (20%) atypical, 0 (0%) neoplastic, 14 (25.5%) suspicious, 12 (21.8%) malignant, and 4 (7.3%) with no consensus diagnosis. There was no significant difference in the distribution of scores by rater (χ2 = 3.8, P = 0.24). Table 2 lists the exact percentage of correct categorizations by case. On average, the absolute agreement was 49.5% and the chance-corrected agreement (kappa) was 20% [Table 3]. Of 307 inter-rater comparisons, 106 (34.5%) showed full agreement, 95 (30.9%) differed by one category, 42 (13.7%) differed by two categories, 55 (17.9%) differed by three categories, and 9 (2.9%) differed by four categories [Table 4]. The ratings for each case are presented in Figure 1.
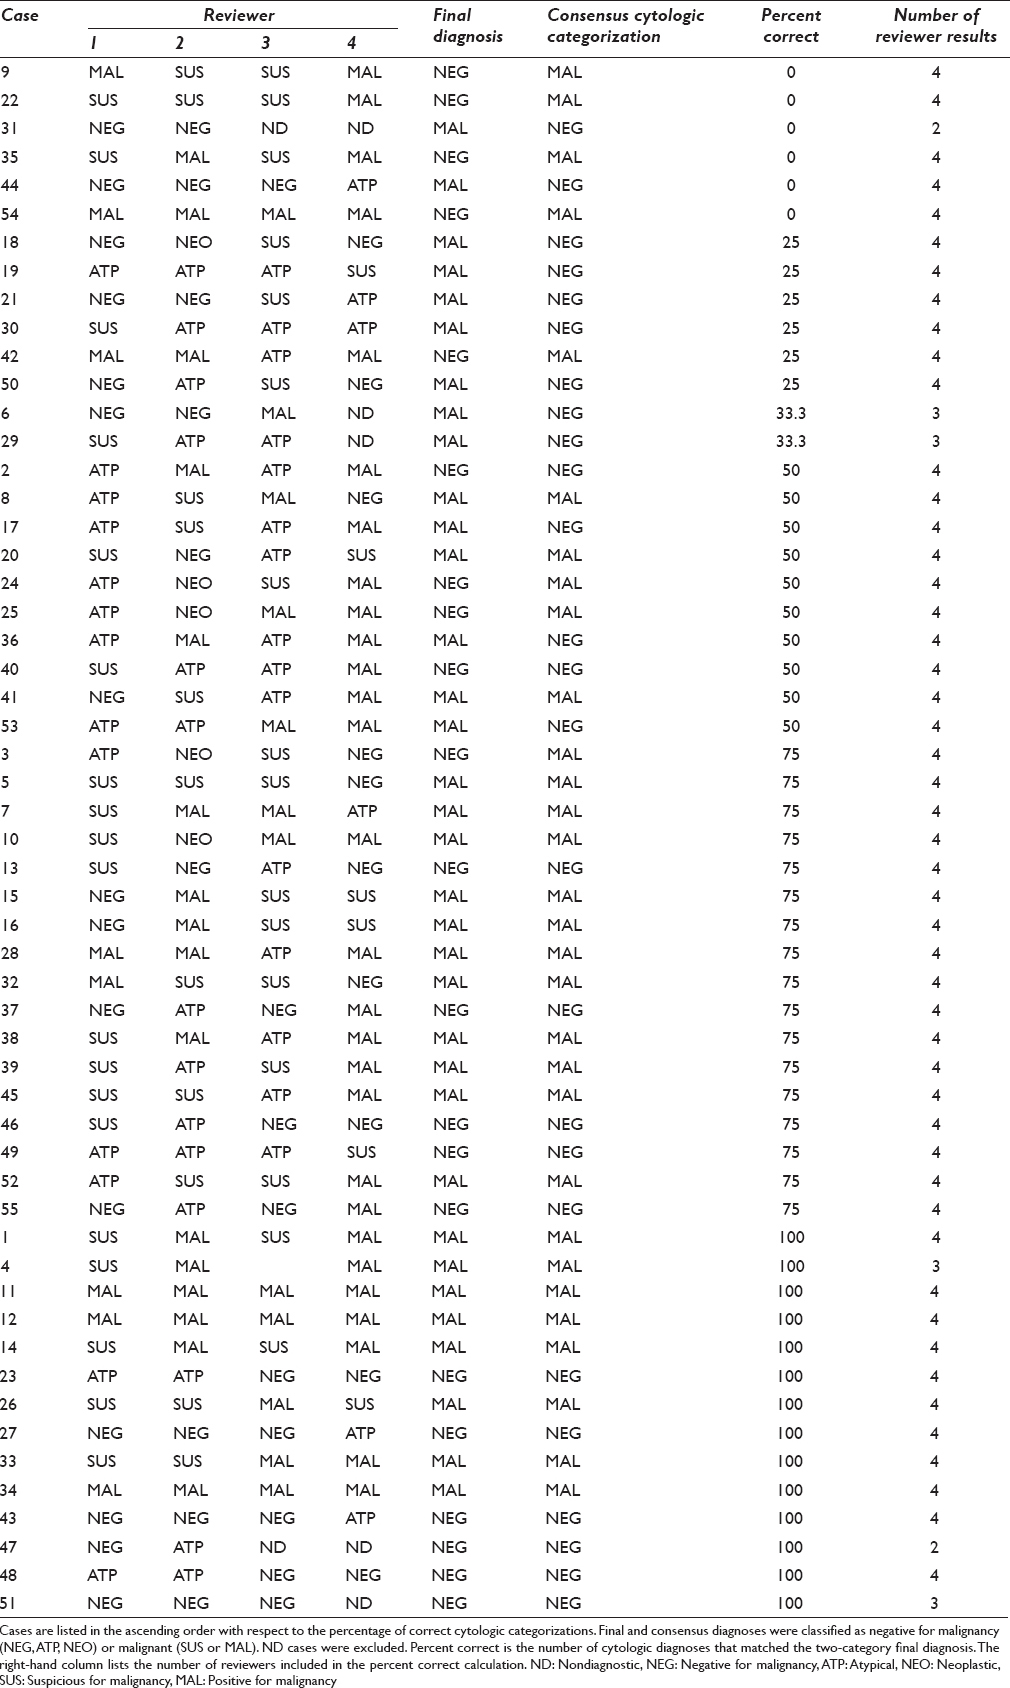


- Cytologic diagnoses by case. Each line shows the individual diagnoses provided by each reviewer. The vertical axis has a line for each case. Cases are divided by final diagnosis. The right-hand side showing the percentage of diagnoses that were correct for each case. Each symbol on the left-hand graph corresponds to a specific reviewer (e.g., red diamonds = reviewer 1)
When the suspicious category was not used, the suspicious and malignant diagnoses were combined into a single malignant category. There were 55 cases. Consensus categories were distributed as follows: 13 (23.6%) negative for malignancy, 4 (7.3%) atypical, 0 (0%) neoplastic, 29 (52.7%) malignant, and 9 (12.7%) with no consensus diagnosis. There was no significant difference in the distribution of scores by rater [Tables 3a and b, χ2 = 0.6, P = 0.90]. On average, the absolute agreement was 58.5% and the chance-corrected agreement (kappa) was 24% [Table 3b]. The improvement in chance-corrected agreement obtained by eliminating the suspicious category was not statistically significant (Z = 0.21, P = 0.41). Of 307 interrater comparisons, 156 (50.8%) showed full agreement, 50 (16.3%) differed by one category, 70 (22.8%) differed by two categories, and 31 (10.1%) differed by three categories.
Agreement between raters was only fair and did not improve significantly when the categories suspicious and malignant were combined. The most common source of disagreement appeared to occur between the categories suspicious and malignant. There were nine cases where there was no consensus categorization which in part reflected disagreements concerning suspicious and malignant categorizations. There were also a number of both malignant and negative for malignancy diagnoses present in cases where the consensus diagnosis was suspicious.
The average sensitivity and specificity were 64% (95% confidence interval [CI]: 58%–71%) and 59% (95% CI: 53%–67%), respectively [Table 5]. There was no significant difference in accuracy between reviewers (χ32 = 1.32, P = 0.72). Accuracy varied widely by case [Figure 2]. Figure 2 shows the relationship between percentage of correct categorization for the four observers and the number of cases (frequency) where that percentage of correct categorization occurred. There were 15 cases where the cytologic categorization of all four reviewers corresponded with the final histologic diagnosis. There were six cases where none of the cytologic categorizations corresponded with the final histologic diagnosis.

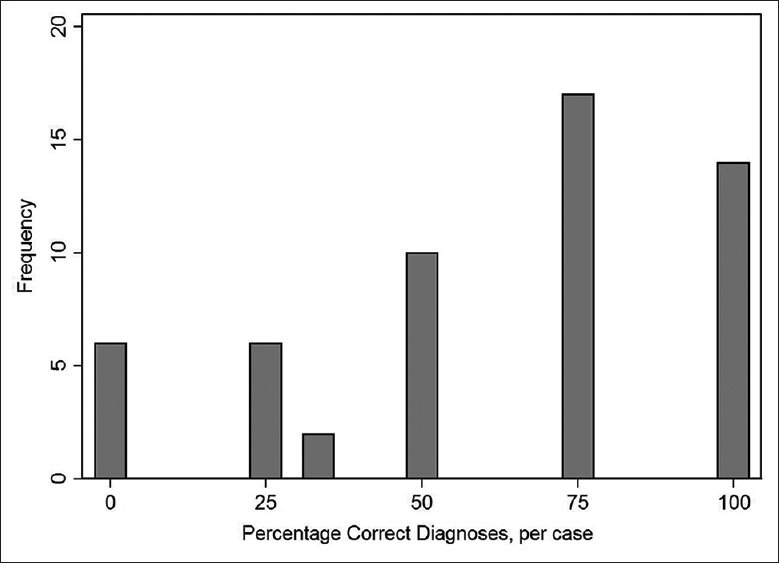
- Accuracy of categorization by case. The percentage of correct categories for each case was calculated. For example, there were 15 cases where the cytologic categorization of all four reviewers corresponded with the final diagnosis/categorization
DISCUSSION
A number of guidelines have been produced over the last decade with the objective of producing a universally utilized set of definitions and criteria for the reporting of cytologic specimens.[123] In addition to proposing diagnostic criteria and categories, these classification systems have provided estimates of malignancy risk for each of the proposed categories.[123] A major objective for these reporting systems was to increase agreement among cytopathologists and to provide a uniform diagnostic terminology. These systems have been variably successful at improving intercytopathologist agreement in diagnosis. The Bethesda System for Reporting Thyroid Cytopathology has been the most widely accepted of the reporting systems, but studies have documented variable success for the system in improving diagnostic reproducibility.[456111213] Reproducibility of PSC guidelines for the pancreaticobiliary cytology showed slight-to-fair interobserver agreement.[14] Thus, it appears that interobserver reproducibility for cytologic diagnoses of FNA specimens depends on diagnostic category, organ site, and categorization system.
Because of the differences in interobserver reproducibility among the classification systems and FNA target sites, we investigated the interobserver reproducibility of the recently published PSC recommendations for pulmonary cytology. In the present study, 55 FNA specimens obtained by EBUS had consensus diagnoses which fell predominately into the negative (24%), nondiagnostic (40%), atypical (20%), suspicious (26%), and malignant (22%) categories. No consensus as to diagnosis could be achieved in four cases (7%). Absolute agreement occurred in approximately 50% of cases and the chance-corrected agreement (kappa) was 20% when five categories were utilized. The present study showed that the consensus diagnosis had poor accuracy when compared to the final histologic diagnosis. There were a significant number of cases where all four reviewers failed to make the correct diagnosis as established by histologic review [Figure 2]. In the six cases where all four reviewers failed to make the correct diagnosis as established by histologic review, four were found to be negative for malignancy on histologic review of biopsy specimens. In each case, the cytologic review categorizations ranged from atypical to malignant. In each specimen, small numbers of atypical cells were present which on re-evaluation was consistent with reactive pneumocytes. In two cases, histologic review of biopsy specimens disclosed squamous cell carcinoma. In each of these cases, cytologic categorization by the four reviewers ranged from nondiagnostic to suspicious for malignancy. Re-review of the cytologic material revealed that there were only a small number of diagnostic cells which often were distorted by processing artifact making evaluation difficult. When the atypical and negative categories were separated, only 34% of interrater comparisons were in full agreement and an additional 31% differed by a single category. When the atypical category was combined with the negative category, absolute agreement increased marginally to 57% and chance-corrected agreement to 25%. Forty-six percent as opposed to 34% of interrater comparisons were in full agreement when the negative and atypical categories were combined. Overall, interrater agreement would be considered fair for both interrater agreements when the atypical category was and was not utilized. Thus, the utilization of an atypical category did not markedly affect interrater agreement in a negative fashion. This supports the finding that the risk of malignancy in the negative and atypical categories was substantially different, indicating a probable realistic difference in cytomorphologic features and risk of malignancy between the negative and atypical categories.
A significant component of interrater disagreement was due to distinguishing in a consistent fashion between cases “suspicious for malignancy” and those truly malignant. These cases accounted for 25% of the total disagreements. This poor interrater agreement may be due to the lack of definable morphologic differences between “suspicious for malignancy” and malignant cases. This is in part borne out by the study by Layfield et al.,[7] where the risks of malignancy for the “suspicious for malignancy” category (82%) and the malignant (87%) risks of malignancy for the respective categories. There were no significant differences in the malignancy rate between the categories of suspicious for malignancy (n = 11) and the malignant category (n = 60, P = 0.33). This may in part have been due to the small sample size in the suspicious category. Given that there is little difference in risk of malignancy between the “suspicious” and fully malignant categories, perhaps, these two categories should be combined and result in slightly improved interrater agreement/correlation.
An outcome associated with combining the suspicious for malignancy category with the malignant category was a significant number of rater disagreements between negative for malignancy and malignant. Review of the cytologic specimens and diagnoses for these cases showed that most contained a population of small atypical cells with the differential diagnosis of atypical reactive, pneumocytes, small cell carcinoma, and lymphoma. Diagnostic difficulty occurred because the atypical small cells were often present in small numbers or demonstrated technical artifact. When the suspicious category was an option, 71% of those pairs had been categorized as suspicious for malignancy.
Fifty-one percent of the disagreements were >1 category. Disagreements between the atypical category and suspicious/malignant categories accounted for 32% of the disagreements and were the major source of disagreements that were >1 category. The PSC guidelines suggest that the use of the atypical category should be relatively infrequent, but 20% of the cases were classified as atypical in our study. This raises the question as to whether the PSC criteria for the atypical category were applied correctly or whether the criteria are ambiguous or difficult to apply. Unlike the categories suspicious and malignant, there is a relatively large difference in the malignancy rate between atypical (54%) and suspicious/malignant (84%), so disagreements between these two categories are concerning.
Agreement can occur by chance. Based on the distribution of cases, we estimated that the agreement rate would be 37% if cases were randomly assigned to five categories. The observed agreement was 50% [Table 3a]. Thus, raters performed somewhat better than random assignment as shown by the kappa score of 20%. This means that pathologists only captured 20% of the opportunity for agreement after accounting for random agreement.
It is unclear why the agreement was so low. Poor agreement could be due to uneven performance. For example, agreement would be poor if one pathologist was an outlier. However, our results show that the agreement rates between pathologists were fairly even [Table 3a and b] and that all pathologists had similar accuracy [Table 5]. Thus, poor agreement was not due to uneven performance. Poor agreement could also occur if the PSC criteria were not applied correctly. We did not collect data on the cytologic findings, so we were unable to determine whether the PSC criteria were applied correctly. Further studies could identify specific cytologic features that lead to disagreement and refinement of the PSC guidelines. Furthermore, further studies are required to determine whether the disagreement rate observed at our institution is typical or whether agreement rates vary widely across institutions.
Part of the problem in reproducibility, especially for intermediate categories, is that the morphologic changes are a spectrum through which we draw artificial lines in an attempt to correlate with biological behavior. This is a difficult and imprecise task, so we develop intermediate categories with poorly reproducible criteria. The categories are based on criteria that can be expressed to various degrees both qualitatively and quantitatively. Thus, no clear-cut points exist for most categories leading to less than optimal reproducibility.
Potential for bias exists in any study, especially those with a modest number of samples. It is difficult to calculate a sample size for agreement studies. One cannot perform power calculations because the study does not involve hypothesis tests. In this case, sample size considerations rest on the desired precision of the estimates. In agreement studies, the number of trials is expanded by the number of raters. Our study had 55 cases and four raters, which provides 330 agreements when all combinations of raters are included (rater 1 vs. rater 2, rater 1 vs. rater 3, rater 1 vs. rater 4, rater 2 vs. rater 3, rater 2 vs. rater 4, rater 3 vs. rater 4). Including multiple raters greatly increases the reliability of an agreement study.
The effect of multiple raters on the reliability of estimates can be seen in Table 3a and b. We added confidence limits to the table to show that the estimates have reasonable precision. As shown in the table, the confidence limits for an individual pair of raters span about 20% points. The confidence interval for the overall average spans 11. Thus, the sample size is sufficient to draw meaningful conclusions.
We agree that it is common practice to exclude indeterminate results, but experts in the design and reporting of diagnostic studies believe that this is poor practice.[15161718] One possible method is to perform two separate analyses in which indeterminate results are classified as negative for malignancy and malignant. In lung neoplasms, cytological diagnose of atypical have a malignancy rate (54%) that is less than the malignancy rate of lesions classified as suspicious for malignancy (82%). Thus, cases with cytologic diagnoses of atypical are appropriately grouped within the nonmalignant category.
The present study indicates that interrater agreement is at best fair for the PSC categorization scheme for pulmonary cytology. The category “atypical” appears to have a sufficient interrater reproducibility and a significantly distinct risk of malignancy that its utility appears sufficient for continued use of the category. The categories “suspicious for malignancy” and “malignant” show considerable overlap between observers and also lack significant difference in risk of malignancy. This may indicate that the “suspicious for malignancy” and “malignant” categories should be combined in the future updates of the respiratory cytology guidelines.
COMPETING INTERESTS STATEMENT BY ALL AUTHORS
The authors declare that they have no competing interests.
AUTHORSHIP STATEMENT BY ALL AUTHORS
All authors declare that they qualify for authorship as defined by ICMJE. Each author has participated sufficiently in the work and take public responsibility for appropriate portions of the content of this article. All authors read and approved the final manuscript.
ETHICS STATEMENT BY ALL AUTHORS
This study was conducted with approval from Institutional Review Board (IRB) of all the institutions associated with this study as applicable.
LIST OF ABBREVIATIONS (In alphabetic order)
ATP - Atypical
AUROC - Area under the receiver operating characteristic
CI - Confidence interval
EBUS - Endobronchial ultrasound
FNA - Fine needle aspiration
MAL - Malignant
N - Number
ND - Non-diagnostic
NEG - Negative
NEO - Neoplasm
NPV - Negative predictive value
(PCT) - (percentage range)
PPV - Positive predictive value
PSC - Papanicolaou Society of Cytopathology
SD - Standard deviation
SUS - Suspicious.
EDITORIAL/PEER-REVIEW STATEMENT
To ensure the integrity and highest quality of CytoJournal publications, the review process of this manuscript was conducted under a double-blind model (authors are blinded for reviewers and vice versa) through automatic online system.
REFERENCES
- Standardized terminology and nomenclature for respiratory cytology: The Papanicolaou Society of Cytopathology guidelines. Diagn Cytopathol. 2016;44:399-409.
- [Google Scholar]
- Standardized terminology and nomenclature for pancreatobiliary cytology: The Papanicolaou Society of Cytopathology guidelines. Diagn Cytopathol. 2014;42:338-50.
- [Google Scholar]
- Diagnostic terminology and morphologic criteria for cytologic diagnosis of thyroid lesions: A synopsis of the National Cancer Institute Thyroid Fine-Needle Aspiration State of the Science Conference. Diagn Cytopathol. 2008;36:425-37.
- [Google Scholar]
- Reproducibility of 'The Bethesda System for Reporting Thyroid Cytopathology': A MultiCenter study with review of the literature. J Clin Diagn Res. 2013;7:1051-4.
- [Google Scholar]
- The interobserver reproducibility of thyroid cytopathology using Bethesda Reporting System: Analysis of 200 cases. J Pak Med Assoc. 2013;63:1252-5.
- [Google Scholar]
- Inter-and intraobserver reproducibility of thyroid fine needle aspiration cytology: An analysis of discrepant cases. Cytopathology. 2007;18:105-11.
- [Google Scholar]
- Malignancy risk for the categories: Non-diagnostic, benign, atypical, suspicious, and malignant used in the categorization of endobronchial ultrasound guided-fine needle aspirates of pulmonary nodules. Diagn Cytopathol. 2015;43:892-6.
- [Google Scholar]
- Guidelines for Reporting Reliability and Agreement Studies (GRRAS) were proposed. J Clin Epidemiol. 2011;64:96-106.
- [Google Scholar]
- Towards complete and accurate reporting of studies of diagnostic accuracy: The STARD initiative.Standards for Reporting of Diagnostic Accuracy. Clin Chem. 2003;49:1-6.
- [Google Scholar]
- The Bethesda system for reporting thyroid fine-needle aspiration specimens. Am J Clin Pathol. 2010;134:343-4.
- [Google Scholar]
- Interobserver reproducibility of thyroid fine-needle aspiration using the UK Royal College of Pathologists' classification system. Am J Clin Pathol. 2012;137:833-5.
- [Google Scholar]
- Interobserver variability in the fine needle aspiration biopsy diagnosis of follicular lesions of the thyroid gland. Acta Cytol. 2005;49:378-82.
- [Google Scholar]
- Interobserver reproducibility and agreement with original diagnosis in the categories “atypical” and “suspicious for malignancy” for bile and pancreatic duct brushings. Diagn Cytopathol. 2015;43:797-801.
- [Google Scholar]
- The STARD statement for reporting studies of diagnostic accuracy: Explanation and elaboration. Clin Chem. 2003;49:7-18.
- [Google Scholar]
- Diagnostic accuracy studies: How to report and analyse inconclusive test results. BMJ. 2013;346:f2778.
- [Google Scholar]
- Understanding sources of bias in diagnostic accuracy studies. Arch Pathol Lab Med. 2013;137:558-65.
- [Google Scholar]
- FDA. Statistical Guidance on Reporting Results from Studies Evaluating Diagnostic Tests. 2007. Available from: https://www.fda.gov/RegulatoryInformation/Guidances/ucm071148.htm
- [Google Scholar]