


Translate this page into:
A metabolomics study on carcinogenesis of ground-glass nodules

-
Received: ,
Accepted: ,
How to cite this article: Zhang X, Tong X, Chen Y, Chen J, Li Y, Ding C, et al. A metabolomics study on carcinogenesis of ground-glass nodules. CytoJournal 2024;21:12. doi: 10.25259/Cytojournal_68_2023
Abstract
Objective:
This study aimed to identify differential metabolites and key metabolic pathways between lung adenocarcinoma (LUAD) tissues and normal lung (NL) tissues using metabolomics techniques, to discover potential biomarkers for the early diagnosis of lung cancer.
Material and Methods:
Forty-five patients with primary ground-glass nodules (GGN) identified on computed tomography imaging and who were willing to undergo surgery at Shanghai General Hospital from December 2021 to December 2022 were recruited to the study. All participants underwent video thoracoscopy surgery with segmental or wedge resection of the lung. Tissue samples for pathological examination were collected from the site of ground-glass nodules (GGN) lesion and 3 cm away from the lesion (NL). The pathology results were 35 lung adenocarcinoma (LUAD) cases (13 invasive adenocarcinoma, 14 minimally invasive adenocarcinoma, and eight adenocarcinoma in situ), 10 benign samples, and 45 NL tissues. For the untargeted metabolomics technique, 25 LUAD samples were assigned as the case group and 30 NL tissues as the control group. For the targeted metabolomics technique, ten LUAD samples were assigned as the case group and 15 NL tissues as the control group. Samples were analyzed by untargeted and targeted metabolomics, with liquid chromatography-tandem mass spectrometry detection used as part of the experimental procedure.
Results:
Untargeted metabolomics revealed 164 differential metabolites between the case and control groups, comprising 110 up regulations and 54 down regulations. The main metabolic differences found by the untargeted method were organic acids and their derivatives. Targeted metabolomics revealed 77 differential metabolites between the case and control groups, comprising 69 up regulations and eight down regulations. The main metabolic changes found by the targeted method were fatty acids, amino acids, and organic acids. The levels of organic acids such as lactic acid, fumaric acid, and malic acid were significantly increased in LUAD tissue compared to NL. Specifically, an increased level of L-lactic acid was found by both untargeted (variable importance in projection [VIP] = 1.332, fold-change [FC] = 1.678, q = 0.000) and targeted metabolomics (VIP = 1.240, FC = 1.451, q = 0.043). Targeted metabolomics also revealed increased levels of fumaric acid (VIP = 1.481, FC = 1.764, q = 0.106) and L-malic acid (VIP = 1.376, FC = 1.562, q = 0.012). Most of the 20 differential fatty acids identified were downregulated, including dodecanoic acid (VIP = 1.416, FC = 0.378, q = 0.043) and tridecane acid (VIP = 0.880, FC = 0.780, q = 0.106). Furthermore, increased levels of differential amino acids were found in LUAD samples.
Conclusion:
Lung cancer is a complex and heterogeneous disease with diverse genetic alterations. The study of metabolic profiles is a promising research field in this cancer type. Targeted and untargeted metabolomics revealed significant differences in metabolites between LUAD and NL tissues, including elevated levels of organic acids, decreased levels of fatty acids, and increased levels of amino acids. These metabolic features provide valuable insights into LUAD pathogenesis and can potentially serve as biomarkers for prognosis and therapy response.
Keywords
Ground-glass nodules
Cancer transformation
Untargeted metabolomics
Targeted metabolomics

INTRODUCTION
Lung cancer is one of the most common and deadly malignancies in the world.[1] In 2020, approximately 2.2 million new cases were detected worldwide, with lung cancer accounting for 18.0% of all cancer-related deaths.[2] Chemotherapy and surgery are mostly ineffective for lung cancer patients diagnosed with late stages of the disease, and the 5-year survival rate of such patients is around 16%.[3] According to a review by Flenaugh,[4] the annual contribution of China to new lung cancer cases globally is 36%. The disease burden from this disease has a great impact on the national economy, workforce, and healthcare system while causing financial hardship for patients.[4]
Ground-glass nodule (GGN) is a common radiological sign of early lung adenocarcinoma (LUAD)[1] and can be identified in 30% of pulmonary computed tomography (CT) images of lung cancer patients.[5] The pathogenesis of GGN remains unclear. Depending on the degree of tumor invasion, GGN can be classified as atypical adenomatous hyperplasia (AAH), adenocarcinoma in situ (AIS), minimally invasive adenocarcinoma (MIA), or invasive adenocarcinoma (IAC).[1,6] The World Health Organization Classification of Tumors (5th edition) has classified AAH and AIS as precursor glandular lesions, and MIA and IAC as LUADs.[7] The progression of malignancy from AAH to AIS, and then further to MIA and IAC is a dynamic process.[8] The treatment options and prognosis of different GGN classifications are quite different.[6] AAH is a small localized lesion (≤0.5 cm diameter) with Clara cells and/or atypical proliferating type II alveolar pneumocytes and is generally considered benign.[9,10] Thus, patients with AAH may not need to undergo aggressive surgery.[9] AIS was previously known as bronchioloalveolar carcinoma and is a small (≤3 cm diameter), localized adenocarcinoma with no invasion.[10,11] MIA is defined as mixed and invasive lesions, with a maximum diameter size of 5 cm.[10,11] Prior research has shown the 5-year survival rate of AIS and MIA patients after surgical resection can be up to 100%.[6,10-12] IAC is an adenocarcinoma with ≥5 cm diameter and showing invasion to the pleura, blood vessels, and even lymphatics.[12] The 5-year survival rate of IAC patients after surgical resection has been reported as 74.6%, which is lower than that of AIS and MIA patients.[6] Thus, early detection, diagnosis , and treatment of GGN are associated with good prognosis and patient outcomes.[13]
Although GGNs have the morphological and histological features of LUAD, they are different from conventional LUAD and solid nodules[14] and may be related to a subtype of indolent tumors.[14] The optimal management of GGN is based on the probability of malignancy.[5] To evaluate this, clinicians use several validated pulmonary nodule risk prediction models, with reported values for area under the curve ranging from 0.75 to 0.94. These include the Mayo Clinic,[15] Herder et al.,[16] Veterans Affairs Cooperative Study,[17] Brock University,[18] and Cleveland Clinic[19] models. Different levels of probability are associated with different management options. No additional intervention measure is required for a malignancy probability of <1%. Chest CT monitoring should be performed according to the size of the nodules for a malignancy probability of 1–5%. Three months of chest CT monitoring and/or positron emission tomography (PET)/CT imaging and/or a non-surgical biopsy are required for a malignancy probability of 5–30%. PET/CT imaging and/or a non-surgical biopsy should be applied for a malignancy probability of 30–65%, while PET/CT imaging and/or a non-surgical biopsy and/or surgical resection are needed for a malignancy probability of 65– 90%.[5] Furthermore, the early symptoms of lung tumors are sometimes unclear. Thus, early diagnosis techniques and markers have become a major focus of current lung cancer research.[20]
Several techniques and markers for early diagnosis have been used in the clinical setting, including genomics, proteomics, transcriptomics, and metabolomics.[20] Metabolomics is a specific field of molecular biology that examines the body’s biochemical reactions under the regulation of proteins and genes.[20,21] More specifically, it evaluates small molecule compounds (molecular weight ≤1500 Da) produced during metabolic processes.[20,22,23] Metabolomics has been used to identify biomarkers for many different cancer types, including breast,[24] lung,[25] bladder,[26] colorectal,[27] and gastric,[28] as well as some other tumor types.[29] Various sample types can be used for metabolomics analysis, such as serum, saliva, sputum, plasma, urine, and even breath.[30,31] In the present study, we used liquid chromatography-tandem mass spectrometry (LC-MS/MS) technology and ultra-performance liquid chromatography-mass spectrometry (UPLC-MS) based on untargeted and targeted metabolomics techniques to screen for differential metabolites and key metabolic pathways between malignant nodules and normal lung (NL) tissues.
MATERIAL AND METHODS
Study design
From December 2021 to December 2022, 45 patients with primary GGN and who were willing to undergo surgery at the First Affiliated Hospital of Soochow University were recruited for the study. The inclusion criteria were as follows: (1) diagnosis of GGN based on the Chinese expert consensus for the diagnosis and treatment of pulmonary nodules (2018 Edition)[32] and (2) the patient was examined in our hospital and complete clinical data was available. The exclusion criteria were as follows: (1) detection of pulmonary inflammation, hematological disease, disease that can cause abnormal blood indicators, malignant tumors in other body parts, or immune system disease; (2) prior lung surgery or other recent surgery; (3) absence of diagnosis of any other lung disease; and (4) incomplete clinical data. All participants underwent video-assisted thoracoscopic surgery for segmental or wedge resection of the lung. For each participant, tissue samples were taken from the lesion site and 3 cm away from the lesion site. Only one cancer sample was taken from each patient. According to Zhang et al.,[33] GGNs are considered inert tumors due to their biological behavior. They can be stable, inactive, and not exhibit aggressive behavior. NL tissue located 3 cm away from the lesion was also taken. Thus, a total of 90 tissue samples from 45 patients were collected for pathological examination, with the results showing 35 LUAD samples (13 IAC, 14 MIA, and 8 AIS), 10 benign samples, and 45 NL tissues. For the untargeted metabolomics technique, 25 LUAD samples were assigned as the case group and 30 NL tissues as the control group. For the targeted metabolomics technique, ten LUAD samples were assigned as the case group and 15 NL tissues as the control group. The grouping details are shown in Figure 1.
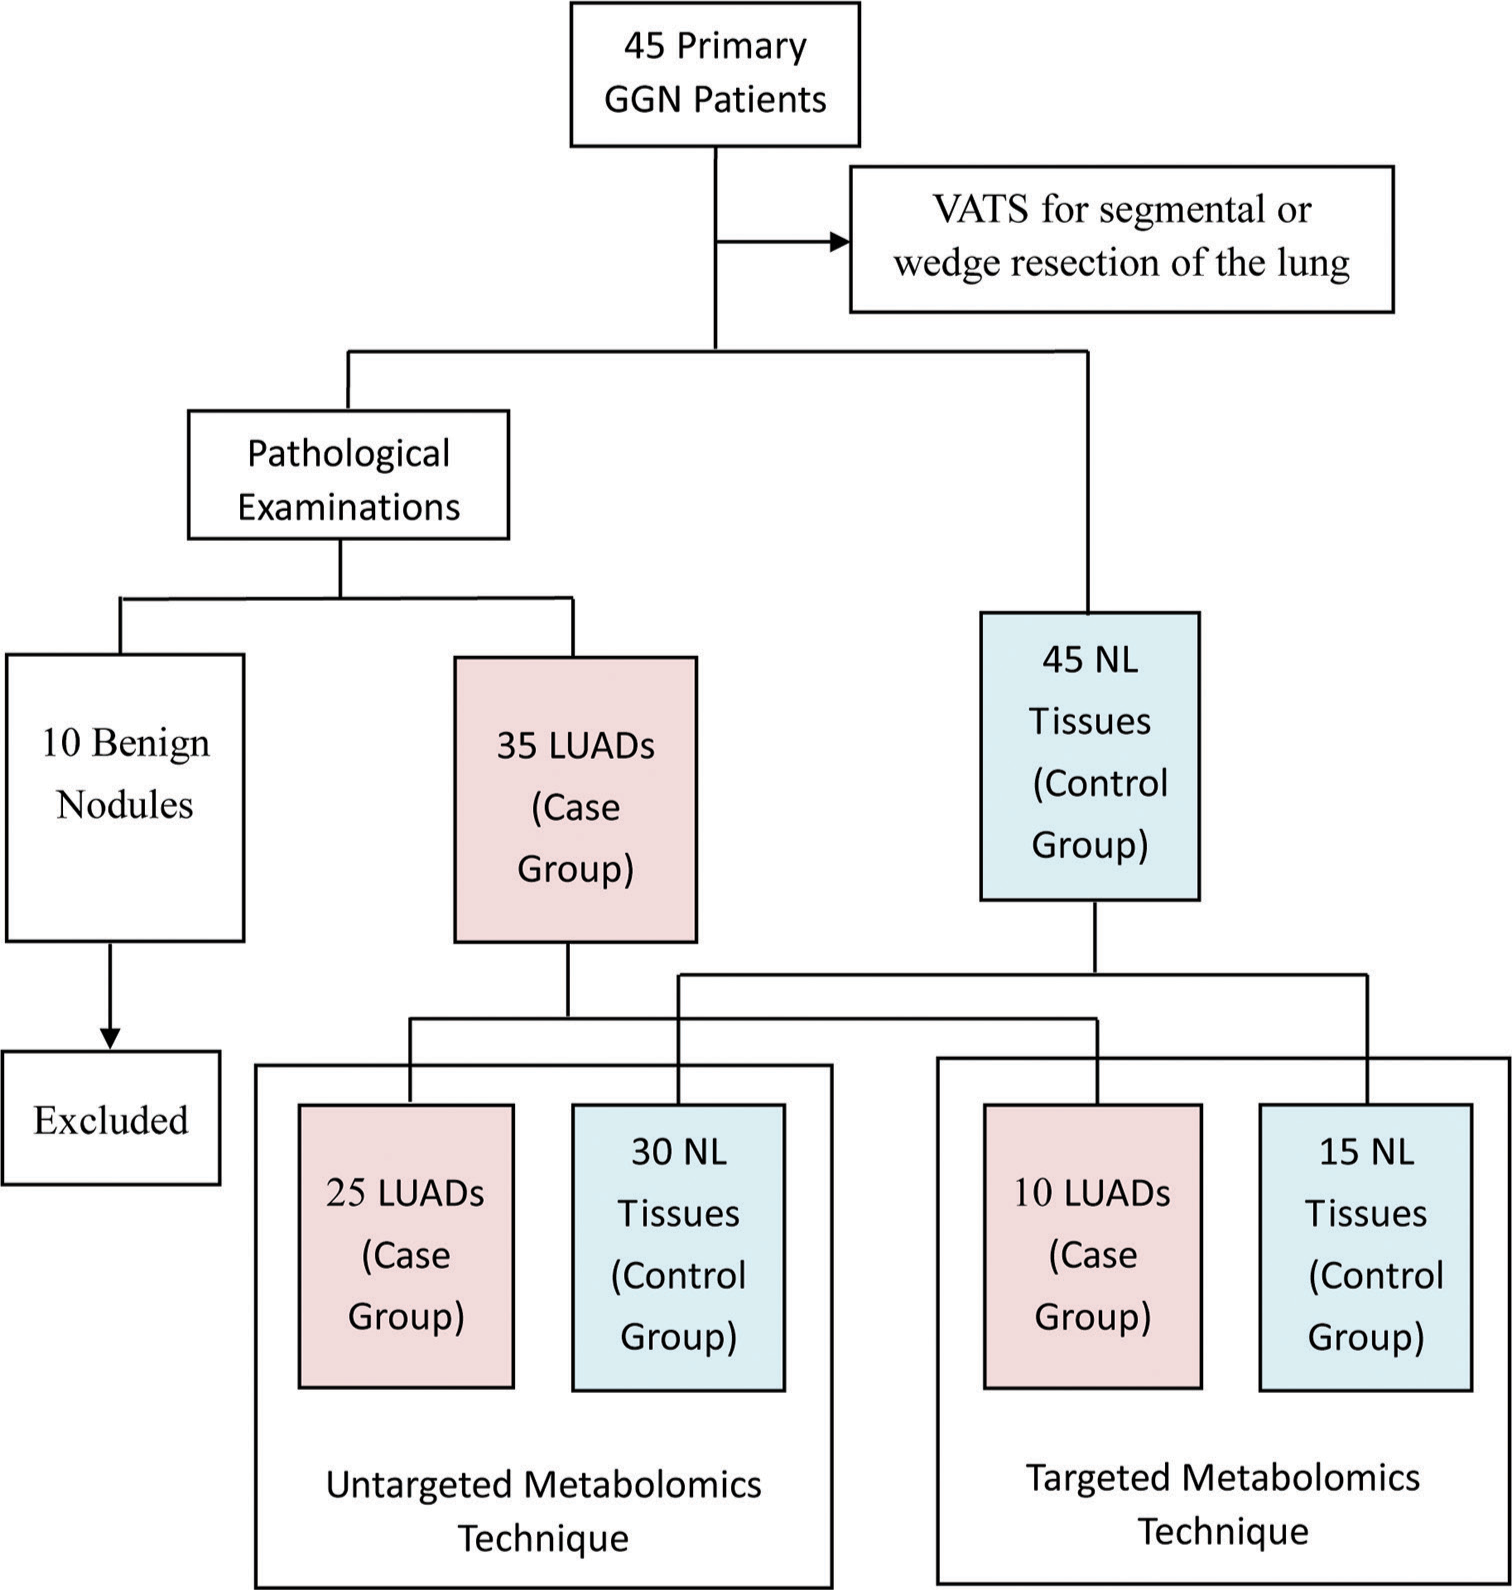
- Flow chart showing the study overview, study design, and grouping information. (GGN: Ground-glass nodules, VATS: Video-assisted thoracoscopic surgery, LUADS: Lung adenocarcinomas, NL: Normal lung).
Major instruments and reagents
The following instruments were used: UPLC from Waters 2D UPLC (Waters, USA); high-resolution mass spectrometer (Q Exactive) from Thermo Fisher Scientific, USA; low-speed cryogenic universal centrifuge (Centrifuge 5430) from Eppendorf, Germany; vortex mixer (QL-901) from Kylin-bell Lab Instruments Co., Ltd., China; ultrapure water systems (Milli-Q Integral) from Millipore Corporation, USA; vacuum concentrator (Maxi Vacbeta) from Gene Company; and tissue lyser (Jxfstprp) from Shanghai Jingxin Industrial Development Co., Ltd, China. The following reagents were used: Acetonitrile (A996-4) and MS-grade methanol (A454-4) from Thermo Fisher Scientific, USA; formic acid (50144-50 mL) from DIMKA, USA; and ammonium formate (17843-250G) from Honeywell Fluka, USA.
Sample extraction
Untargeted metabolomics
A 25 mg sample from both 25 LUAD tissue samples and 30 NL tissue samples were taken as the specimen samples. Samples were thawed at 4°C and 800 µL of precooled extraction reagent (methanol: acetonitrile: water [2:2:1, v/v/v]) was added directly to 25 mg of tissue. For quality control (QC) of the sample preparation, internal standards mix 1 and internal standards mix 2 were used. Samples were homogenized for 5 min using TissueLyser (JXFSTPRP, China), followed by 10 min of sonication and 1 h of incubation at −20°C. Following centrifugation (15 min at 25,000 rpm, 4°C), the supernatant from the samples was collected for vacuum freeze drying. After centrifuging for 15 min at 25,000 rpm with the metabolites resuspended in 200 µL of 10% methanol, the supernatants were transferred to autosampler vials for LC-MS analysis. To test the consistency of the entire LC-MS analysis, a QC sample was created by pooling the same volume of each sample.
Targeted metabolomics
A 50% water/methanol solution (140 µL) was added to an appropriate amount of sample for extraction. After crushing, centrifuging was performed to obtain the supernatant and a derivatization reaction was then performed on the samples and QC sample. The samples and QC sample were diluted with HM400 diluent, centrifuged for 10 min, and the supernatant taken for UPLC-MS analysis.
LC-MS/MS analysis
Chromatographic conditions
Waters, USA was used for sample extraction. A high-resolution mass spectrometer (Q Exactive; Thermo Fisher Scientific, Waltham, MA, USA) with a heated electrospray ionization source and operated by the Xcalibur 2.3 software program (Thermo Fisher Scientific, Waltham, MA, USA) was used. A Waters ACQUITY UPLC BEH C18 column (1.7 µm, 2.1 mm × 100 mm, Waters, USA) maintained at 45°C was used for chromatographic separation. In the positive mode, the mobile phase included 0.1% formic acid (A) and 100% acetonitrile (B). In the negative mode, the mobile phase included 10 mM each of ammonium formate (A) and acetonitrile (B). The gradient conditions were as follows: 0–1 min, 2% B; 1–9 min, 2–98% B; 9–12 min, 98% B; 12–12.1 min, 98% B–2% B; and 12.1–15 min, 2% B. The flow rate was 0.35 mL/min and the volume of injection was 5 µL.
MS conditions
The mass spectrometric settings in positive/negative ionization modes were as follows: spray voltage (3.8/−3.2 kV); sheath gas flow rate (40 arbitrary units [arb]); aux gas flow rate (10 arb); aux gas heater temperature (350°C); and capillary temperature (320°C). The resolution was 70000 full width at half maximum (FWHM) and the full scan range was 70–1050 m/z. With a maximum ion injection time of 100 ms, the automatic gain control (AGC) objective for MS acquisitions was set to 3e6. The top three precursors with a maximum ion injection time of 50 ms and a resolution of 17,500 FWHM were chosen for future MS/MS fragmentation. The AGC was 1e5, and 20, 40, and 60 eV stepped normalized collision energies were chosen.
UPLC-MS analysis
Chromatographic conditions
A Waters UPLC I-Class Plus (Waters, USA) was used for sample extraction. Waters, USA maintained at 40°C was used for chromatographic separation. The mobile phase included ultra-pure water (A) and 30% acetonitrile (B). The gradient conditions were: 0–1 min, 5% B; 1–5 min, 5–30% B; 5–9 min, 30–50% B; 9–11 min, 50–78% B; 11–13.5 min, 78–95% B; 13.5–16 min, 95–100% B; and 16.1–18 min, 5% B. The flow rate was 0.4 mL/min.
MS conditions
Source parameters for the QTRAP 6500 Plus equipped with an electrospray ion (ESI) Turbo Ion-Spray interface were set as follows: source temperature (500°C); ion spray voltage (IS) (4500 V in positive mode) or (−4500 V in negative mode); and ion source gas I (GS1) (40 psi), gas II (GS 2) (40 psi), and curtain gas (20 psi). MS mode methods were set at schedule mode with MS mode transitions, collision energy, declustering potential energy, and retention time for target metabolites.
Metabolomics data processing
Compound discoverer 3.1 (Thermo Fisher Scientific, USA) software was used to process the LC-MS/MS data, primarily for peak extraction, peak alignment, and compound identification. A self-developed metabolomics R package (meta X) was used for data pre-processing, statistical analysis, metabolite classification, and functional annotations. Principal component analysis (PCA) was performed to assess groupings, trends, and outliers among the observed variables in the data set. Log2 logarithmic transformation and Pareto scaling were used to calculate the principal component. The differential metabolite screening was completed by partial least squares method discriminant analysis (PLS-DA). The risk of model overfitting was evaluated by the orthogonal PLSDA (OPLS-DA) model, and 200 times re-collection modeling was utilized for good reproducibility. The metabolites with variable importance in projection (VIP) values >1, fold-change (FC) ≥1.2 or ≤0.83, and P < 0.05 (two-tailed Student’s t-test) were defined as significantly different metabolites.
To confirm the key pathways connected to the metabolic phenotype, a metabolic pathway enrichment analysis was performed using the KEGG website (www.genome.jp/kegg/).
Statistical analysis
Excel software was used for clinical data entry and organization. Data were analyzed using SPSS 17.0 software. Numerical data were represented using the mean ± standard deviation, and count data were represented using frequency counts.
RESULTS
Clinical information
Participant characteristics including gender, age, nodule size, nodular side, and nodule nature are presented in Table 1. A total of 45 GGN patients were included, comprising 35 LUAD (13 IAC, 14 MIA, and eight AIS) and ten benign nodule cases. The mean age of LUAD patients was 54.74 ± 13.80 years, with six males and 29 females. The location of nodules in LUAD patients was 23 on the right and 12 on the left, with a mean size of 1.39 ± 0.61 mm. Twelve patients had pure GGNs and 23 had part-solid GGNs. Concerning smoking status, 13 were current smokers, five were ex-smokers, and 17 were non-smokers. Of the total cases, 18 were epidermal growth factor receptor (EGFR) mutation-positive [Figure 2a], and 17 were EGFR mutation-negative [Figure 2b]. Two cases were positive for anaplastic lymphoma kinase (ALK) and 33 were negative.
| Clinical variables | LUAD patients (n=35) | Benign nodule patients (n=10) | |||
|---|---|---|---|---|---|
| Total | IAC (n=13) | MIA (n=14) | AIS (n=8) | ||
| Gender (n, %) | |||||
| Male | 6 (17.14) | 4 (66.67) | 1 (16.67) | 1 (16.67) | 6 (60.00) |
| Female | 29 (82.86) | 9 (31.03) | 13 (44.83) | 7 (24.14) | 4 (40.00) |
| Age (years) | 54.74±13.80 | 59.31±13.00 | 56.36±14.00 | 44.50±10.31 | 58.00±15.71 |
| Nodule size (mm) | 1.39±0.61 | 1.79±0.67 | 1.20±0.43 | 1.07±0.48 | 3.62±4.01 |
| Nodule side (n, %) | |||||
| Right | 23 (65.71) | 7 (30.43) | 12 (52.17) | 4 (17.39) | 4 (40.00) |
| Left | 12 (34.29) | 6 (50.00) | 2 (16.67) | 4 (33.33) | 6 (60.00) |
| Nodule nature (n, %) | |||||
| Pure GGN | 12 (34.29) | 2 (16.67) | 3 (25.00) | 7 (58.33) | 0 |
| Part-solid GGN | 23 (65.71) | 11 (47.83) | 11 (47.83) | 1 (4.35) | 5 (50.00) |
| Solid GGN | 0 | 0 | 0 | 0 | 5 (50.00) |
| Smoking status (n, %) | |||||
| Current smoker | 13 (37.14) | 4 (30.77) | 5 (38.45) | 4 (30.77) | 2 (20.00) |
| Ex-smoker | 5 (14.29) | 2 (40.00) | 2 (40.00) | 1 (20.00) | 2 (20.00) |
| Non-smoker | 17 (48.57) | 7 (41.18) | 7 (41.18) | 3 (17.65) | 6 (60.00) |
| EGFR mutation (n, %) | |||||
| Positive | 18 (51.43) | 11 (61.11) | 6 (33.33) | 1 (5.56) | 3 (30.00) |
| Negative | 17 (48.57) | 2 (11.76) | 8 (47.06) | 7 (41.18) | 7 (70.00) |
| ALK (n, %) | |||||
| Positive | 2 (5.71) | 1 (50.00) | 1 (50.00) | 0 | 0 |
| Negative | 33 (94.29) | 12 (36.36) | 13 (39.39) | 8 (24.25) | 10 (100.00) |
LUAD: Lung adenocarcinoma, IAC: Invasive adenocarcinoma, MIA: Minimally invasive adenocarcinoma, AIS: Adenocarcinoma in situ, SD: Standard deviation, EGFR: Epidermal growth factor receptor, ALK: Anaplastic lymphoma kinase, GGN: Ground-glass nodule. N: Numbers
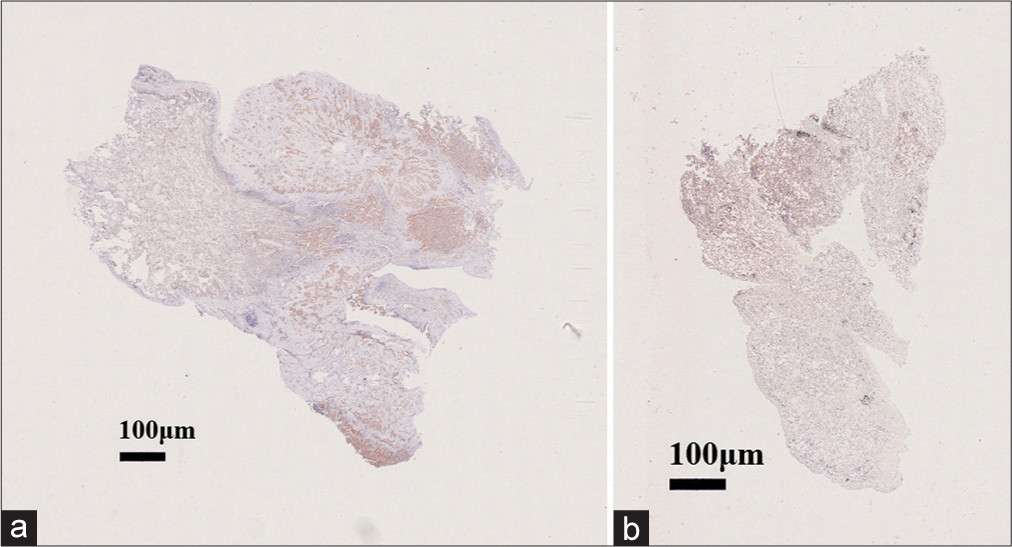
- Lung tissue cells stained with hematoxylin and eosin with magnification 40x. (a) Epidermal growth factor receptor (EGFR) mutation-positive with magnification 40x and (b) EGFR mutation-negative with magnification 40x.
Untargeted metabolomics
Significantly altered metabolites and their relative changes across groups
All samples from the LUAD case group, NL tissue control group, and QC group were examined by PCA modeling to visualize their distribution [Figure 3a-d]. A PCA model was established between the comparative analysis groups (LUAD and NL tissue samples) to observe the distribution and separation trend for the two groups. The data were log2 converted before the PCA model was established, with data scaled using the Pareto scaling method. Some overlap was observed in scattered sample points, but a clear trend for separation was evident, indicating a significant difference between the groups in both positive and negative ion modes [Figure 3c and d]. PLS-DA was then performed to visualize the separation of samples. Unlike PCA, PLS-DA is a supervised statistical method, allowing differences between classification groups to be reflected to the greatest extent. The PLS-DA model between the comparative group (LUAD and NL tissue samples) was established after log2-log conversion of the data, with the Par method used for scaling. A 7-fold cross-validation was performed during modeling. To evaluate the model, the PLS-DA model were subjected to 200 response permutation tests (RPTs). Some overlap in scattered sample points was observed, but a clear trend of separation was again evident, indicating a significant difference between the groups in both positive and negative ion modes [Figure 4a and b]. In positive ion mode, R2Y was 0.87 and Q2 was 0.38. In negative ion mode, R2Y was 0.82 and Q2 was 0.36. The results showed a good match with acceptable predictive power, with no overfitting identified [Figure 4c and d, Table 2].
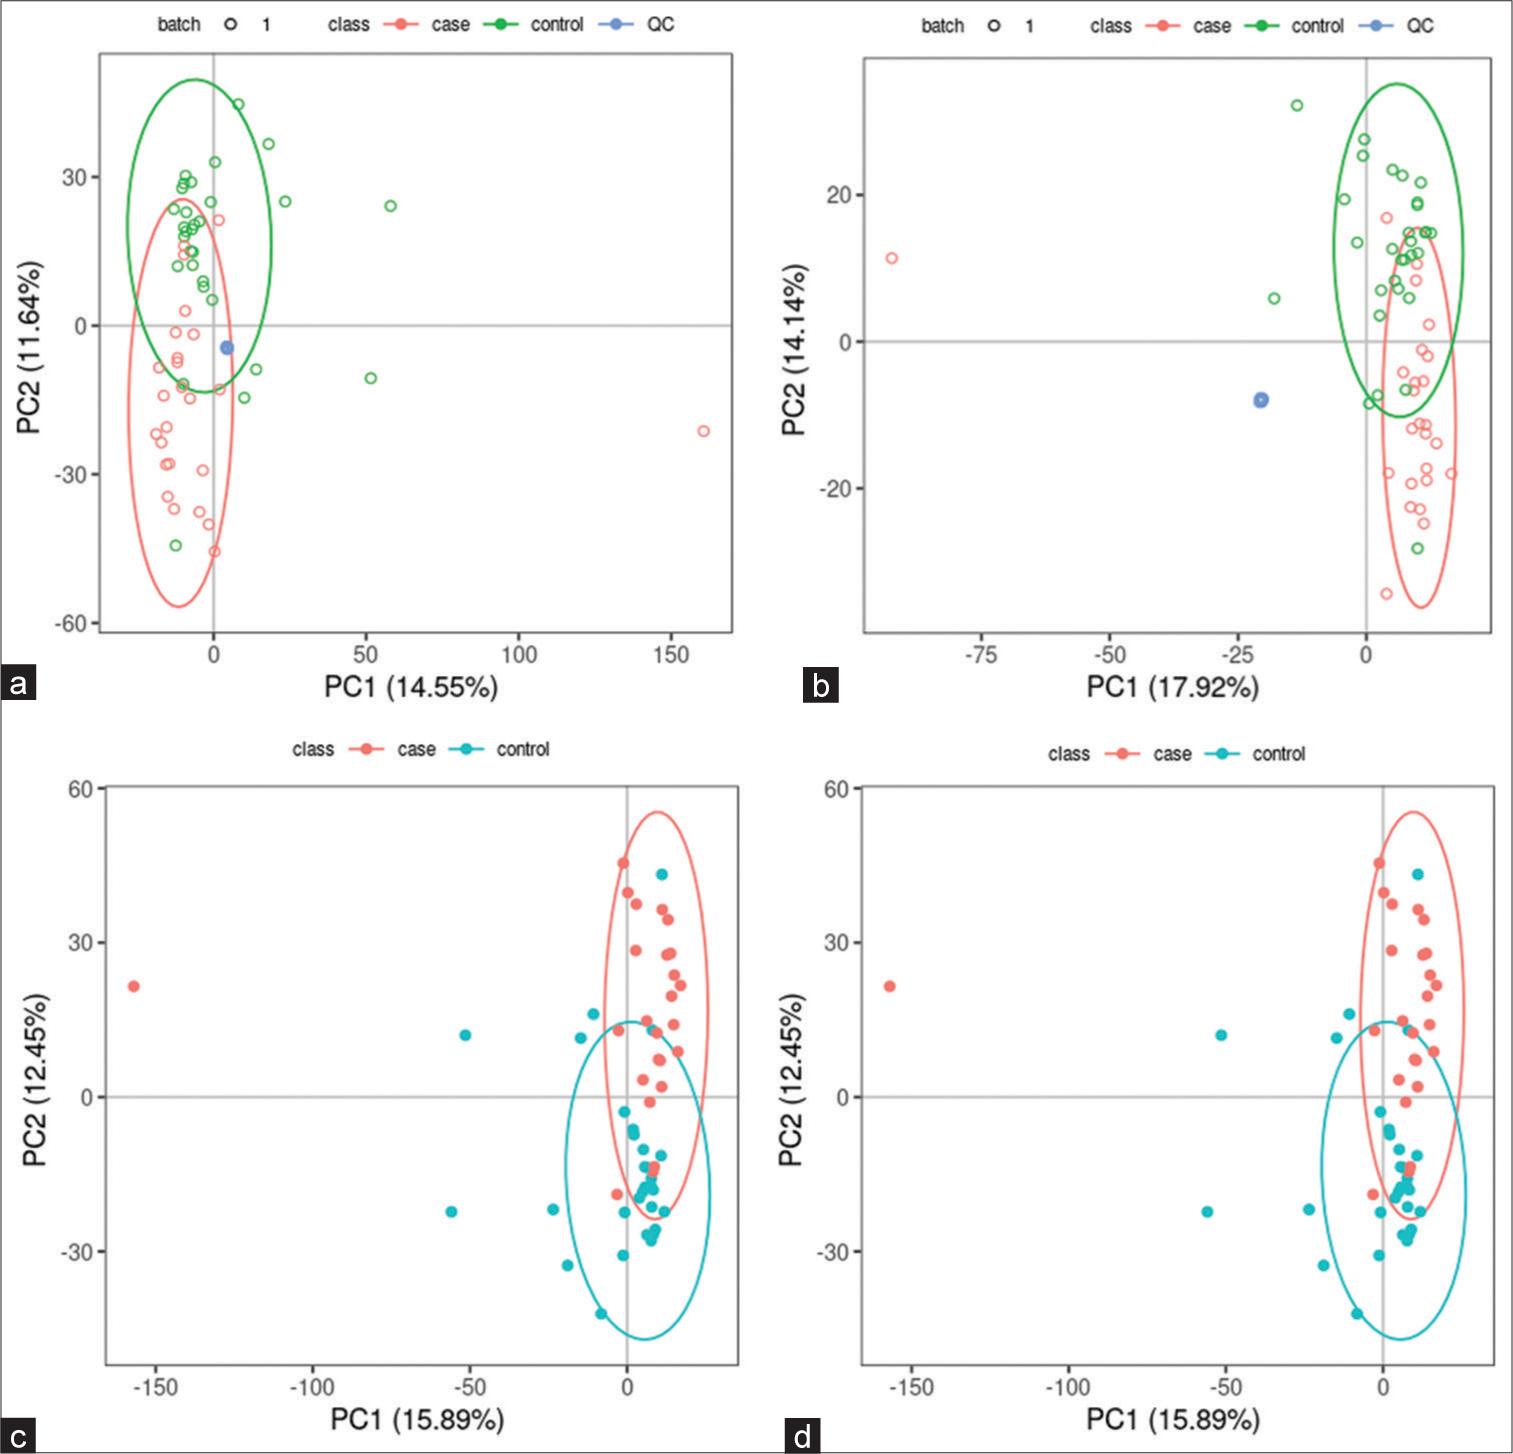
- Principal component analysis (PCA) model of lung adenocarcinoma (LUAD) samples (case group), normal lung (NL) tissues (control group), and quality control (QC) group. (a) PCA model of LUAD samples (case group) with 95%CI (confidence intervals) (red circle), NL tissues (control group) with 95%CI (green circle), and QC group in positive ion mode, (b) PCA model of LUAD samples (case group) with 95%CI (red circle), NL tissues (control group) with 95%CI (green circle), and QC group in negative ion mode, (c) PCA model of LUAD samples (case group) with 95%CI (red circle) and NL tissues (control group) with 95%CI (blue circle) in positive ion mode, and (d) PCA model of LUAD samples (case group) with 95%CI (red circle) and NL tissues (control group) with 95%CI (blue circle) in negative ion mode. (PC1: Principal Component 1, PC2: Principal Component 2).
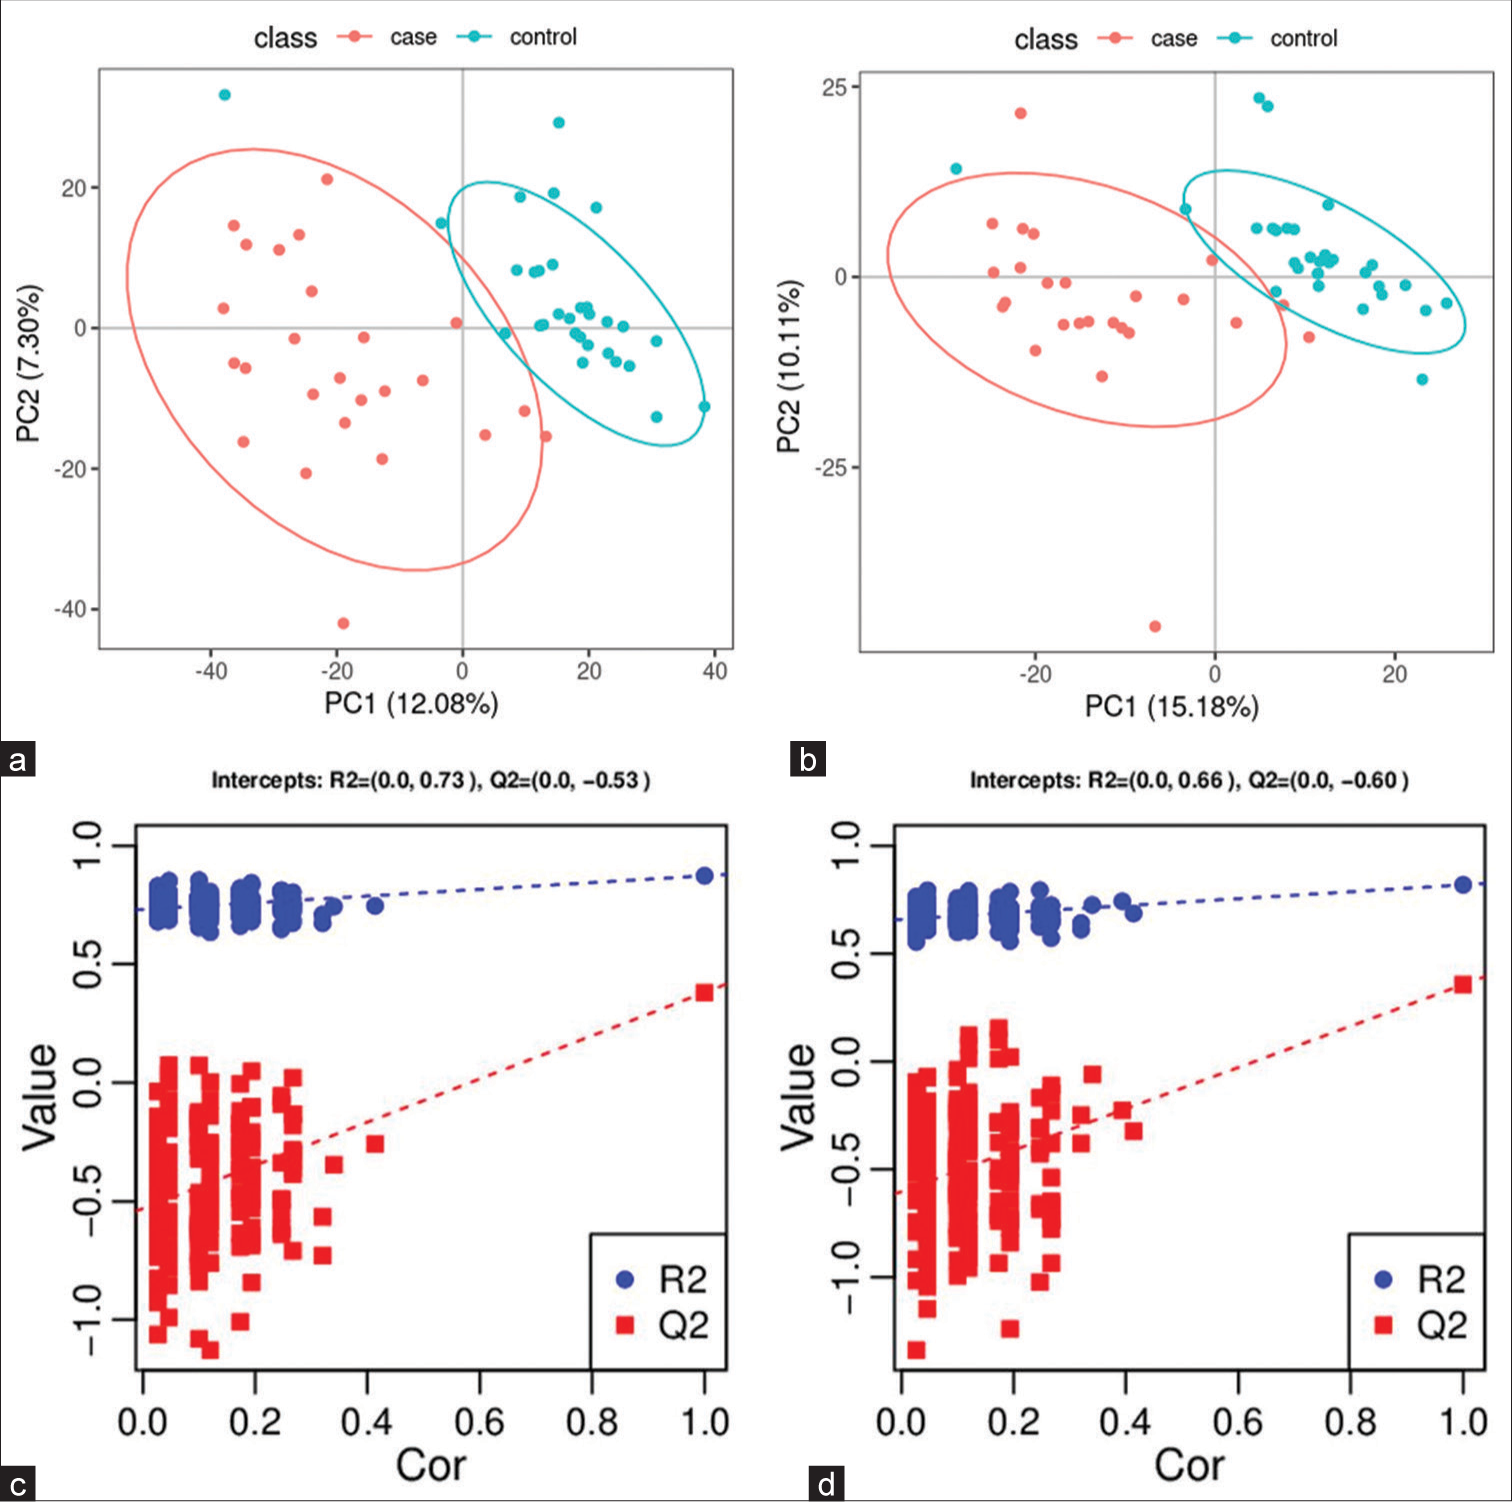
- Partial least squares method discriminant analysis (PLS-DA) model of lung adenocarcinoma (LUAD) samples (case group) and normal lung (NL) tissues (control group). (a) Principal component analysis model of LUAD samples (case group) with 95%CI (confidence intervals) (red circle) and NL tissues (control group) with 95%CI (blue circle) in positive ion mode, (b) PLS-DA model of LUAD samples (case group) with 95%CI (red circle) and NL tissues (control group) with 95%CI (blue circle) in negative ion mode, (c) A 200 times permutation test of PLS-DA models for (a), and (d) A 200 times permutation test of PLS-DA models for (b). In general, if Q2 obtained from the displacement test is less than Q2 of the model, and a red dotted line is upward sloping and the intercept between Q2 and the longitudinal axis is less than 0, this indicates that the model is good and has no overfitting. The blue dotted line indicates the dividing line between the different categories of data points. (PC1: Principal Component 1, PC2: Principal Component 2, R2: the intercepts of the Y axis of the regression line of R2 during permutation experiment, Q2: the intercepts of the Y axis of the regression line of Q2 during permutation experiment. Cor: correlation coefficient).
| Mode | R2Y (cum) | Q2 (cum) | R2 | Q2 |
|---|---|---|---|---|
| Positive | 0.87 | 0.38 | (0.0, 0.73) | (0.0,−0.53) |
| Negative | 0.82 | 0.36 | (0.0, 0.66) | (0.0, −0.60) |
PLS-DA: Partial least squares method discriminant analysis, LUAD: Lung adenocarcinoma, NL: Normal lung, R2Y(cum): Interpretation rate for Y matrix, Q2(cum): predictive ability, R2: the intercepts of the Y axis of the regression line of R2 during permutation experiment, Q2: the intercepts of the Y axis of the regression line of Q2 during permutation experiment.
Screening for differential metabolites between LUAD and NL tissue groups
Data were subjected to Fold Change (FC) analysis to obtain the FC value. P-value was obtained by Student’s t-test, with correction for a false discovery rate to obtain the q-value. A total of 850 differential metabolites were identified between the two groups (589 in positive ion mode and 261 in negative mode). Among the 589 differential metabolites identified in positive ion mode were 40 organic acids and their derivatives, 15 organo heterocyclic compounds, 15 benzenoids, 12 organic nitrogen compounds, nine alkaloids and their derivatives, seven nucleosides/nucleotides and their analog, four organic oxygen compounds, two lipids and lipid-like molecules, two phenylpropanoids and polyketides, one homogeneous non-metal compound, one nucleic acid, one peptide, one sphingolipid, one terpenoid, and one vitamin/cofactor. The remaining 477 differential metabolites had no name. [Supplementary Table 1] lists the differential metabolites found in positive ion mode. Among the 261 differential metabolites identified in negative ion mode were 17 organic acids and their derivatives, eight benzenoids, six organic oxygen compounds, five lipids and lipid-like molecules, five nucleosides/nucleotides and their analogs, four phenylpropanoids and polyketides, three organo heterocyclic compounds, one alkaloid or derivative, one fatty acyl, one homogeneous non-metal compound, and one polyketide. The remaining 209 differential metabolites had no name. [Supplementary Table 2] lists the differential metabolites found in negative ion mode.
Metabolic pathways
A metabolic pathway enrichment analysis of differential metabolites was performed based on the KEGG database. In the positive ion mode, 130 metabolic pathways with P < 0.05 were significantly enriched by the differential metabolites, while in the negative ion mode, 56 metabolic pathways were identified. The positive ion mode revealed a total of 66 differential metabolic pathways and 130 differential metabolites. The top three pathways with enriched scores in the positive ion mode included metabolic pathways (23 metabolites), purine metabolism (five metabolites), and biosynthesis of amino acids (five metabolites). The negative ion mode revealed a total of 21 differential metabolic pathways and 56 differential metabolites. The top three pathways with enriched scores in the negative ion mode included metabolic pathways (13 metabolites), 2-oxalic acid metabolism (four metabolites), and glucagon signaling pathway (three metabolites) [Figure 5a and b].
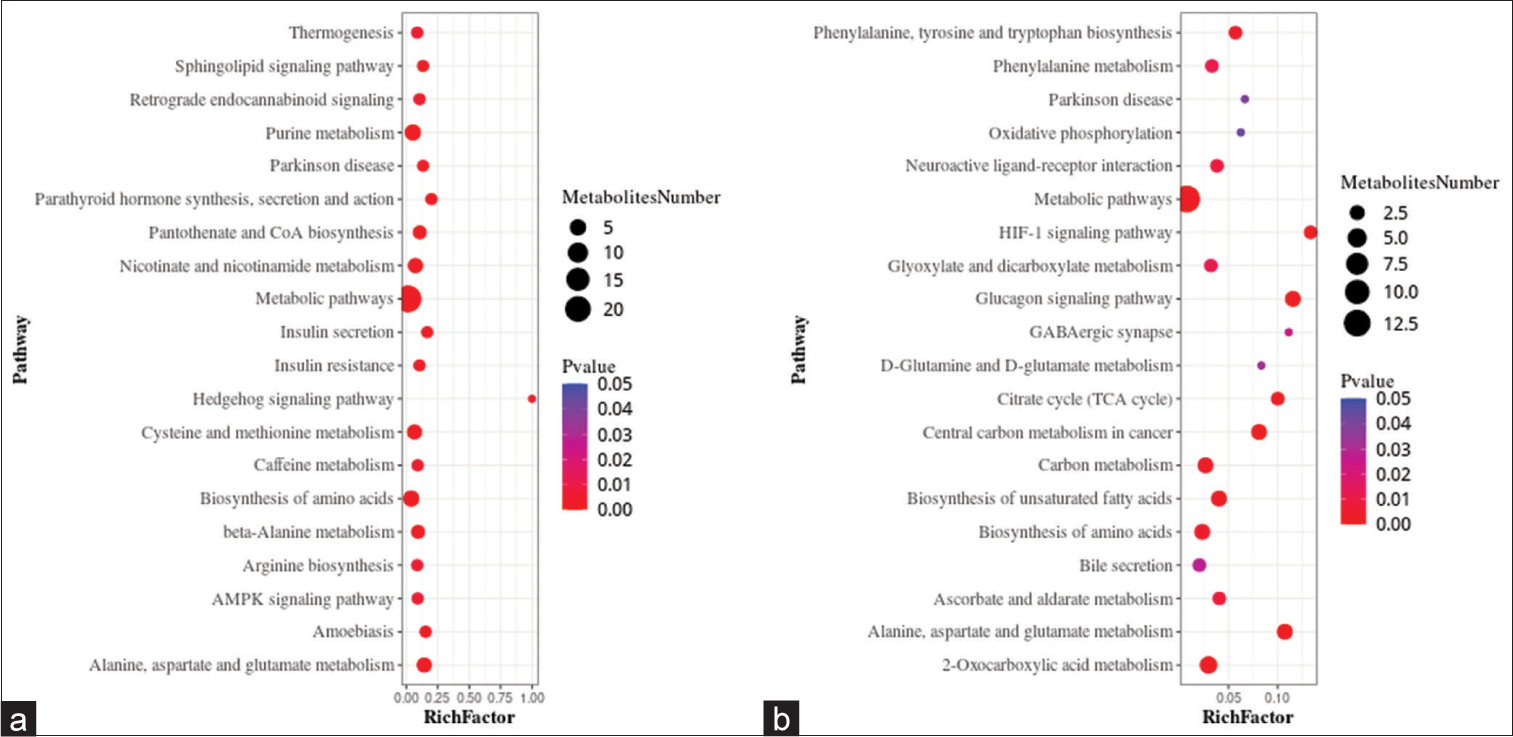
- Bubble plots showing the results of metabolic pathway enrichment analysis using the untargeted metabolomics technique. (a) positive ion mode, and (b) negative ion mode. AMPK: AMP-activated protein kinase (AMPK), HIF: Hypoxia-inducible factor, GABAergic: Gamma-aminobutyric acid (GABA)-ergic.
Targeted metabolomics
Significantly altered metabolites and their relative changes across groups
A PCA model was established to examine the distribution and separation between LUAD and NL tissue groups. The results of PCA analysis showed overlap in scattered sample points [Figure 6a]. Next, a supervised PLS-DA model was performed, with the results also showing some overlap in scattered sample points but still a clear trend of separation [Figure 6b]. OPLS-DA was performed on the two groups of biological samples to establish the relationship model between metabolite level and sample categories, thus enabling the prediction of sample categories. The results of the OPLSDA analysis [Figure 6c] showed no overlap in the scattered sample points and a clear trend for separation. To judge the quality of the model without fitting risk, 200 RPTs were performed with the OPLS-DA model. The results showed an R2Y of 0.865 and Q2 of 0.604 [Figure 6d and Table 3].
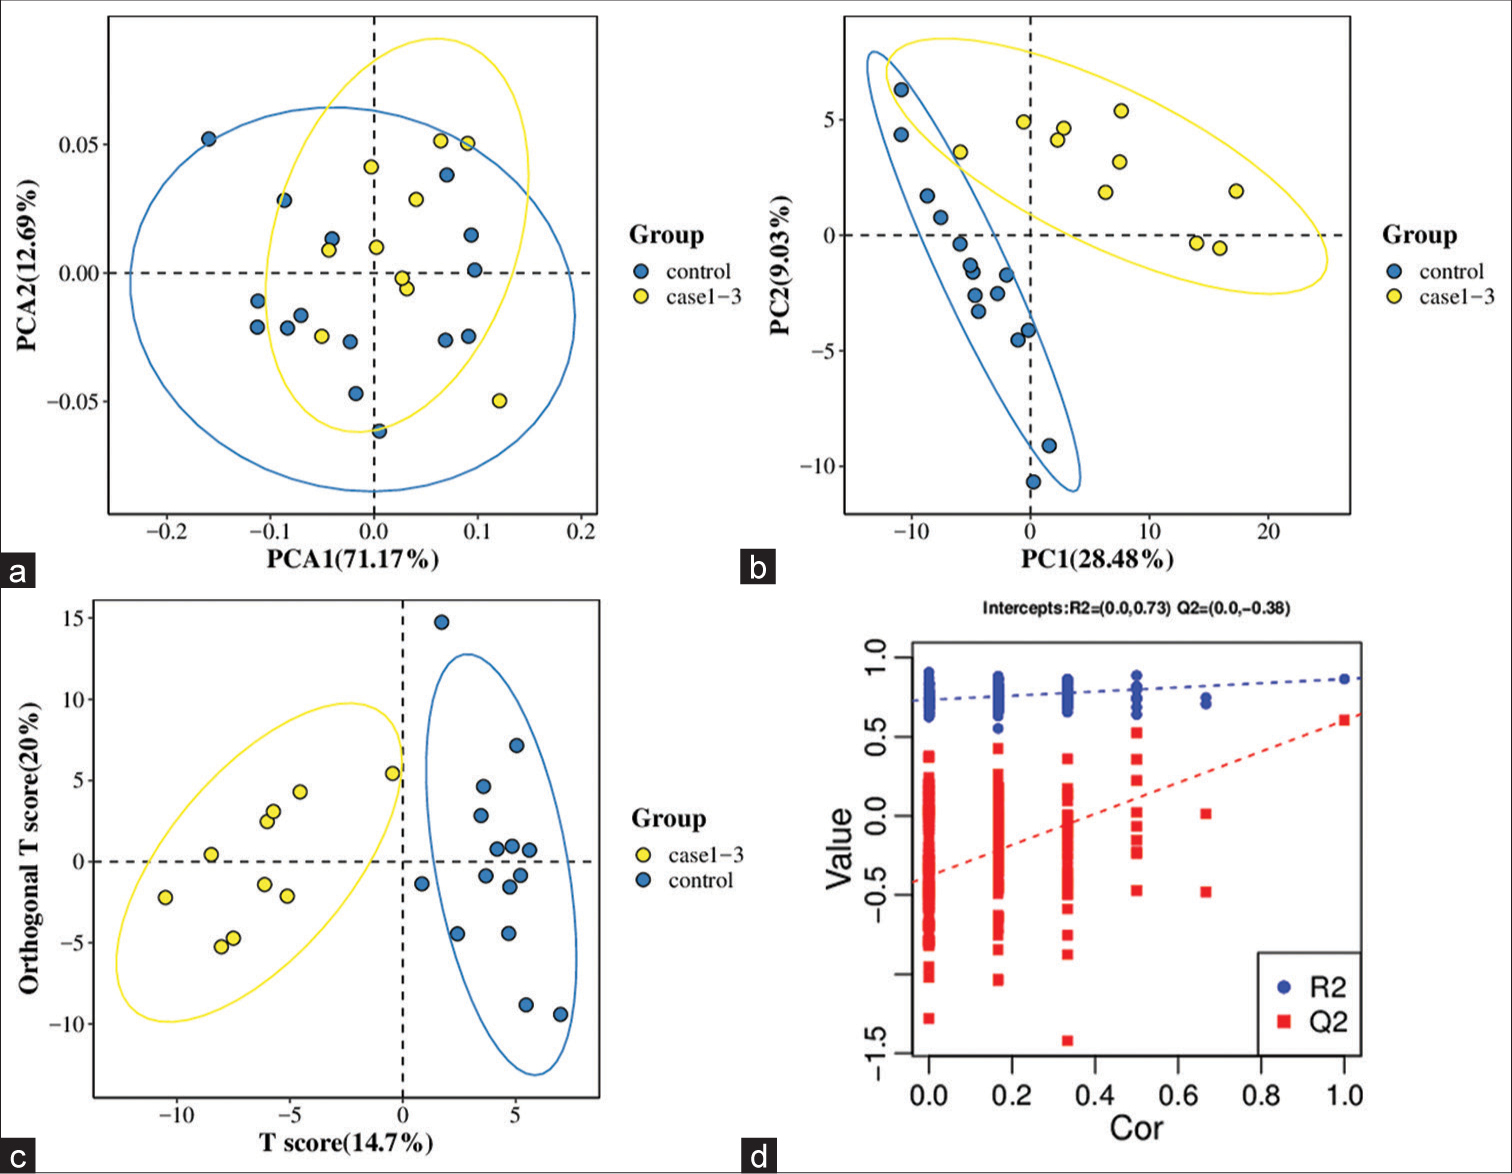
- Significantly altered metabolites and their relative change across groups. (a) Principal component analysis model between lung adenocarcinoma (LUAD) samples (case group) with 95%CI (confidence intervals) (yellow circle) and normal lung (NL) tissues (control group) with 95%CI (blue circle), (b) partial least squares method discriminant analysis (PLS-DA) model between LUAD samples (case group) with 95%CI (yellow circle) and NL tissues (control group) with 95%CI (blue circle), (c) orthogonal PLS-DA (OPLS-DA) model between LUAD samples (case group) with 95%CI (yellow circle) and NL tissues (control group) with 95%CI (blue circle), and (d) results of the 200 times permutation test of the OPLS-DA model for (c). In general, if Q2 obtained from the displacement test is less than Q2 of the model, and a red dotted line is upward sloping and the intercept between Q2 and the longitudinal axis is less than 0, this indicates that the model is good and has no overfitting. The blue dotted line indicates the dividing line between the different categories of data points. (PCA1:Principal Component Analysis 1, PCA2: Principal Component Analysis 2, PC1: Principal Component 1, PC2: Principal Component 2, R2: the intercepts of the Y axis of the regression line of R2 during permutation experiment, Q2: the intercepts of the Y axis of the regression line of Q2 during permutation experiment. Cor: correlation coefficient).
| Statistical Results | R2Y (cum) | Q2 (cum) | R2 | Q2 |
|---|---|---|---|---|
| 0.865 | 0.604 | (0.0,0.73) | (0.0,−0.38) |
OPLS-DA: Orthogonal PLS-DA, LUAD: Lung adenocarcinoma, NL: Normal lung, R2Y(cum): Interpretation rate for Y matrix, Q2(cum): predictive ability, R2: the intercepts of the Y axis of the regression line of R2 during permutation experiment, Q2: the intercepts of the Y axis of the regression line of Q2 during permutation experiment.
Independent validation using a smaller subset strengthened the validity and applicability of the model’s findings. This provides a way of testing the generalizability and robustness of the model using unseen data, while remaining within the context of the original dataset.
Screening for differential metabolites between LUAD and NL tissue groups
FC and Student’s t-test analyses performed on the data identified 77 differential metabolites. These included 20 fatty acids, 19 amino acids, 13 organic acids, eight benzenoids, six carbohydrates, four bile acids, two carnitines, two phenylpropanoic acids, one indole, one peptide, and one pyridine [Supplementary Table 3].
Metabolic pathways
Metabolic pathway enrichment analysis of differential metabolites was performed based on the KEGG database. A total of 71 metabolic pathways with P < 0.05 were found to be significantly enriched by the differential metabolites. The top three pathways for enrichment included biosynthesis of amino acids (11 metabolites), carbon metabolism (nine metabolites), and central carbon metabolism of cancer (nine metabolites) [Figure 7].
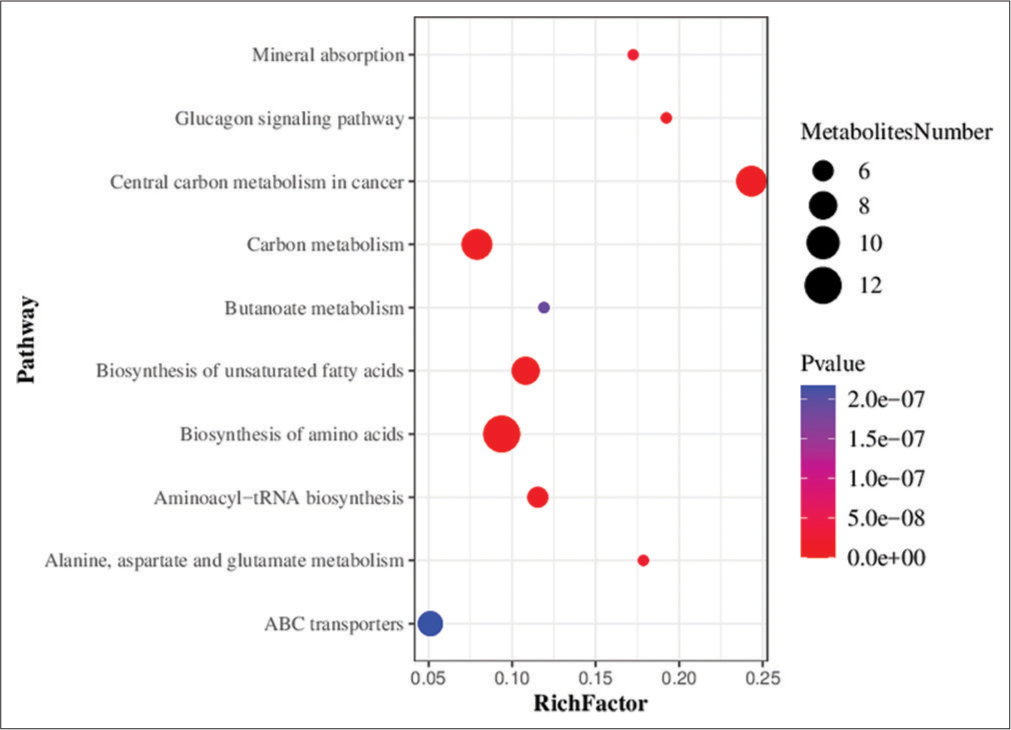
- Bubble chart showing the results of metabolic pathway enrichment analysis using the targeted metabolomics technique. ABC transporters: Adenosine triphosphate binding cassette transporters (ATP-binding cassette transporters, ABC transporters).
DISCUSSION
Lung cancer is a highly complex and heterogeneous disease that exhibits diverse genetic alterations in its different histological classes.[34] The genome of cancerous cells and tissues varies slightly among cancer patients. Although there exist numerous diagnostic markers for genes and proteins, these do not provide an accurate and feasible option for diagnosis due to the heterogeneity of cancer cells within individual patients.[35] Mutations in the tumor suppressor gene TP53 occur in 40–60% of non-small-cell lung cancer (NSCLC) tumors, with a higher incidence of lung cancers from smokers compared to non-smokers.[34] In addition, 2–9% of NSCLCs have genetic changes in the ALK gene.[36] Mutations in exon 19 or 21 of EGFR occur in 15–30% of NSCLC patients.[37] About 30% of LUAD patients also have KRAS mutations. However, in contrast to mutant EGFR or ALK proteins, mutant KRAS is still not a clinically useful target.[38] Consequently, some patients may benefit from these markers while others do not.[35]
Cytological examination of lung tumor samples obtained by different methods has always been an important modality for diagnostic and predictive testing of lung cancer patients. Cytology provides several benefits compared to histology specimens when it comes to the morphological interpretation of cases.[39] These advantages include fewer artifacts, immediate fixation, improved preservation, and clear nuclear and cytoplasmic details in alcohol-fixed preparations. Nonetheless, certain challenges arise when attempting to further subtype a subset of NSCLC cases into squamous cell carcinoma and adenocarcinomas.[39]
The use of metabolomics in cancer research first started about 10 years ago. Along with studies of cancer metabolism, metabolomics has recently emerged as a research hotspot.[20] Metabolomics research has progressed rapidly in recent years and is anticipated to become a new hotspot in the field of lung cancer research. Compared to cytology, metabolomics has the ability to provide a comprehensive view of the metabolic state of a biological system, such as cell culture, biological fluid, and tissue.[40] By analyzing the complete set of metabolites in a sample, metabolomics can reveal changes in biochemical pathways that may not be detected by cytology or other methods. In contrast, cytology is typically better at detecting visible changes in cell morphology or structure that may result from cell abnormalities.[41] Therefore, both methods have their own distinct advantages in cancer diagnosis.
The human organism tightly controls metabolic biochemical reactions. Compared to genes and proteins, such reactions show substantially less difference between individuals.[20] A previous study showed that the ability of tumor cells to metabolize proteins, lipids, and carbohydrates to maintain cell proliferation is significantly altered compared to normal cells.[42] On tumor development, metabolic reprogramming gives cancer cells the ability to endure and grow.[43] Thus, metabolomics shows great promise as a means of finding reliable cancer metabolic markers, especially for tumor types that are difficult to detect in the early stages, such as LUAD.[20]
Targeted and untargeted metabolomics are currently the two metabolomics approaches. Targeted metabolomics can be used to quantify a particular set of metabolites, such as lipids, amino acids, fatty acids, and/or carbohydrates. Moreover, it can be used to examine specific metabolic pathways and to confirm biomarkers that have already been identified. Targeted methods rely on metabolite-specific signals, require a priori knowledge of the chemicals of interest and known metabolites, and do not provide global coverage.[43] Conversely, untargeted metabolomics methods provide a global profile of the metabolome. This method is frequently used for hypothesis-generating research (e.g., biomarker discovery) when full metabolite identification is not the objective.[43,44]
Therefore, targeted metabolomics is often more quantitative, whereas untargeted metabolomics offers more information. In the present study, the metabolomics profile of LUAD patients was evaluated using both targeted and untargeted metabolomics approaches. The results from both approaches revealed clear differences in metabolites between LUAD tissue and NL tissue. Using an untargeted metabolomics approach, a total of 164 differential metabolites were identified, including 110 that were upregulated and 54 that were downregulated. Organic acids and derivatives were the main metabolic differences found by the untargeted approach. Furthermore, 77 differential metabolites were identified by the targeted metabolomics approach, including 69 that were upregulated and 8 that were downregulated. Fatty acids, amino acids, and organic acids were the major metabolic changes found with the targeted approach.
Organic acids are the final products of metabolic processes and can be utilized as novel biomarkers to assess prognosis, therapy response, and disease progression. Organic acids can also be used as biomarkers to reveal metabolic changes in the tumor and non-tumor tissues of cancer patients.[45] The previous studies reported changes in the concentrations of low-molecular-weight (LMW) organic acids in several cancer types including lung cancer,[46] bladder cancer,[47] and colon carcinoma.[48] Hori et al.[46] conducted a metabolomics study to investigate whether changes in the levels of LMW metabolites were useful for lung cancer diagnosis. These authors reported that organic acids such as lactic acid, fumaric acid, and malic acid were significantly elevated in the serum and tumor tissues of lung cancer patients. This result is consistent with the significant changes found inorganic acids in the present study, where increased levels of L-lactic acid were found in LUAD tissue using both untargeted (VIP = 1.332, FC = 1.678, q = 0.000) and targeted metabolomics (VIP = 1.240, FC = 1.451, q = 0.043). In addition, targeted metabolomics revealed that fumaric acid (VIP = 1.481, FC = 1.764, q = 0.106) and L-malic acid (VIP = 1.376, FC = 1.562, q = 0.012) were also significantly upregulated in LUAD tissue. These organic acids and their derivatives are involved in the tricarboxylic acid (TCA) cycle. The “Warburg effect” means that aerobic glycolysis is the preferred energy source for the majority of cancer cells, as opposed to oxidative phosphorylation.[49] Glutamine also serves as a significant energy source for cancer cells, and glutamine metabolism enables these cells to maintain TCA cycle activity during tumor growth.[46] Thus, the different biological mechanisms for energy production in cancer cells may be the underlying reason for the metabolite changes observed in LUAD.
Fatty acids carry out multiple functions in the body. This crucial energy source is produced in the liver and skeletal muscle and accumulates as triacylglycerol.[50] The body obtains fatty acids through dietary intake and through de novo synthesis.[51] The main functions of fatty acids are to serve as an energy source for the TCA cycle, as building blocks for the synthesis of complex lipids such as sphingolipids, phospholipids, and as intra/extracellular signaling molecules.[50] A previous study investigated a large number of fatty acids as potential markers of lung cancer.[30] The levels of many fatty acids, such as dodecanoic acid and tridecanoic acid, were found to be reduced in cancers. This is consistent with results from the present study, which found that most of the 20 fatty acids examined were downregulated, for example, dodecanoic acid (VIP = 1.416, FC = 0.378, q = 0.043) and tridecanoic acid (VIP = 0.880, FC = 0.780, q = 0.106).
Complex metabolic features such as the Warburg effect and abnormal lipid and amino acid metabolism can be detected in cancer cells. High energy and high biomass are required for cancer cell proliferation.[23] Amino acids have an important effect on cancer cells, and the majority of carbon-based biomass is produced from amino acids. They are also the main source of nitrogen for hexosamines, nucleotides, and other nitrogenous molecules in cancer cells.[52] Furthermore, amino acids can control the protein phosphorylation cascade and gene expression. Some amino acids, including leucine, arginine, and glutamine, can signal mTOR1 to become phosphorylated in a cell-specific manner, thus controlling the conversion of intracellular proteins.[53] However, amino acid metabolism is tightly controlled and linked to various metabolic networks, including lipid and glucose metabolism. Qi et al.[30] carried out a metabolomics investigation to identify various metabolites with different polarities in small amounts of plasma from lung cancer patients. These authors found that the level of certain amino acids was increased in lung cancer patients. A similar study by Ni et al.[53] identified six metabolites that distinguished lung cancer patients from healthy controls, namely, valine, glycine, citrulline, arginine, methionine, and C16-carnitine. In the present study, a minority of amino acids were found to be increased in LUAD samples, which was consistent with the previous reports. Furthermore, the biosynthesis of amino acids was identified as a significantly important metabolic pathway.
Low-dose CT is employed for LUAD screening, as well as for general lung cancer screening. Biopsy or resection procedures are recommended based on various characteristics and the findings of prediction models such as the Herder et al. model[16] and the Brock University model.[18] Without obtaining tissue samples, this study lacks relevance in daily medical practice. Pathological examination of tissue samples provides definitive answers. Decisions regarding lung cancer treatment are currently guided by factors such as TNM staging, histology, and predictive molecular markers.
There is growing interest in the use of liquid biopsies that can potentially identify high-risk individuals suitable for screening programs. This approach may increase the benefits of screening and also prevent unnecessary invasive procedures.
The number of LUAD patients investigated in the present study was relatively small. Confirmation of the clinical importance of untargeted and targeted metabolomics techniques for lung cancer detection will require additional studies on larger patient cohorts. Another limitation of our study is that the “normal” lung tissue samples were obtained from patients with disease. Therefore, these samples may not accurately represent the “normal” tissue in individuals without disease. Ethical considerations prevent the use of invasive procedures, such as open-chest surgeries, on non-diseased individuals solely for the purpose of obtaining normal tissue samples for research. Consequently, it was not possible to obtain completely healthy lung tissue samples from non-diseased individuals. This limits the ability to compare and differentiate between diseased and non-diseased lung tissue samples.
SUMMARY
Lung cancer is a highly complex and heterogeneous disease with diverse genetic alterations. The heterogeneity of cancer cells makes it difficult to accurately diagnose and predict outcomes using gene- or protein-based markers. Metabolomics analyzes the metabolic profile of cancer cells and has emerged as an exciting research area in the study of lung cancer.
The two main approaches in metabolomics are targeted and untargeted. Targeted metabolomics examines specific metabolites or metabolic pathways, while untargeted metabolomics provides a global view of the metabolome. In the present study, both targeted and untargeted metabolomics were used to analyze the metabolomic profile of LUAD patients. Significant differences in metabolites were observed between LUAD tissue and histologically normal tissue. The levels of organic acids and their derivatives, such as lactic acid, fumaric acid, and malic acid, were found to be significantly elevated in LUAD tissue compared to normal tissue. These organic acids are involved in the TCA cycle, which is essential for energy production in cancer cells. Fatty acids serve as energy sources and building blocks for complex lipids and are predominantly downregulated in LUAD tissues. Amino acids are crucial for cell proliferation and as a source of nitrogen. Increased levels of amino acids were found in LUAD samples.
The detection of complex metabolic features, including the Warburg effect and abnormal lipid and amino acid metabolism, provides valuable insight into the pathogenesis of LUAD. Metabolomics could also be used to identify potential biomarkers of prognosis, therapy response, and disease progression.
AVAILABILITY OF DATA AND MATERIALS
The datasets used and/or analyzed during the current study are available from the corresponding author on reasonable request.
ABBREVIATIONS
ABC - Adenosine triphosphate binding cassette
AAH - Atypical adenomatous hyperplasia
AGC - Automatic gain control
AIS - Adenocarcinoma in situ
ALK - Anaplastic lymphoma kinase
AMPK - AMP-activated protein kinase
CT - Computed tomography
EGFR - Epidermal growth factor receptor
ESI - electrospray ion
FC - Fold change
FWHM - full width at half maximum
GABAergic - Gamma-aminobutyric acid (GABA)-ergic
GGN - Ground-glass nodules
IAC - Invasive adenocarcinoma
LC-MS/MS - Liquid chromatography tandem mass spectrometry
LMW - Low-molecular-weight
LUAD - Lung adenocarcinoma
MIA - Minimally invasive adenocarcinoma
NL - Normal lung
NSCLC - Non-small-cell lung cancer
OPLS-DA - Orthogonal partial least squares method discriminant analysis
PCA - Principal component analysis
PET - Positron emission tomography
PLS-DA - Partial least squares method discriminant analysis
QC - Quality control
RPTs - Response permutation tests
RT - Retention time
TCA - Tricarboxylic acid
UPLC-MS - Ultra-performance liquid chromatography mass spectrometry
VIP - Variable importance in projection.
AUTHOR CONTRIBUTIONS
The manuscript was drafted by X Z and J Z. X Z and J Z leaded the team to complete the study’s conceptualization and design, and X T, Y C and J C were involved in this process. X Z was mainly responsible for collecting and evaluating data. Y L, S J and H Z participated in the evaluation of clinical data. X Z and J Z were mainly responsible for analyzing and interpretating the data. C D and Y Z participated in data and information visualization. X Z and J Z revised the manuscript critically for important intellectual content and approved final version to be published. X Z and J Z were accountable for all aspects of the work in ensuring that questions related to the accuracy or integrity of any part of the work are appropriately investigated and resolved. All authors read and approved the final manuscript. All authors have participated sufficiently in the work and agreed to be accountable for all aspects of the work.
ETHICS APPROVAL AND CONSENT TO PARTICIPATE
The study was conducted by following per under the Helsinki Declaration and was approved by the Ethics Committee of first Affiliated Hospital of Soochow University (Ethics File Approval letter of Review Board 2023–176).
Written informed consent was obtained from all the participants prior to the publication of this study.
CONFLICT OF INTEREST
The authors declare no conflict of interest.
EDITORIAL/PEER REVIEW
To ensure the integrity and highest quality of CytoJournal publications, the review process of this manuscript was conducted under a double-blind model (authors are blinded for reviewers and vice versa) through an automatic online system.
FUNDING
Not applicable.
References
- Dependence of radiomic features on pixel size affects the diagnostic performance of radiomic signature for the invasiveness of pulmonary ground-glass nodule. Br J Radiol. 2021;94:20200089.
- [CrossRef] [PubMed] [Google Scholar]
- Global cancer statistics 2020: GLOBOCAN estimates of incidence and mortality worldwide for 36 cancers in 185 countries. CA Cancer J Clin. 2021;71:209-49.
- [CrossRef] [PubMed] [Google Scholar]
- The gut microbiome as a biomarker of cancer progression among female never-smokers with lung adenocarcinoma. Anticancer Res. 2022;42:1589-98.
- [CrossRef] [PubMed] [Google Scholar]
- Tobacco smoking in China: A pulmonary health crisis. Curr Opin Pulm Med. 2019;25:188-91.
- [CrossRef] [PubMed] [Google Scholar]
- Evaluating the patient with a pulmonary nodule: A review. JAMA. 2022;327:264-73.
- [CrossRef] [PubMed] [Google Scholar]
- Correlation of computed tomography quantitative parameters with tumor invasion and Ki-67 expression in early lung adenocarcinoma. Medicine (Baltimore). 2022;101:e29373.
- [CrossRef] [PubMed] [Google Scholar]
- Thoracic tumours, WHO classification of tumours. . ;5 Available from: https://publications.iarc.fr/Book-And-Report-Series/Who-Classification-Of-Tumours/ThoracicTumours-2021 [Last accessd on 2023 Nov 03]
- [Google Scholar]
- Deciphering cell lineage specification of human lung adenocarcinoma with single-cell RNA sequencing. Nat Commun. 2021;12:6500.
- [CrossRef] [PubMed] [Google Scholar]
- Evaluation of the radiomics method for the prediction of atypical adenomatous hyperplasia in patients with subcentimeter pulmonary ground-glass nodules. Front Oncol. 2021;11:698053.
- [CrossRef] [PubMed] [Google Scholar]
- Long-term prognosis of patients with resected adenocarcinoma in situ and minimally invasive adenocarcinoma of the lung. J Thorac Oncol. 2021;16:1312-20.
- [CrossRef] [PubMed] [Google Scholar]
- Adenocarcinoma spectrum lesions of the lung: Detection, pathology and treatment strategies. Cancer Treat Rev. 2021;99:102237.
- [CrossRef] [PubMed] [Google Scholar]
- Factors associated with pulmonary function changes in patients undergoing microwave ablation for pulmonary ground-glass nodules. Technol Cancer Res Treat. 2022;21:1-8.
- [CrossRef] [PubMed] [Google Scholar]
- The diagnosis and treatment of lung cancer presented as ground-glass nodule. Gen Thorac Cardiovasc Surg. 2020;68:697-702.
- [CrossRef] [PubMed] [Google Scholar]
- The probability of malignancy in solitary pulmonary nodules. Application to small radiologically indeterminate nodules. Arch Intern Med. 1997;157:849-55.
- [CrossRef] [PubMed] [Google Scholar]
- Clinical prediction model to characterize pulmonary nodules: Validation and added value of 18F-fluorodeoxyglucose positron emission tomography. Chest. 2005;128:2490-6.
- [CrossRef] [PubMed] [Google Scholar]
- A clinical model to estimate the pretest probability of lung cancer in patients with solitary pulmonary nodules. Chest. 2007;131:383-8.
- [CrossRef] [PubMed] [Google Scholar]
- Probability of cancer in pulmonary nodules detected on first screening CT. N Engl J Med. 2013;369:910-9.
- [CrossRef] [PubMed] [Google Scholar]
- Development of a risk prediction model to estimate the probability of malignancy in pulmonary nodules being considered for biopsy. Chest. 2019;156:367-75.
- [CrossRef] [PubMed] [Google Scholar]
- Next-generation metabolomics in lung cancer diagnosis, treatment and precision medicine: Mini review. Oncotarget. 2017;8:115774-86.
- [CrossRef] [PubMed] [Google Scholar]
- Identification of bioactive metabolites using activity metabolomics. Nat Rev Mol Cell Biol. 2019;20:353-67.
- [CrossRef] [PubMed] [Google Scholar]
- Investigating the transition of pre-symptomatic to symptomatic Huntington's disease status based on omics data. Int J Mol Sci. 2020;21:7414.
- [CrossRef] [PubMed] [Google Scholar]
- Saliva metabolomics in dry mouth patients with head and neck cancer or Sjögren's syndrome. Cells. 2022;11:323.
- [CrossRef] [PubMed] [Google Scholar]
- Early breast cancer detection using untargeted and targeted metabolomics. J Proteome Res. 2021;20:3124-33.
- [CrossRef] [PubMed] [Google Scholar]
- Metabolomics of lung cancer: Analytical platforms and their applications. J Sep Sci. 2020;43:120-33.
- [CrossRef] [PubMed] [Google Scholar]
- Discovering biomarkers in bladder cancer by metabolomics. Biomark Med. 2018;12:1347-59.
- [CrossRef] [PubMed] [Google Scholar]
- Urine NMR metabolomics for precision oncology in colorectal cancer. Int J Mol Sci. 2022;23:11171.
- [CrossRef] [PubMed] [Google Scholar]
- Metabolomics of gastric cancer. Adv Exp Med Biol. 2021;1280:291-301.
- [CrossRef] [PubMed] [Google Scholar]
- Untargeted metabolomics analysis of omeprazole-enhanced chemosensitivity to cisplatin in mice with non-small cell lung cancer. Chem Biol Interact. 2022;360:109933.
- [CrossRef] [PubMed] [Google Scholar]
- High-resolution metabolomic biomarkers for lung cancer diagnosis and prognosis. Sci Rep. 2021;11:11805.
- [CrossRef] [PubMed] [Google Scholar]
- An epidemiological introduction to human metabolomic investigations. Trends Endocrinol Metab. 2023;34:505-25.
- [CrossRef] [PubMed] [Google Scholar]
- Chinese expert consensus on diagnosis and treatment of pulmonary nodules (2018 edition) (in Chinese) Zhonghua Jie He He Hu Xi Za Zhi. 2018;41:763-71.
- [Google Scholar]
- Prediction of the invasiveness of ground-glass nodules in lung adenocarcinoma by radiomics analysis using high-resolution computed tomography imaging. Cancer Control. 2022;29:1-8.
- [CrossRef] [PubMed] [Google Scholar]
- The metabolic remodelling in lung cancer and its putative consequence in therapy response. Adv Exp Med Biol. 2020;1219:311-33.
- [CrossRef] [PubMed] [Google Scholar]
- Differential protein stability and clinical responses of EML4-ALK fusion variants to various ALK inhibitors in advanced ALK-rearranged non-small cell lung cancer. Ann Oncol. 2017;28:791-7.
- [CrossRef] [PubMed] [Google Scholar]
- Oncogene-driven metabolic alterations in cancer. Biomol Ther (Seoul). 2018;26:45-56.
- [CrossRef] [PubMed] [Google Scholar]
- Metabolic rewiring in mutant Kras lung cancer. FEBS J. 2018;285:28-41.
- [CrossRef] [PubMed] [Google Scholar]
- Advances in cytology of lung cancer. Semin Diagn Pathol. 2021;38:109-15.
- [CrossRef] [PubMed] [Google Scholar]
- Untargeted GC-MS metabolomics. Methods Mol Biol. 2018;1738:133-47.
- [CrossRef] [PubMed] [Google Scholar]
- Functional assay of cancer cell invasion potential based on mechanotransduction of focused ultrasound. Front Oncol. 2017;7:161.
- [CrossRef] [PubMed] [Google Scholar]
- Lipid metabolism and lung cancer [published correction appears in Crit Rev Oncol Hematol 2019;133:45] Crit Rev Oncol Hematol. 2017;112:31-40.
- [CrossRef] [PubMed] [Google Scholar]
- Targeting cancer metabolism in the era of precision oncology. Nat Rev Drug Discov. 2022;21:141-62.
- [CrossRef] [PubMed] [Google Scholar]
- Non-targeted and targeted metabolomics approaches to diagnosing lung cancer and predicting patient prognosis. Oncotarget. 2016;7:63437-48.
- [CrossRef] [PubMed] [Google Scholar]
- Quantitative measurement of organic acids in tissues from gastric cancer patients indicates increased glucose metabolism in gastric cancer. PLoS One. 2014;9:e98581.
- [CrossRef] [PubMed] [Google Scholar]
- A metabolomic approach to lung cancer. Lung Cancer. 2011;74:284-92.
- [CrossRef] [PubMed] [Google Scholar]
- Metabolomic profiling reveals potential markers and bioprocesses altered in bladder cancer progression. Cancer Res. 2011;71:7376-86.
- [CrossRef] [PubMed] [Google Scholar]
- Metabolite profiling of human colon carcinoma--deregulation of TCA cycle and amino acid turnover. Mol Cancer. 2008;7:72.
- [CrossRef] [PubMed] [Google Scholar]
- Fatty acid transport proteins (FATPs) in cancer. Chem Phys Lipids. 2023;250:105269.
- [CrossRef] [PubMed] [Google Scholar]
- Reprogramming of fatty acid metabolism in cancer. Br J Cancer. 2020;122:4-22.
- [CrossRef] [PubMed] [Google Scholar]
- Changes in serum amino acid levels in non-small cell lung cancer: A case-control study in Chinese population. PeerJ. 2022;10:e13272.
- [CrossRef] [PubMed] [Google Scholar]
- Targeted metabolomics for serum amino acids and acylcarnitines in patients with lung cancer. Exp Ther Med. 2019;18:188-98.
- [CrossRef] [PubMed] [Google Scholar]
SUPPLEMENTARY TABLES
| Class | Metabolites | Molecular weight | Actual RT | VIP | Fold change | q-value | Expression |
|---|---|---|---|---|---|---|---|
| Organic nitrogen compounds | Dihomo-γ-linolenoyl ethanolamide | 349.298 | 9.513 | 2.848 | 8.973 | 0.000 | Up |
| Benzenoids | 2-hydroxyhippuric acid | 195.054 | 3.624 | 2.792 | 28.58 | 0.000 | Up |
| Benzenoids | Sertraline | 305.075 | 2.465 | 2.763 | 5.688 | 0.000 | Up |
| Organic oxygen compounds | Indican | 295.106 | 3.582 | 2.725 | 16.18 | 0.000 | Up |
| Organic acids and their derivatives | Eugenol sulfate | 244.041 | 0.599 | 2.564 | 0.239 | 0.000 | Down |
| Alkaloids and their derivatives | Pilocarpine | 208.122 | 3.546 | 2.558 | 0.187 | 0.000 | Down |
| Organic acids and their derivatives | Tb8545000 | 250.015 | 4.78 | 2.401 | 3.997 | 0.000 | Up |
| Organic acids and their derivatives | N-acetylvanilalanine | 253.095 | 3.814 | 2.387 | 3.289 | 0.000 | Up |
| Organic acids and their derivatives | L-tyrosine methyl ester | 195.09 | 2.865 | 2.384 | 3.481 | 0.000 | Up |
| Organic nitrogen compounds | Linoleoyl ethanolamide | 323.282 | 9.372 | 2.343 | 4.283 | 0.000 | Up |
| Organic acids and their derivatives | Allantoic acid | 176.054 | 0.596 | 2.326 | 0.285 | 0.000 | Down |
| Organic nitrogen compounds | Synaptamide | 371.282 | 9.358 | 2.292 | 3.956 | 0.000 | Up |
| Organic acids and their derivatives | Goralatide | 487.228 | 2.607 | 2.192 | 2.834 | 0.000 | Up |
| Organic acids and their derivatives | Valylvaline | 216.148 | 4.217 | 2.158 | 2.829 | 0.000 | Up |
| Organic acids and their derivatives | (2e)-2,5-dichloro -4-oxo-2-hexenedioic acid | 225.944 | 0.611 | 2.153 | 0.296 | 0.000 | Down |
| Benzenoids | 5-methoxysalicylic acid | 168.043 | 5.215 | 2.132 | 0.182 | 0.002 | Down |
| Organic nitrogen compounds | Anandamide (aea) | 347.282 | 9.372 | 2.125 | 4.697 | 0.002 | Up |
| Organo heterocyclic compounds | Nl8513000 | 191.095 | 5.176 | 2.11 | 2.817 | 0.001 | Up |
| Organic acids and their derivatives | N-([2s]-2-hydroxypropanoyl) methionine | 221.072 | 3.838 | 2.095 | 2.821 | 0.001 | Up |
| Organic acids and their derivatives | N-acetyl-1-aspartylglutamic acid | 304.091 | 1.511 | 2.085 | 3.48 | 0.000 | Up |
| Alkaloids and their derivatives | (+)-castanospermine | 189.1 | 4.217 | 2.083 | 2.804 | 0.001 | Up |
| Organic acids and their derivatives | N-acetyl-l-aspartic acid | 175.048 | 1.027 | 2.046 | 2.488 | 0.004 | Up |
| Organic acids and their derivatives | Tranexamic acid | 157.111 | 5.076 | 2.038 | 2.602 | 0.001 | Up |
| Alkaloids and their derivatives | Colcemid | 371.174 | 3.228 | 2.033 | 0.431 | 0.017 | Down |
| Organo heterocyclic compounds | Triflupromazine | 352.122 | 0.601 | 2.017 | 0.373 | 0.002 | Down |
| Organo heterocyclic compounds | Oxomemazine | 330.14 | 0.598 | 1.998 | 0.409 | 0.009 | Down |
| Organic acids and their derivatives | 4-hydroxyprolylleucine | 244.142 | 0.71 | 1.981 | 2.481 | 0.000 | Up |
| Nucleosides, nucleotides, and their analogs | Succinyladenosine | 383.108 | 3.11 | 1.973 | 2.46 | 0.002 | Up |
| Organo heterocyclic compounds | Tinidazole | 247.063 | 7.007 | 1.955 | 0.356 | 0.000 | Down |
| Organic acids and their derivatives | Norepinephrine sulfate | 249.031 | 2.652 | 1.941 | 2.918 | 0.001 | Up |
| Organo heterocyclic compounds | Flumequine | 261.079 | 7.608 | 1.936 | 0.376 | 0.000 | Down |
| Organic nitrogen compounds | Mfcd00674434 | 323.282 | 8.478 | 1.934 | 2.844 | 0.001 | Up |
| Alkaloids and their derivatives | Berberine | 336.124 | 8.438 | 1.9 | 2.396 | 0.001 | Up |
| Nucleosides, nucleotides, and their analogs | 7-methylguanosine | 297.107 | 2.549 | 1.891 | 2.134 | 0.002 | Up |
| Benzenoids | Sulfacetamide | 214.042 | 2.475 | 1.876 | 0.458 | 0.006 | Down |
| Vitamins and cofactors | Pantothenic acid | 219.111 | 3.042 | 1.875 | 2.112 | 0.000 | Up |
| Organic acids and their derivatives | N-acetyl-l-glutamate | 189.064 | 1.317 | 1.873 | 2.57 | 0.000 | Up |
| Alkaloids and their derivatives | Salsolinol | 179.095 | 3.664 | 1.867 | 1.876 | 0.006 | Up |
| Organic nitrogen compounds | Triethylamine | 101.121 | 0.698 | 1.824 | 1.838 | 0.001 | Up |
| Benzenoids | Niflumic acid | 282.062 | 0.919 | 1.813 | 2.586 | 0.002 | Up |
| Organo heterocyclic compounds | Primidone | 218.106 | 4.184 | 1.802 | 1.998 | 0.002 | Up |
| Nucleosides, nucleotides, and their analogs | N2-dimethylguanosine | 311.123 | 3.052 | 1.745 | 1.943 | 0.002 | Up |
| Alkaloids and their derivatives | (13 alpha)-2-oxospartein-13-yl (2e)-2-methyl-2-butenoate | 346.225 | 7.119 | 1.713 | 0.315 | 0.007 | Down |
| Organic acids and their derivatives | D-ornithine | 132.09 | 0.578 | 1.706 | 0.434 | 0.007 | Down |
| Organic acids and their derivatives | 2-([2-amino-2-carboxyethyl] thio) butanedioic acid | 237.031 | 0.774 | 1.702 | 2.179 | 0.000 | Up |
| Organic acids and their derivatives | S-(3-oxo-3-carboxy-n-propyl) cysteine | 221.036 | 0.929 | 1.689 | 2.488 | 0.007 | Up |
| Organic nitrogen compounds | Oleoyl ethanolamide | 325.298 | 9.603 | 1.685 | 2.804 | 0.005 | Up |
| Organic nitrogen compounds | Α-linolenoyl ethanolamide | 321.267 | 9.146 | 1.676 | 2.344 | 0.001 | Up |
| Organic acids and their derivatives | N-acetyl-l-phenylalanine | 207.09 | 4.881 | 1.669 | 2.29 | 0.003 | Up |
| Organic acids and their derivatives | Glu-glu | 276.096 | 1.306 | 1.655 | 2.307 | 0.006 | Up |
| Organo heterocyclic compounds | Neopterin | 253.08 | 0.748 | 1.637 | 1.854 | 0.001 | Up |
| Benzenoids | 5-(4-[2-(methylamino) ethoxy] benzyl)-1, 3-thiazolidine-2, 4-dione | 280.088 | 4.747 | 1.629 | 1.436 | 0.011 | Up |
| Benzenoids | 3-methoxy-4-hydroxyhippuric acid | 225.064 | 3.974 | 1.617 | 0.205 | 0.022 | Down |
| Nucleic acids | Cyclic amp | 329.053 | 2.227 | 1.607 | 0.724 | 0.018 | Down |
| Organic acids and their derivatives | Monomethyl phosphate | 111.993 | 0.787 | 1.598 | 1.88 | 0.000 | Up |
| Organo heterocyclic compounds | 2-ethyl-4,5-dimethylthiazole | 125.084 | 0.707 | 1.589 | 2.418 | 0.014 | Up |
| Organo heterocyclic compounds | Pindolol | 248.153 | 4.581 | 1.583 | 0.475 | 0.011 | Down |
| Alkaloids and their derivatives | Xanthosine | 284.076 | 2.421 | 1.562 | 1.998 | 0.006 | Up |
| Benzenoids | Vorinostat | 264.147 | 3.763 | 1.556 | 2.712 | 0.008 | Up |
| Organo heterocyclic compounds | Trolox | 250.121 | 8.067 | 1.549 | 0.541 | 0.011 | Down |
| Benzenoids | Diethyl phthalate | 222.09 | 7.219 | 1.549 | 0.477 | 0.025 | Down |
| Organic nitrogen compounds | Stearoylethanolamide | 327.314 | 8.675 | 1.53 | 0.547 | 0.001 | Down |
| Organo heterocyclic compounds | 2-(12-tridecyn-1-yl) furan | 246.199 | 8.544 | 1.528 | 3.208 | 0.016 | Up |
| Benzenoids | Propylparaben | 180.079 | 7.22 | 1.502 | 0.492 | 0.021 | Down |
| Benzenoids | Hostmaniane | 254.116 | 7.22 | 1.501 | 0.476 | 0.021 | Down |
| Homogeneous non-metal compounds | Phosphoric acid | 97.977 | 0.762 | 1.484 | 1.853 | 0.000 | Up |
| Organic acids and their derivatives | Indoxyl sulfate | 213.01 | 0.806 | 1.444 | 5.107 | 0.041 | Up |
| Organic acids and their derivatives | Hmba | 200.153 | 3.42 | 1.431 | 0.492 | 0.046 | Down |
| Organic oxygen compounds | N-acetyl-d-galactosamine | 221.09 | 0.695 | 1.423 | 1.842 | 0.002 | Up |
| Organic acids and their derivatives | N8-acetylspermidine | 187.169 | 0.592 | 1.409 | 2.305 | 0.008 | Up |
| Alkaloids and their derivatives | Indole-3-acetic acid | 175.064 | 5.135 | 1.4 | 0.628 | 0.009 | Down |
| Nucleosides, nucleotides, and their analogs | Inosine | 268.081 | 1.959 | 1.396 | 2.466 | 0.010 | Up |
| Organic acids and their derivatives | N-(3-carboxy-2-[carboxymethyl] -2-hydroxypropanoyl) glutamic acid | 321.07 | 1.642 | 1.385 | 1.688 | 0.005 | Up |
| Organic acids and their derivatives | Phosphocreatine | 211.036 | 0.772 | 1.382 | 0.183 | 0.048 | Down |
| Organic nitrogen compounds | Tris (hydroxymethyl) aminomethane | 121.074 | 0.634 | 1.38 | 0.161 | 0.013 | Down |
| Organic acids and their derivatives | N6-acetyl-l-lysine | 188.116 | 0.926 | 1.372 | 1.895 | 0.014 | Up |
| Nucleosides, nucleotides, and their analogs | 1-methylinosine | 282.096 | 2.693 | 1.362 | 0.515 | 0.023 | Down |
| Benzenoids | 2,6-di-tert-butylhydroquinone | 222.162 | 9.829 | 1.361 | 0.587 | 0.006 | Down |
| Lipids and lipid-like molecules | 8z, 11z, 14z-eicosatrienoic acid | 306.256 | 9.825 | 1.36 | 1.581 | 0.002 | Up |
| Organic acids and their derivatives | Acetyl arginine | 216.123 | 0.696 | 1.357 | 1.977 | 0.010 | Up |
| Alkaloids and their derivatives | 8-methyl-8-azabicyclo (3.2.1) oct-3-yl (3s)-1, 2-dithiolane-3-carboxylate | 273.085 | 0.761 | 1.357 | 2.063 | 0.004 | Up |
| Organo heterocyclic compounds | Quinolinic acid | 167.022 | 1.336 | 1.336 | 2.819 | 0.024 | Up |
| Organic acids and their derivatives | Asn-pro | 229.106 | 0.7 | 1.331 | 1.644 | 0.003 | Up |
| Organic acids and their derivatives | N3, n4-dimethyl-l-arginine | 202.143 | 0.676 | 1.326 | 1.766 | 0.032 | Up |
| Sphingolipids | Sphinganine | 301.298 | 8.481 | 1.304 | 0.621 | 0.006 | Down |
| Decanoylcarnitine | 315.241 | 7.033 | 1.294 | 0.545 | 0.027 | Down | |
| Organic acids and their derivatives | Fosfocreatinine | 193.026 | 0.614 | 1.279 | 1.793 | 0.049 | Up |
| Organic acids and their derivatives | Argininosuccinic acid | 290.122 | 0.654 | 1.267 | 1.721 | 0.042 | Up |
| Organo heterocyclic compounds | Xanthine | 152.034 | 1.152 | 1.262 | 1.69 | 0.049 | Up |
| Organic nitrogen compounds | D-sphingosine | 299.282 | 8.365 | 1.261 | 0.656 | 0.007 | Down |
| Benzenoids | N-Propyl gallate | 212.068 | 0.619 | 1.254 | 1.716 | 0.020 | Up |
| Organic acids and their derivatives | Alanyltryptophan | 275.128 | 9.319 | 1.244 | 1.647 | 0.002 | Up |
| Nucleosides, nucleotides, and their analogs | 8-hydroxy-deoxyguanosine | 283.092 | 1.935 | 1.228 | 1.731 | 0.011 | Up |
| Benzenoids | Yu0650000 | 136.064 | 0.645 | 1.227 | 1.585 | 0.007 | Up |
| Benzenoids | 3-methyl-2-oxo-4-phenylbutyl hydrogen sulfate | 258.057 | 0.598 | 1.208 | 0.64 | 0.045 | Down |
| Organic acids and their derivatives | N-palmitoyl-l-phenylalanine | 403.309 | 9.853 | 1.187 | 0.54 | 0.023 | Down |
| Licochalcone A | 338.15 | 9.084 | 1.181 | 0.568 | 0.024 | Down | |
| Organic oxygen compounds | 1-phenyl-1,3-octadecanedione | 358.287 | 10.02 | 1.159 | 1.693 | 0.045 | Up |
| Terpenoids | Steviol | 318.219 | 9.085 | 1.155 | 2.509 | 0.049 | Up |
| Organic acids and their derivatives | 4-hydroxy-3-(sulfooxy) benzoic acid | 233.983 | 1.008 | 1.153 | 1.449 | 0.010 | Up |
| Nucleosides, nucleotides, and their analogs | 1-methyladenosine | 281.112 | 2.766 | 1.152 | 1.777 | 0.042 | Up |
| Organic oxygen compounds | D-fructose | 180.064 | 0.646 | 1.149 | 0.761 | 0.014 | Down |
| Organic acids and their derivatives | Nepsilon-trimethyllysine | 188.153 | 0.603 | 1.138 | 1.564 | 0.010 | Up |
| Organic nitrogen compounds | Docosatetraenoylethanolamide | 375.314 | 10.02 | 1.105 | 1.589 | 0.047 | Up |
| Peptides | L-homoserine | 119.059 | 0.65 | 1.092 | 0.618 | 0.045 | Down |
| Organo heterocyclic compounds | Uracil | 112.028 | 0.918 | 1.088 | 1.38 | 0.020 | Up |
| Organic acids and their derivatives | 3-thiomorpholinecarboxylic acid | 147.036 | 0.819 | 1.039 | 0.683 | 0.015 | Down |
| Organic acids and their derivatives | N6-methyllysine | 160.121 | 0.593 | 1.038 | 1.44 | 0.004 | Up |
| Organo heterocyclic compounds | Nicotinamide | 122.048 | 1.029 | 1.029 | 1.415 | 0.016 | Up |
| Organic acids and their derivatives | Stachydrine | 143.095 | 0.577 | 1.028 | 1.433 | 0.005 | Up |
| Phenylpropanoids and polyketides | Octinoxate | 290.188 | 8.198 | 1.02 | 0.658 | 0.004 | Down |
| Organic acids and their derivatives | Pyruvic acid | 88.016 | 0.857 | 1.002 | 1.388 | 0.014 | Up |
LUAD: Lung adenocarcinoma, NL: Normal lung, VIP: Variable importance in projection, RT: Retention time
| Class | Metabolites | Molecular weight | Actual RT | VIP | Fold change | q-value | Expression |
|---|---|---|---|---|---|---|---|
| Organic acids and their derivatives | N-palmitoyl-l-tyrosine | 419.303 | 9.888 | 2.389 | 6.216 | 0.000 | Up |
| Organic acids and their derivatives | 3-indoxyl sulfate | 213.009 | 3.036 | 2.226 | 0.28 | 0.001 | Down |
| Benzenoids | Phenylpyruvic acid | 164.047 | 3.503 | 2.164 | 4.809 | 0.000 | Up |
| Phenylpropanoids and polyketides | L-(-)-3-phenyllactic acid | 166.063 | 3.01 | 2.044 | 3.847 | 0.000 | Up |
| Organic acids and their derivatives | N-acetylvanilalanine | 253.095 | 2.472 | 1.961 | 2.796 | 0.003 | Up |
| Benzenoids | Mitotane | 317.955 | 0.686 | 1.953 | 0.275 | 0.000 | Down |
| Phenylpropanoids and polyketides | Dl-4-hydroxyphenyllactic acid | 182.058 | 1.26 | 1.939 | 3.73 | 0.000 | Up |
| Organic acids and their derivatives | N-([2s]-2-hydroxypropanoyl) methionine | 221.072 | 2.752 | 1.898 | 2.971 | 0.001 | Up |
| Lipids and lipid-like molecules | Thromboxane b2 | 370.235 | 6.926 | 1.834 | 3.573 | 0.000 | Up |
| Alkaloids | (+)-castanospermine | 189.1 | 2.777 | 1.814 | 2.87 | 0.001 | Up |
| Benzenoids | Sertraline | 305.074 | 0.646 | 1.803 | 3.076 | 0.003 | Up |
| Organic acids and their derivatives | N-acetyl-1-aspartylglutamic acid | 304.09 | 0.589 | 1.705 | 3.162 | 0.000 | Up |
| Nucleosides, nucleotides, and their analogs | Xanthosine | 284.075 | 2.576 | 1.667 | 2.861 | 0.012 | Up |
| Organic acids and their derivatives | Oxoglutaric acid | 146.022 | 0.629 | 1.59 | 0.58 | 0.008 | Down |
| Nucleosides, nucleotides, and their analogs | 1-(beta-d-ribofuranosyl) thymine | 258.085 | 0.646 | 1.588 | 0.41 | 0.000 | Down |
| Homogeneous non-metal compounds | Pyrophosphoric acid | 177.943 | 0.638 | 1.566 | 2.576 | 0.000 | Up |
| Organic oxygen compounds | Pantothenic acid | 219.11 | 1.595 | 1.539 | 2.104 | 0.000 | Up |
| Organic acids and their derivatives | N-acetyl-l-phenylalanine | 207.089 | 3.749 | 1.535 | 2.343 | 0.001 | Up |
| Organic acids and their derivatives | N-(2-[(2-amino-2-carboxyethyl) amino]-2-carboxyethyl) aspartic acid | 307.101 | 2.666 | 1.533 | 0.188 | 0.032 | Down |
| Benzenoids | 1-(4-methoxyphenyl)-3-pentanyl hydrogen sulfate | 274.087 | 5.295 | 1.504 | 0.481 | 0.026 | Down |
| Organo heterocyclic compounds | 227689 | 207.039 | 4.325 | 1.498 | 0.189 | 0.050 | Down |
| Benzenoids | Mandelate | 152.047 | 3.213 | 1.452 | 2.947 | 0.022 | Up |
| Organic oxygen compounds | 4-o-(a-d-glucopyranosyl) moranoline | 325.137 | 0.715 | 1.397 | 1.715 | 0.001 | Up |
| Organic oxygen compounds | 5-o-methyl embelin | 308.199 | 7.594 | 1.394 | 12.631 | 0.027 | Up |
| Nucleosides, nucleotides, and their analogs | Cdp-ethanolamine | 446.061 | 0.693 | 1.394 | 0.46 | 0.005 | Down |
| Phenylpropanoids and polyketides | 4’-methyl-epigallocatechin-3’-glucuronide | 496.124 | 1.374 | 1.383 | 1.709 | 0.008 | Up |
| Benzenoids | 5-(4-[2-(methylamino) ethoxy] benzyl)-1,3-thiazolidine-2,4-dione | 280.088 | 4.974 | 1.376 | 1.534 | 0.011 | Up |
| Polyketides | Oleandolide | 386.23 | 6.182 | 1.358 | 1.892 | 0.011 | Up |
| Phenylpropanoids and polyketides | 3,4,5-trimethoxyhydrocinnamic acid | 240.099 | 6.018 | 1.344 | 0.47 | 0.015 | Down |
| Organic acids and their derivatives | Citrate | 192.027 | 0.633 | 1.336 | 0.633 | 0.010 | Down |
| Organic acids and their derivatives | L-(+)-lactic acid | 90.032 | 0.667 | 1.332 | 1.678 | 0.000 | Up |
| Organic oxygen compounds | L-threonic acid | 136.037 | 0.647 | 1.322 | 0.521 | 0.001 | Down |
| Benzenoids | Diphenyl disulfide | 218.023 | 0.59 | 1.292 | 0.644 | 0.017 | Down |
| Organic acids and their derivatives | 4-([2-hydroxy-4-methylpentanoyl] amino)-7-isobutyl-3-isopropyl -5,8-dioxo-2-oxa-6,9-diazabicyclo (10.2.2) hexadeca-1 (14),12,15-triene -10-carboxylic acid | 519.293 | 10.202 | 1.283 | 1.892 | 0.030 | Up |
| Organic acids and their derivatives | 3-hydroxysebacic acid | 218.115 | 3.707 | 1.282 | 0.753 | 0.044 | Down |
| Organic oxygen compounds | 1-phenyl-1,3-octadecanedione | 358.287 | 10.445 | 1.281 | 2.08 | 0.004 | Up |
| Fatty acyls | Ethyl docosahexaenoate | 356.271 | 10.184 | 1.258 | 1.962 | 0.005 | Up |
| Organic oxygen compounds | Δ-gluconic acid δ-lactone | 178.048 | 0.64 | 1.241 | 0.552 | 0.009 | Down |
| Lipids and lipid-like molecules | 8z, 11z, 14z-eicosatrienoic acid | 306.256 | 10.095 | 1.241 | 1.634 | 0.000 | Up |
| Organo heterocyclic compounds | 2-amino-6-(1,2-dihydroxypropyl) -4 (1h)-pteridinon | 237.085 | 6.518 | 1.224 | 0.397 | 0.021 | Down |
| Organic acids and their derivatives | N-(3-carboxy-2-[carboxymethyl] -2-hydroxypropanoyl) glutamic acid | 321.069 | 0.576 | 1.217 | 1.578 | 0.000 | Up |
| Organic acids and their derivatives | N, n-dimethylarginine | 202.143 | 0.799 | 1.212 | 1.854 | 0.026 | Up |
| Lipids and lipid-like molecules | 11(z),14(z)-eicosadienoic acid | 308.271 | 10.37 | 1.176 | 1.609 | 0.000 | Up |
| Organic acids and their derivatives | Meprobamate | 218.126 | 0.951 | 1.157 | 1.666 | 0.030 | Up |
| Lipids and lipid-like molecules | Myristic acid | 228.209 | 9.25 | 1.145 | 1.971 | 0.010 | Up |
| Benzenoids | Paradol | 278.188 | 8.196 | 1.128 | 1.743 | 0.045 | Up |
| Organic acids and their derivatives | Leucylasparagine | 245.137 | 0.721 | 1.123 | 1.427 | 0.026 | Up |
| Organic acids and their derivatives | Met-gln | 277.108 | 2.992 | 1.109 | 0.593 | 0.002 | Down |
| Nucleosides, nucleotides, and their analogs | 8-hydroxy-deoxyguanosine | 283.091 | 0.721 | 1.096 | 1.768 | 0.025 | Up |
| Organo heterocyclic compounds | Miglitol | 207.11 | 0.678 | 1.051 | 1.587 | 0.018 | Up |
| Nucleosides, nucleotides, and their analogues | Uridine 5'-diphosphate | 404.002 | 0.634 | 1.049 | 0.242 | 0.013 | Down |
| Lipids and lipid-like molecules | Cis-5,8,11,14,17-eicosapentaenoic acid | 302.224 | 9.669 | 1.042 | 1.523 | 0.035 | Up |
LUAD: Lung adenocarcinoma, NL: Normal lung, VIP: Variable importance in projection, RT: Retention time
| Class | Metabolites | VIP | Fold change | P-value | q-value | Expression |
|---|---|---|---|---|---|---|
| Fatty acids | 3-methyladipic acid | 2.235 | 2.918 | 0.000 | 0.012 | Up |
| Myristic acid | 0.892 | 1.312 | 0.027 | 0.107 | Up | |
| Pimelic acid | 2.113 | 2.573 | 0.000 | 0.012 | Up | |
| Arachidonic acid | 0.883 | 1.301 | 0.023 | 0.106 | Up | |
| Eicosapentaenoic acid (Epa) | 1.383 | 1.807 | 0.005 | 0.043 | Up | |
| Docosahexaenoic acid dha | 1.288 | 1.619 | 0.002 | 0.024 | Up | |
| Adrenic acid | 1.113 | 1.482 | 0.031 | 0.116 | Up | |
| Docosatrienoic acid | 1.521 | 1.927 | 0.005 | 0.043 | Up | |
| 8,11,14-eicosatrienoic acid | 1.512 | 1.809 | 0.001 | 0.018 | Up | |
| 11c, 14c-eicosadienoic acid | 0.987 | 1.467 | 0.032 | 0.116 | Up | |
| Docosapentaenoic acid dpa | 0.901 | 1.422 | 0.023 | 0.106 | Up | |
| 2-hydroxy-4-(methylthio) butanoate | 0.985 | 1.383 | 0.018 | 0.092 | Up | |
| Cis-11,14,17-eicosatrienoic acid | 1.513 | 1.780 | 0.001 | 0.018 | Up | |
| 13c, 16c-docosadienoic acid | 0.942 | 1.373 | 0.040 | 0.144 | Up | |
| Octanoic acid | 1.594 | 0.201 | 0.015 | 0.090 | Down | |
| Decanoic acid | 1.252 | 0.291 | 0.045 | 0.146 | Down | |
| Dodecanoic acid | 1.416 | 0.378 | 0.005 | 0.043 | Down | |
| Sebacic acid | 2.304 | 0.191 | 0.000 | 0.012 | Down | |
| Tridecanoic acid | 0.880 | 0.780 | 0.024 | 0.106 | Down | |
| 2-ethylhexanoic acid | 1.642 | 0.189 | 0.014 | 0.087 | Down | |
| Amino acids | Gamma-aminobutyric acid | 2.268 | 3.162 | 0.000 | 0.012 | Up |
| L-phenylalanine | 0.724 | 1.312 | 0.043 | 0.146 | Up | |
| L-alanine | 1.141 | 1.525 | 0.004 | 0.038 | Up | |
| L-proline | 1.207 | 1.501 | 0.013 | 0.081 | Up | |
| L-threonine | 1.020 | 1.448 | 0.026 | 0.106 | Up | |
| L-serine | 1.107 | 1.479 | 0.019 | 0.098 | Up | |
| Phosphoserine | 1.941 | 2.583 | 0.004 | 0.038 | Up | |
| N-acetyl-l-aspartic acid | 2.665 | 5.480 | 0.007 | 0.056 | Up | |
| 3-chlorotyrosine | 1.175 | 1.430 | 0.004 | 0.038 | Up | |
| 2-aminoisobutyric acid | 1.644 | 1.942 | 0.003 | 0.030 | Up | |
| N-phenylacetylphenylalanine | 1.105 | 1.518 | 0.021 | 0.102 | Up | |
| N-methyl-d-aspartic acid | 1.024 | 1.333 | 0.028 | 0.109 | Up | |
| 5-aminopentanoic acid | 1.162 | 1.402 | 0.043 | 0.146 | Up | |
| Selenomethionine | 1.252 | 1.643 | 0.024 | 0.106 | Up | |
| N-a-acetyl-l-arginine | 1.375 | 1.733 | 0.027 | 0.106 | Up | |
| N-acetylglutamine | 1.209 | 1.568 | 0.015 | 0.090 | Up | |
| N-acetyl-l-histidine | 1.268 | 1.658 | 0.022 | 0.106 | Up | |
| N-acetylproline | 1.438 | 2.010 | 0.045 | 0.146 | Up | |
| Ornithine | 1.211 | 0.566 | 0.017 | 0.090 | Down | |
| Organic acids | Phosphoenolpyruvic acid | 0.878 | 1.388 | 0.043 | 0.146 | Up |
| Acetoacetic acid | 1.419 | 1.483 | 0.027 | 0.106 | Up | |
| Fumaric acid | 1.481 | 1.764 | 0.025 | 0.106 | Up | |
| L-malic acid | 1.376 | 1.562 | 0.000 | 0.012 | Up | |
| Maleic acid | 1.519 | 1.717 | 0.016 | 0.090 | Up | |
| L-lactic acid | 1.240 | 1.451 | 0.005 | 0.043 | Up | |
| Oxoglutaric acid | 1.250 | 1.575 | 0.002 | 0.024 | Up | |
| Quinolinic acid | 2.389 | 3.274 | 0.003 | 0.037 | Up | |
| Vanillymandelic acid | 1.569 | 1.739 | 0.000 | 0.012 | Up | |
| 3-methyl-2-oxovaleric acid | 1.625 | 2.242 | 0.011 | 0.077 | Up | |
| Senecioic acid | 2.349 | 3.281 | 0.005 | 0.043 | Up | |
| Ketoleucine | 1.687 | 2.341 | 0.001 | 0.018 | Up | |
| Threonic acid | 1.202 | 1.504 | 0.017 | 0.090 | Up | |
| Benzenoids | 4-hydroxybenzoic acid | 2.035 | 0.019 | 0.041 | 0.145 | Down |
| 4-hydroxyphenylpyruvic acid | 3.508 | 8.510 | 0.000 | 0.012 | Up | |
| L-3-phenyllactic acid | 3.192 | 11.326 | 0.000 | 0.013 | Up | |
| 3-Phenyllactic acid (PhLA) | 2.900 | 8.043 | 0.001 | 0.021 | Up | |
| Pyridoxal 5’-phosphate | 1.767 | 1.965 | 0.000 | 0.012 | Up | |
| Protocatechuic acid | 1.001 | 1.380 | 0.013 | 0.081 | Up | |
| 4-aminohippuric acid | 1.596 | 1.955 | 0.001 | 0.014 | Up | |
| Gallic acid | 1.085 | 1.374 | 0.016 | 0.090 | Up | |
| Carbohydrates | D-xylose | 1.777 | 2.154 | 0.002 | 0.024 | Up |
| D-gluconolactone | 1.364 | 1.837 | 0.025 | 0.106 | Up | |
| N-acetylneuraminic acid | 1.314 | 1.614 | 0.027 | 0.106 | Up | |
| Erythronic acid | 1.253 | 1.543 | 0.011 | 0.077 | Up | |
| Gluconic acid | 1.368 | 1.841 | 0.026 | 0.106 | Up | |
| Glyceraldehyde | 1.866 | 2.295 | 0.001 | 0.018 | Up | |
| Bile acids | 3,6-diketocholanic acid methyl ester | 1.011 | 1.418 | 0.002 | 0.024 | Up |
| Dehydrocholic acid | 1.221 | 1.364 | 0.006 | 0.045 | Up | |
| Dioxolithocholic acid | 1.270 | 1.530 | 0.010 | 0.077 | Up | |
| Etiadienic acid | 1.153 | 1.421 | 0.016 | 0.090 | Up | |
| Carnitines | Propionylcarnitine | 1.483 | 1.949 | 0.008 | 0.061 | Up |
| Butyrylcarnitine | 1.695 | 3.034 | 0.045 | 0.146 | Up | |
| Phenylpropanoicacids | Hydroxyphenyllactic acid | 1.841 | 1.928 | 0.002 | 0.024 | Up |
| 3,4,5-trimethoxycinnamic acid | 1.243 | 1.640 | 0.013 | 0.081 | Up | |
| Indoles | 3-indolebutyric acid | 0.874 | 1.358 | 0.046 | 0.146 | Up |
| Peptides | Glycyl-l-leucine | 1.445 | 2.943 | 0.029 | 0.111 | Up |
| Pyridines | Nicotinic acid | 1.262 | 1.498 | 0.011 | 0.077 | Up |
LUAD: Lung adenocarcinoma, NL: Normal lung, VIP: Variable importance in projection