


Translate this page into:
Verification bias is common in cytopathology studies on diagnostic accuracy
-
Received: ,
Accepted: ,
This is an open-access article distributed under the terms of the Creative Commons Attribution-Noncommercial-Share Alike 3.0 Unported, which permits unrestricted use, distribution, and reproduction in any medium, provided the original work is properly cited.
This article was originally published by Medknow Publications & Media Pvt Ltd and was migrated to Scientific Scholar after the change of Publisher.
To the Editor,
I wish to comment on the study by Jain et al., entitled “Fine-needle aspiration cytology in diagnosis of salivary gland lesions: A study with histologic comparison.”[1] Studies based on comparisons with histologic reference standards are common in cytopathology; however, this type of study design, generally produces biased estimates of sensitivity and specificity known as verification bias.[23]
The impact of verification bias can be shown as follows. Consider a diagnostic test with a sensitivity, Sn, a specificity, Sp, and disease prevalence, θ. For such a test, the true positive rate, TP, false positive rate, FP, false negative rate, FN and true negative rate, TN, are:
TP = Sn θ (1.1)
FP = (1− θ) (1 − Sp) (1.2)
FN = θ (1 − Sn) (1.3)
TN = (1 − θ) Sp (1.4)
The verification rate is the proportion of samples that are verified by the gold standard. The positive and negative verification rates are designated as α and β, respectively. Verification bias occurs when the negative and positive verification rates differ (i.e. α ≠ β). We use the superscript “v” to designate accuracy statistics observed when verification bias is present. For example, TPv is the true positive rate observed under verification bias. When verification bias is present, the observed accuracy statistics are [Figure 1]:
TPv = Sn θ α (2.1)
FPv = (1− θ) (1 − Sp) α (2.2)
FNv = θ (1 − Sn) β (2.3)
TNv = (1 − θ) Sp β (2.4)
where α, β > 0.
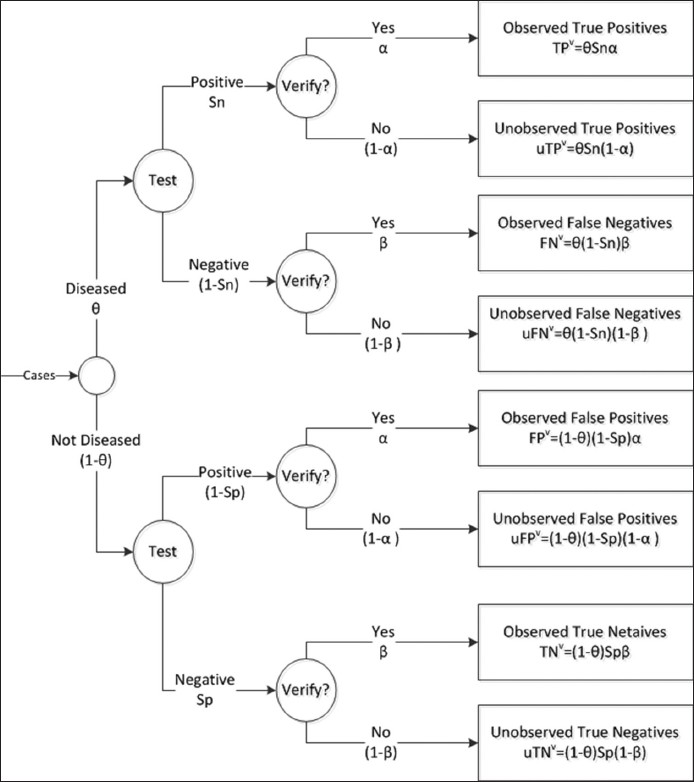
- Flow diagram illustrating verification bias. θ = disease prevalence, Sn = true sensitivity, Sp = true specificity, α = verification rate of positive test results, β = verification rate of negative test results. TPv, FNv, FPv, and TNv are the observed (i.e. verified) true positive, false negative, false positive, and true negative results, respectively. uTPv, uFNv, uFPv, and uTNv represent the unobserved (unverified) values
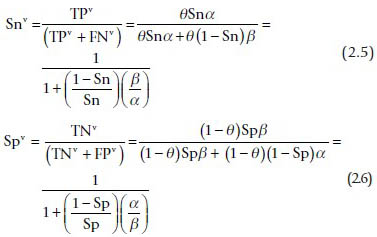
The observed sensitivity and specificity under verification bias are:
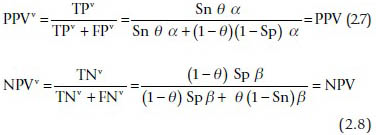
The observed positive and negative predictive values are unaffected by verification bias:
When verification bias is present, the bias in sensitivity and specificity are:
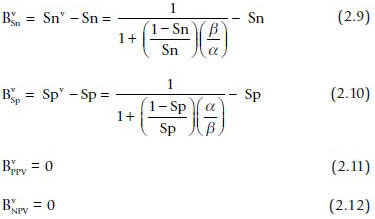
Equations 2.9 and 2.10 show that estimates of the sensitivity and specificity will be biased unless the verification rates for positive and negative fine-needle aspiration (FNA) samples are equivalent (i.e. α = β). In general, cases with a positive FNA diagnosis will be referred to surgery at a higher rate than cases with a negative diagnosis (α > β). As can be seen from Eqs. 2.9 and 2.10, this means that observed sensitivity will be greater than the true sensitivity and the observed specificity will be lower than the true sensitivity (negative bias). For example, suppose that Sn = 0.8, Sp = 0.9, and α/β =2. In this case, the observed sensitivity and specificity would be 0.89 (positive bias of 0.09) and 0.81 (negative bias of 0.09), respectively.
It is important to note that the predictive values are unaffected by the verification rates (Eqs. 2.11 and 2.12). Thus, the predictive values can be safely reported in studies based on surgical samples. However, predictive values depend on the prevalence and for that reason, can only be applied in a similar context.
Zhou et al., have published correction formulas that can be used to estimate the true sensitivity and specificity in studies with verification bias.[3] To apply these formulas, one must know the FNA diagnoses for all patients who received FNA. Jain et al., only reported FNA results for patients who were verified by surgery. Thus, it is impossible to estimate the extent of bias.
The STARD initiative provides guidelines for reporting of diagnostic accuracy studies.[456] These reporting guidelines are designed to enable readers to assess the potential for bias in diagnostic accuracy studies. Unfortunately, the results reported by Jain et al., are likely to be biased and because of inadequate reporting, the degree of bias cannot be determined. Diagnostic accuracy studies for FNA cytology commonly suffer from verification bias.[2] Although CytoJournal adopts the STARD guidelines,[7] authors and peer reviewers should be aware of the problem and adhere to the STARD guidelines for reporting of diagnostic accuracy studies.
COMPETING INTERESTS STATEMENT BY ALL AUTHORS
None to declare.
AUTHORSHIP STATEMENT BY ALL AUTHORS
Robert Schmidt is the sole contributor to this manuscript.
EDITORIAL/PEER-REVIEW STATEMENT
Editorial disclosure: The authors of the initial article (Ref.#1) could not be reached even after multiple attempts by the editorial team and did not reply to this letter.
REFERENCES
- Fine needle aspiration cytology in diagnosis of salivary gland lesions: A study with histologic comparison. Cytojournal. 2013;10:5.
- [Google Scholar]
- Verification bias in diagnostic accuracy studies for fine- and core needle biopsy of salivarygland lesions in otolaryngology journals: A systematic review and analysis. Head Neck 2013 [Epub ahead of print]
- [Google Scholar]
- Statistical Methods in Diagnostic Medicine, 2 nd ed. Hoboken, New Jersey: John Wiley and Sons; 1 Statistical Methods in Diagnostic Medicine, 2 nd ed Hoboken, New Jersey: John Wiley and Sons; 2011
- [Google Scholar]
- Towards complete and accurate reporting of studies of diagnostic accuracy: The STARD initiative. Ann Clin Biochem. 2003;40:357-63.
- [Google Scholar]
- The STARD statement for reporting studies of diagnostic accuracy: Explanation and elaboration. Ann Intern Med. 2003;138:W1-12.
- [Google Scholar]
- Instructions for CytoJournal Authors. Available from: http://www.cytojournal.com/contributors.asp
- [Google Scholar]